Estimated zip code population in 2022: 17,051 Zip code population in 2010: 15,401 Zip code population in 2000: 11,164
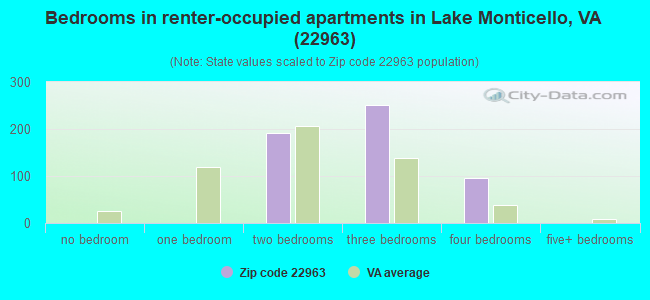
Houses and condos: 7,214 Renter-occupied apartments: 546
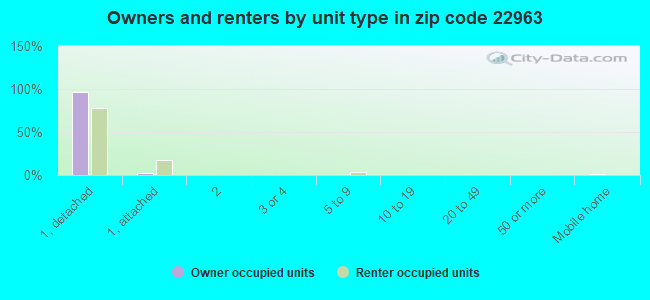
% of renters here:
8%
State:
33%
March 2022 cost of living index in zip code 22963: 92.4 (less than average, U.S. average is 100)
Land area: 121.7 sq. mi. Water area: 1.6 sq. mi.
Population density: 140 people per square mile
(very low).
OSM Map
General Map
Google Map
MSN Map
OSM Map
General Map
Google Map
MSN Map
OSM Map
General Map
Google Map
MSN Map
OSM Map
General Map
Google Map
MSN Map
Please wait while loading the map...
Real estate property taxes paid for housing units in 2022:
This zip code:
0.6% ($1,898)
Virginia:
0.7% ($2,617)
Median real estate property taxes paid for housing units with mortgages in 2022: $1,638 (0.6%) Median real estate property taxes paid for housing units with no mortgage in 2022: $2,572 (0.7%)
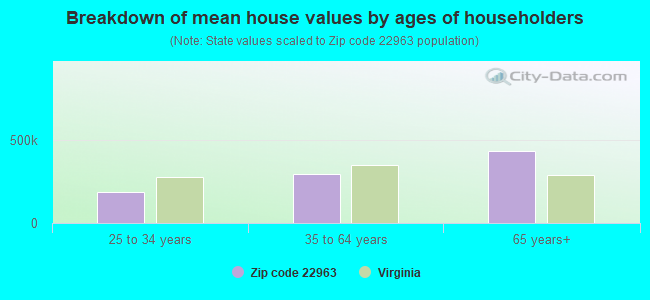
Estimated median house/condo value in 2022: $298,974
22963:
$298,974
Virginia:
$365,700
According to our research of Virginia and other state lists, there were 28 registered sex offenders living in 22963 zip code as of April 27, 2024. The ratio of all residents to sex offenders in zip code 22963 is 541 to 1. The ratio of registered sex offenders to all residents in this zip code is lower than the state average.
Median resident age:
This zip code:
42.1 years
Virginia median age:
39.0 years
Average household size:
This zip code:
2.6 people
Virginia:
2.5 people
Averages for the 2020 tax year for zip code 22963, filed in 2021:
Average Adjusted Gross Income (AGI) in 2020: $70,660 (Individual Income Tax Returns)
Here:
$70,660
State:
$86,446
Salary/wage: $60,370 (reported on 79.5% of returns)
Here:
$60,370
State:
$71,185
(% of AGI for various income ranges: 1133.4% for AGIs below $25k, 3452.4% for AGIs $25k-50k, 6230.2% for AGIs $50k-75k, 9010.7% for AGIs $75k-100k, 16194.3% for AGIs $100k-200k, 45743.3% for AGIs over 200k)
Taxable interest for individuals: $1,217 (reported on 31.8% of returns)
This zip code:
$1,217
Virginia:
$1,805
(% of AGI for various income ranges: 17.9% for AGIs below $25k, 23.9% for AGIs $25k-50k, 49.9% for AGIs $50k-75k, 63.5% for AGIs $75k-100k, 103.3% for AGIs $100k-200k, 584.2% for AGIs over 200k)
Ordinary dividends: $5,396 (reported on 22.7% of returns)
Here:
$5,396
State:
$8,327
(% of AGI for various income ranges: 39.6% for AGIs below $25k, 58.1% for AGIs $25k-50k, 130.7% for AGIs $50k-75k, 198.9% for AGIs $75k-100k, 416.5% for AGIs $100k-200k, 1760.0% for AGIs over 200k)
Net capital gain/loss in AGI: +$9,913 (reported on 19.9% of returns)
Here:
+$9,913
State:
+$24,644
(% of AGI for various income ranges: 9.5% for AGIs below $25k, 32.2% for AGIs $25k-50k, 96.7% for AGIs $50k-75k, 150.6% for AGIs $75k-100k, 486.6% for AGIs $100k-200k, 7615.0% for AGIs over 200k)
Profit/loss from business: +$12,231 (reported on 14.6% of returns)
Here:
+$12,231
State:
+$12,836
(% of AGI for various income ranges: 84.2% for AGIs below $25k, 127.8% for AGIs $25k-50k, 319.5% for AGIs $50k-75k, 284.0% for AGIs $75k-100k, 412.3% for AGIs $100k-200k, 2303.3% for AGIs over 200k)
Taxable individual retirement arrangement distribution: $20,283 (reported on 12.8% of returns)
22963:
$20,283
Virginia:
$21,535
(% of AGI for various income ranges: 84.4% for AGIs below $25k, 144.4% for AGIs $25k-50k, 238.4% for AGIs $50k-75k, 444.9% for AGIs $75k-100k, 872.1% for AGIs $100k-200k, 3716.7% for AGIs over 200k)
Self-employed (Keogh) retirement plans: $12,133 (reported on 0.4% of returns)
22963:
$12,133
Virginia:
$31,172
(% of AGI for various income ranges: 38.3% for AGIs $100k-200k)
Total itemized deductions: $27,026 (reported on 9.8% of returns)
Here:
$27,026
State:
$33,287
(% of AGI for various income ranges: 42.5% for AGIs below $25k, 109.7% for AGIs $25k-50k, 337.0% for AGIs $50k-75k, 475.4% for AGIs $75k-100k, 939.5% for AGIs $100k-200k, 3479.2% for AGIs over 200k)
Charity contributions: $7,583 (reported on 7.6% of returns)
Here:
$7,583
State:
$10,381
(% of AGI for various income ranges: 3.4% for AGIs below $25k, 14.0% for AGIs $25k-50k, 47.9% for AGIs $50k-75k, 84.9% for AGIs $75k-100k, 232.2% for AGIs $100k-200k, 1049.2% for AGIs over 200k)
Taxes paid: $7,322 (reported on 9.6% of returns)
22963:
$7,322
State:
$8,284
(% of AGI for various income ranges: 7.9% for AGIs below $25k, 22.8% for AGIs $25k-50k, 82.4% for AGIs $50k-75k, 135.4% for AGIs $75k-100k, 268.2% for AGIs $100k-200k, 930.8% for AGIs over 200k)
Earned income credit: $2,015 (reported on 10.5% of returns)
Here:
$2,015
State:
$2,214
(% of AGI for various income ranges: 63.6% for AGIs below $25k, 57.3% for AGIs $25k-50k)
Percentage of individuals using paid preparers for their 2020 taxes: 92.2%
Here:
92%
State:
92%
(% for various income ranges: 91.6% for AGIs below $25k, 93.5% for AGIs $25k-50k, 90.6% for AGIs $50k-75k, 92.5% for AGIs $75k-100k, 92.1% for AGIs $100k-200k, 93.8% for AGIs over 200k)
Averages for the 2012 tax year for zip code 22963, filed in 2013:
Average Adjusted Gross Income (AGI) in 2012: $60,884 (Individual Income Tax Returns)
Here:
$60,884
State:
$71,192
Salary/wage: $53,287 (reported on 81.1% of returns)
Here:
$53,287
State:
$59,229
(% of AGI for various income ranges: 72.1% for AGIs below $25k, 74.6% for AGIs $25k-50k, 72.7% for AGIs $50k-75k, 69.4% for AGIs $75k-100k, 73.6% for AGIs $100k-200k, 55.5% for AGIs over 200k)
Taxable interest for individuals: $1,008 (reported on 39.3% of returns)
This zip code:
$1,008
Virginia:
$1,600
(% of AGI for various income ranges: 1.2% for AGIs below $25k, 0.8% for AGIs $25k-50k, 0.7% for AGIs $50k-75k, 0.6% for AGIs $75k-100k, 0.6% for AGIs $100k-200k, 0.4% for AGIs over 200k)
Ordinary dividends: $4,071 (reported on 24.3% of returns)
Here:
$4,071
State:
$6,959
(% of AGI for various income ranges: 2.4% for AGIs below $25k, 1.3% for AGIs $25k-50k, 1.4% for AGIs $50k-75k, 1.3% for AGIs $75k-100k, 1.5% for AGIs $100k-200k, 3.1% for AGIs over 200k)
Net capital gain/loss in AGI: +$4,590 (reported on 17.9% of returns)
Here:
+$4,590
State:
+$16,672
(% of AGI for various income ranges: 0.3% for AGIs $25k-50k, 0.4% for AGIs $50k-75k, 0.5% for AGIs $75k-100k, 1.4% for AGIs $100k-200k, 7.3% for AGIs over 200k)
Profit/loss from business: +$10,962 (reported on 14.8% of returns)
Here:
+$10,962
State:
+$14,116
(% of AGI for various income ranges: 6.8% for AGIs below $25k, 2.8% for AGIs $25k-50k, 2.5% for AGIs $50k-75k, 2.1% for AGIs $75k-100k, 1.7% for AGIs $100k-200k, 5.0% for AGIs over 200k)
Taxable individual retirement arrangement distribution: $15,497 (reported on 14.6% of returns)
22963:
$15,497
Virginia:
$16,667
(% of AGI for various income ranges: 4.4% for AGIs below $25k, 3.8% for AGIs $25k-50k, 3.2% for AGIs $50k-75k, 3.7% for AGIs $75k-100k, 3.5% for AGIs $100k-200k, 5.1% for AGIs over 200k)
Self-employment retirement plans: $20,300 (reported on 0.3% of returns)
22963:
$20,300
Virginia:
$25,373
Total itemized deductions: $20,197 (22% of AGI, reported on 45.4% of returns)
Here:
$20,197
State:
$26,596
Here:
22.5% of AGI
State:
20.1% of AGI
(% of AGI for various income ranges: 14.5% for AGIs below $25k, 13.8% for AGIs $25k-50k, 15.0% for AGIs $50k-75k, 15.5% for AGIs $75k-100k, 15.6% for AGIs $100k-200k, 14.2% for AGIs over 200k)
Charity contributions: $3,309 (reported on 35.0% of returns)
Here:
$3,309
State:
$4,443
(% of AGI for various income ranges: 0.9% for AGIs below $25k, 1.3% for AGIs $25k-50k, 1.6% for AGIs $50k-75k, 2.1% for AGIs $75k-100k, 2.0% for AGIs $100k-200k, 3.3% for AGIs over 200k)
Taxes paid: $6,543 (reported on 45.2% of returns)
22963:
$6,543
State:
$9,951
(% of AGI for various income ranges: 2.5% for AGIs below $25k, 3.0% for AGIs $25k-50k, 4.1% for AGIs $50k-75k, 4.8% for AGIs $75k-100k, 6.0% for AGIs $100k-200k, 6.3% for AGIs over 200k)
Earned income credit: $2,035 (reported on 11.9% of returns)
Here:
$2,035
State:
$2,211
(% of AGI for various income ranges: 4.8% for AGIs below $25k, 0.9% for AGIs $25k-50k)
Percentage of individuals using paid preparers for their 2012 taxes: 36.6%
Here:
37%
State:
46%
(% for various income ranges: 33.0% for AGIs below $25k, 33.5% for AGIs $25k-50k, 38.8% for AGIs $50k-75k, 38.4% for AGIs $75k-100k, 40.7% for AGIs $100k-200k, 61.5% for AGIs over 200k)
Averages for the 2004 tax year for zip code 22963, filed in 2005:
Average Adjusted Gross Income (AGI) in 2004: $50,656 (Individual Income Tax Returns)
Here:
$50,656
State:
$56,704
Salary/wage: $44,524 (reported on 82.8% of returns)
Here:
$44,524
State:
$48,441
(% of AGI for various income ranges: 118.0% for AGIs below $10k, 70.3% for AGIs $10k-25k, 76.3% for AGIs $25k-50k, 76.3% for AGIs $50k-75k, 76.6% for AGIs $75k-100k, 63.1% for AGIs over 100k)
Taxable interest for individuals: $1,236 (reported on 50.2% of returns)
This zip code:
$1,236
Virginia:
$1,688
(% of AGI for various income ranges: 4.4% for AGIs below $10k, 2.5% for AGIs $10k-25k, 1.1% for AGIs $25k-50k, 1.0% for AGIs $50k-75k, 0.7% for AGIs $75k-100k, 1.5% for AGIs over 100k)
Taxable dividends: $2,633 (reported on 28.2% of returns)
Here:
$2,633
State:
$4,028
(% of AGI for various income ranges: 5.6% for AGIs below $10k, 2.2% for AGIs $10k-25k, 1.4% for AGIs $25k-50k, 1.1% for AGIs $50k-75k, 1.1% for AGIs $75k-100k, 1.9% for AGIs over 100k)
Net capital gain/loss: +$8,083 (reported on 22.9% of returns)
Here:
+$8,083
State:
+$14,375
(% of AGI for various income ranges: -2.3% for AGIs below $10k, 1.1% for AGIs $10k-25k, 0.7% for AGIs $25k-50k, 0.7% for AGIs $50k-75k, 1.4% for AGIs $75k-100k, 11.2% for AGIs over 100k)
Profit/loss from business: +$11,901 (reported on 15.6% of returns)
Here:
+$11,901
State:
+$13,342
(% of AGI for various income ranges: 0.7% for AGIs below $10k, 4.9% for AGIs $10k-25k, 4.2% for AGIs $25k-50k, 2.7% for AGIs $50k-75k, 2.3% for AGIs $75k-100k, 5.0% for AGIs over 100k)
IRA payment deduction: $3,012 (reported on 2.6% of returns)
22963:
$3,012
Virginia:
$2,943
(% of AGI for various income ranges: 0.1% for AGIs $10k-25k, 0.2% for AGIs $25k-50k, 0.2% for AGIs $50k-75k, 0.1% for AGIs $75k-100k, 0.2% for AGIs over 100k)
Self-employed pension: $11,378 (reported on 0.6% of returns)
Here:
$11,378
Virginia:
$17,430
Total itemized deductions: $16,170 (23% of AGI, reported on 49.0% of returns)
Here:
$16,170
State:
$21,492
Here:
22.7% of AGI
State:
21.0% of AGI
(% of AGI for various income ranges: 19.8% for AGIs below $10k, 13.7% for AGIs $10k-25k, 15.1% for AGIs $25k-50k, 16.7% for AGIs $50k-75k, 16.4% for AGIs $75k-100k, 14.7% for AGIs over 100k)
Charity contributions deductions: $2,580 (3% of AGI, reported on 40.2% of returns)
Here:
$2,580
State:
$3,794
Here:
3.4% of AGI
State:
3.5% of AGI
(% of AGI for various income ranges: 0.9% for AGIs below $10k, 1.1% for AGIs $10k-25k, 1.4% for AGIs $25k-50k, 2.0% for AGIs $50k-75k, 2.1% for AGIs $75k-100k, 2.8% for AGIs over 100k)
Total tax: $6,146 (reported on 82.8% of returns)
22963:
$6,146
State:
$9,537
(% of AGI for various income ranges: 3.1% for AGIs below $10k, 4.0% for AGIs $10k-25k, 6.9% for AGIs $25k-50k, 8.4% for AGIs $50k-75k, 10.2% for AGIs $75k-100k, 15.5% for AGIs over 100k)
Earned income credit: $1,617 (reported on 9.6% of returns)
Here:
$1,617
State:
$1,734
Percentage of individuals using paid preparers for their 2004 taxes: 45.9%
Here:
46%
State:
52%
(% for various income ranges: 38.1% for AGIs below $10k, 48.8% for AGIs $10k-25k, 46.4% for AGIs $25k-50k, 44.5% for AGIs $50k-75k, 45.3% for AGIs $75k-100k, 53.2% for AGIs over 100k)
Household received Food Stamps/SNAP in the past 12 months: 171 Household did not receive Food Stamps/SNAP in the past 12 months: 6,417
Women who had a birth in the past 12 months: 225 (208 now married, 21 unmarried) Women who did not have a birth in the past 12 months: 3,591 (1,830 now married, 1,749 unmarried)
Housing units in zip code 22963 with a mortgage: 4,325 (428 second mortgage, 349 both second mortgage and home equity loan) Houses without a mortgage: 59
Median monthly owner costs for units with a mortgage: $1,584 Median monthly owner costs for units without a mortgage: $610
Residents with income below the poverty level in 2022:
This zip code:
6.6%
Whole state:
10.6%
Residents with income below 50% of the poverty level in 2022:
This zip code:
3.9%
Whole state:
5.2%
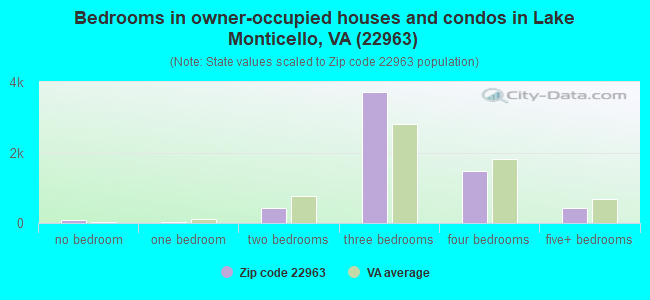
Median number of rooms in houses and condos:
Here:
6.5
State:
7.0
Median number of rooms in apartments:
Here:
5.1
State:
4.3
Notable locations in this zip code not listed on our city pages
Notable locations in zip code 22963: Shores (A), Yanceys Store (B), Central Plains (C), Center Hill Community Center (D), Treasurer and Commissioner Building (E), Fluvanna County Sheriff's Office (F), Palmyra Rescue Station (G), Huguenot Volunteer Fire Department (H), Fluvanna County Public Library (I), Fluvanna County Office Building (J), Palmyra Rescue Squad (K), Palmyra Volunteer Fire Department (L), Lake Monticello Fire and Rescue Squad (M), Fluvanna County Criminal Court (N). Display/hide their locations on the map
Churches in zip code 22963 include: Bethel Church (A), Saint James Church (B), Salem Church (C), Seay Chapel (D), Burning Bush Church (E), Shiloh Church (F), Effort Church (G), Evergreen Church (H), Union Church (I). Display/hide their locations on the map
Reservoirs: Monticello Pond (A), Lake View (B), Cosner Lake (C), Linton Lake (D), Lake Monticello (E), Fluvanna Ruritan Lake (F). Display/hide their locations on the map
Streams, rivers, and creeks: Williams Creek (A), Rockfish Creek (B), Raccoon Creek (C), Phils Creek (D), Martins Creek (E), Long Island Creek (F), Cunningham Creek (G), Burke Creek (H), Bremo Creek (I). Display/hide their locations on the map
Size of family households: 2,447 2-persons, 915 3-persons, 819 4-persons, 338 5-persons, 181 6-persons, 202 7-or-more-persons
Size of nonfamily households: 1,489 1-person, 206 2-persons, 70 3-persons
2,257 married couples with children.
728 single-parent households (180 men, 548 women).
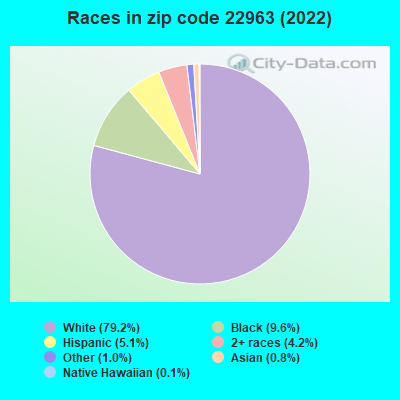
94.2% of residents of 22963 zip code speak English at home.
3.3% of residents speak Spanish at home (72% very well, 23% well, 5% not well).
1.4% of residents speak other Indo-European language at home (69% very well, 24% well, 6% not well).
0.9% of residents speak Asian or Pacific Island language at home (46% very well, 33% well, 21% not well).
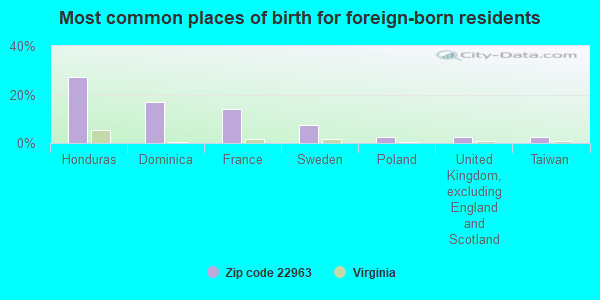
Foreign born population: 475 (2.8%) (89.0% of them are naturalized citizens)
This zip code:
2.8%
Whole state:
12.7%
27%Honduras
17%Dominica
14%France
7%Sweden
3%Poland
2%United Kingdom, excluding England and Scotland
2%Taiwan
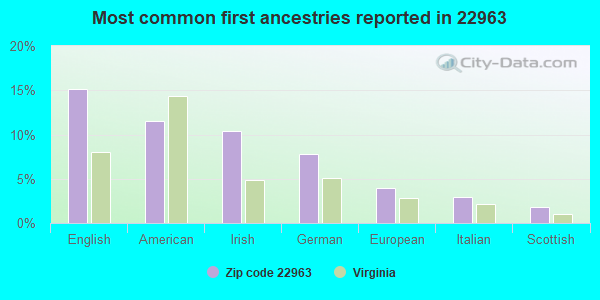
15%English
12%American
10%Irish
8%German
4%European
3%Italian
2%Scottish
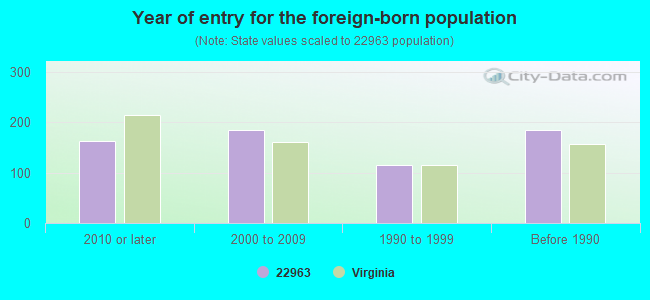
Year of entry for the foreign-born population
1622010 or later
1842000 to 2009
1151990 to 1999
185Before 1990
Facilities with environmental interests located in this zip code:
CENTRAL ELEMENTARY SCHOOL (ROUTE 649 in PALMYRA, VA)
AIR MINOR (AIRS/AFS) STATE MASTER (Virginia pollutants databases) - CEDS-40277, AIR PROGRAM Business SIC and NAICS classification: ELEMENTARY AND SECONDARY SCHOOLS Alternative names: CENTAL ELEMENTARY SCHOOL, CENTRAL ELEM.
BLUE RIDGE GOV SCHOOL (FLUVANNA CO PUBLIC SCHOOLS in PALMYRA, VA)
(National Center for Education Statistics) - STATE ID-2730010
Housing units lacking complete plumbing facilities: 0.9% Housing units lacking complete kitchen facilities: 1.5%
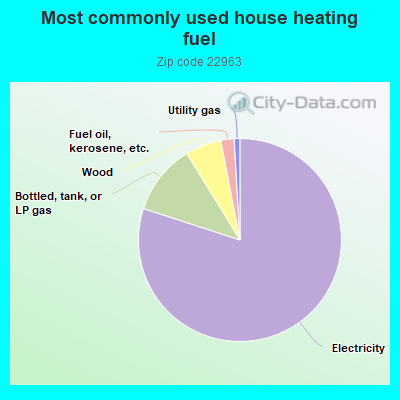
79.3%Electricity
11.1%Bottled, tank, or LP gas
5.7%Wood
2.1%Fuel oil, kerosene, etc.
0.9%Utility gas
Population in 1990: 5,689. Population change in the 1990s: +5,475 (+96.2%).
Place of birth for U.S.-born residents:
This state: 8,845
Northeast: 3,534
Midwest: 1,117
South: 1,795
West: 1,103
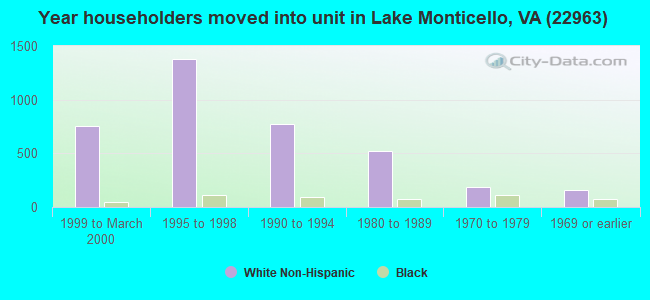
50% of the 22963 zip code residents lived in the same house 5 years ago. Out of people who lived in different houses, 29% lived in this county. Out of people who lived in different counties, 50% lived in Virginia.
91% of the 22963 zip code residents lived in the same house 1 year ago. Out of people who lived in different houses, 8% moved from this county. Out of people who lived in different houses, 56% moved from different county within same state. Out of people who lived in different houses, 41% moved from different state. Out of people who lived in different houses, 2% moved from abroad.
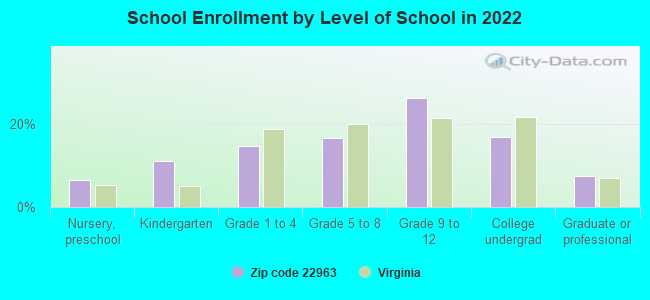
Private vs. public school enrollment:
Students in private schools in grades 1 to 8 (elementary and middle school): 183
Here:
16.9%
Virginia:
13.2%
Students in private schools in grades 9 to 12 (high school): 77
Here:
8.5%
Virginia:
10.2%
Students in private undergraduate colleges: 130
Here:
22.4%
Virginia:
18.7%
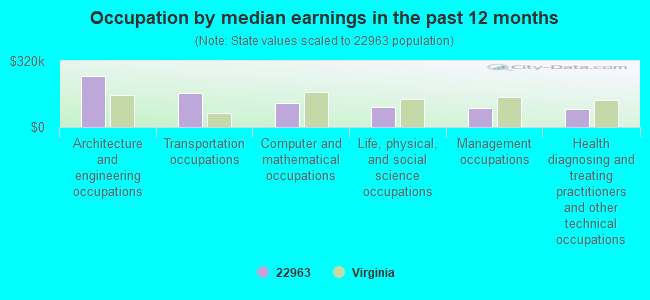
Occupation by median earnings in the past 12 months ($)
246,288Architecture and engineering occupations
167,257Transportation occupations
115,828Computer and mathematical occupations
96,917Life, physical, and social science occupations
93,902Management occupations
88,690Health diagnosing and treating practitioners and other technical occupations
Companies with federal contracts located in this zip code:
EASH, JOSEPH J (21 AMETHYST RD in PALMYRA, VA; small business)
$50,000 with Army for Defense Studies. Signed on 2005-09-23. Completion date: 2006-09-25.
THE-BBQ-CONNECTION (5 POWHATAN in PALMYRA, VA; small business) : $4,500 in 2 contractsin 2004
$6,500 with Army for Food Items For Resale. Signed on 2004-07-26. Completion date: 2004-07-27.
-$2,000, same as above.Signed on 2004-08-03. Completion date: 2004-07-27.
Top industries in this zip code by the number of employees in 2005:
Construction: Site Preparation Contractors (20-49: 2, 10-19: 2, 1-4: 1)
Other Services (except Public Administration): Commercial and Industrial Machinery and Equipment (except Automotive and Electronic) Repair and Maintenance (50-99: 1, 1-4: 1)
Other Services (except Public Administration): Other Similar Organizations (except Business, Professional, Labor, and Political Organizations) (50-99: 1)
Health Care and Social Assistance: Services for the Elderly and Persons with Disabilities (50-99: 1)
Accommodation and Food Services: Recreational and Vacation Camps (except Campgrounds) (50-99: 1)
Administrative and Support and Waste Management and Remediation Services: Landscaping Services (20-49: 1, 5-9: 3, 1-4: 3)
Construction: New Single-Family Housing Construction (except Operative Builders) (10-19: 1, 5-9: 3, 1-4: 11)
Fatal accident statistics in 2014:
Fatal accident count: 1
Vehicles involved in fatal accidents: 1
Fatal accidents caused by drunken drivers: 0
Fatalities: 1
Persons involved in fatal accidents: 2
Pedestrians involved in fatal accidents: 0
Fatal accident statistics in 2013:
Fatal accident count: 2
Vehicles involved in fatal accidents: 2
Fatal accidents caused by drunken drivers: 2
Fatalities: 3
Persons involved in fatal accidents: 3
Pedestrians involved in fatal accidents: 0
2004 - 2018 National Fire Incident Reporting System (NFIRS) incidents
According to the data from the years 2004 - 2018 the average number of fires per year is 25. The highest number of fires - 91 took place in 2005, and the least - 0 in 2017. The data has a dropping trend.
When looking into fire subcategories, the most reports belonged to: Structure Fires (43.9%), and Outside Fires (30.5%).
Fire incident types reported to NFIRS in Zip Code 22963

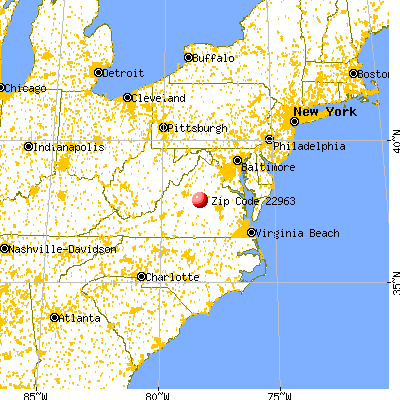


 Nearest zip codes: 23055, 23022, 22974, 23038, 23004, 24590.


 According to the data from the years 2004 - 2018 the average number of fires per year is 25. The highest number of fires - 91 took place in 2005, and the least - 0 in 2017. The data has a dropping trend.
 When looking into fire subcategories, the most reports belonged to: Structure Fires (43.9%), and Outside Fires (30.5%).