Estimated zip code population in 2022: 863 Zip code population in 2010: 1,088 Zip code population in 2000: 926
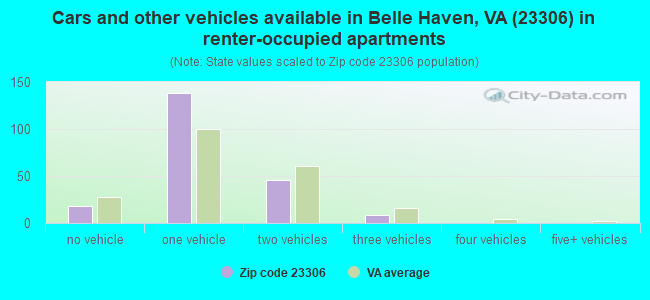
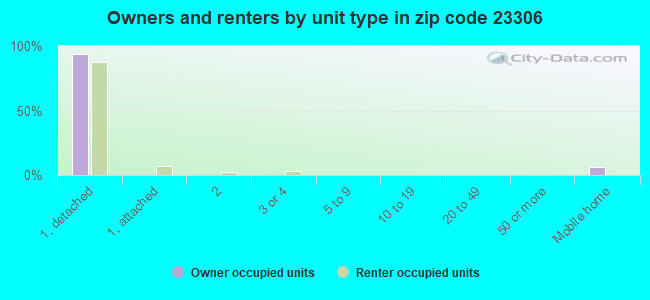
Houses and condos: 561 Renter-occupied apartments: 208
% of renters here:
50%
State:
33%
March 2022 cost of living index in zip code 23306: 87.4 (less than average, U.S. average is 100)
Land area: 14.6 sq. mi. Water area: 3.3 sq. mi.
Population density: 59 people per square mile
(very low).
OSM Map
General Map
Google Map
MSN Map
OSM Map
General Map
Google Map
MSN Map
OSM Map
General Map
Google Map
MSN Map
OSM Map
General Map
Google Map
MSN Map
Please wait while loading the map...
Real estate property taxes paid for housing units in 2022:
This zip code:
0.6% ($1,279)
Virginia:
0.7% ($2,617)
Median real estate property taxes paid for housing units with mortgages in 2022: $1,831 (0.6%) Median real estate property taxes paid for housing units with no mortgage in 2022: $985 (0.6%)
Business Search- 14 Million verified businesses
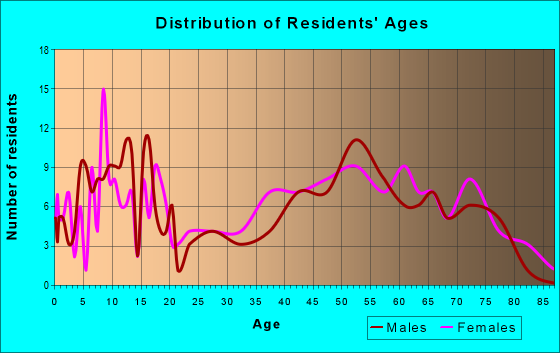
Males: 383
(44.4%)
Females: 480
(55.6%)
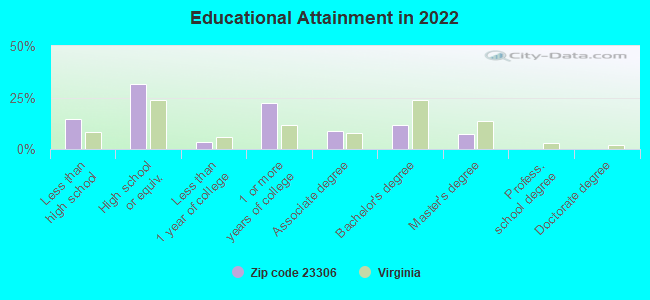
For population 25 years and over in 23306:
High school or higher: 83.5%
Bachelor's degree or higher: 18.4%
Graduate or professional degree: 7.1%
Mean travel time to work (commute): 20.2 minutes
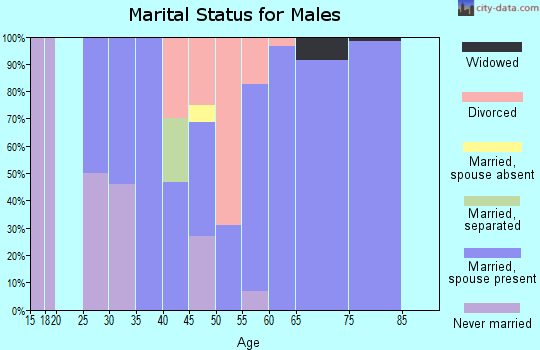
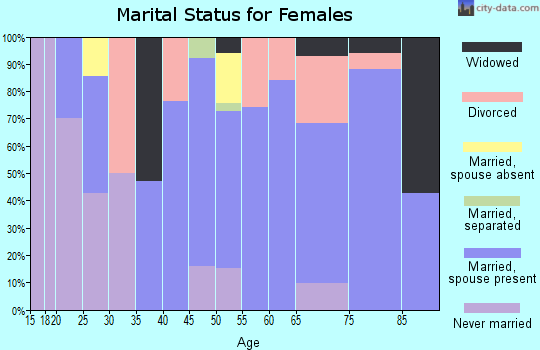
For population 15 years and over in 23306:
Never married: 37.4%
Now married: 43.2%
Separated: 5.4%
Widowed: 3.0%
Divorced: 11.0%
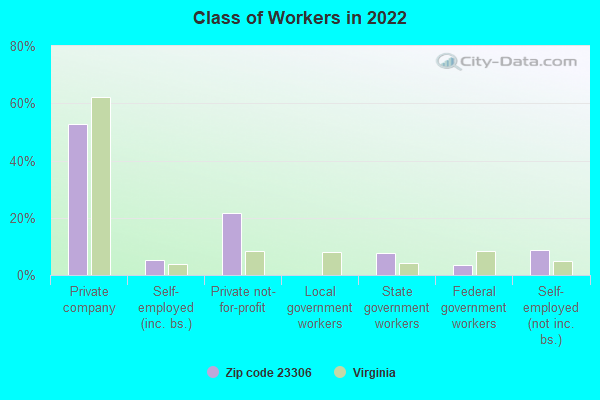
Zip code 23306 compared to state average:
Median household income below state average.
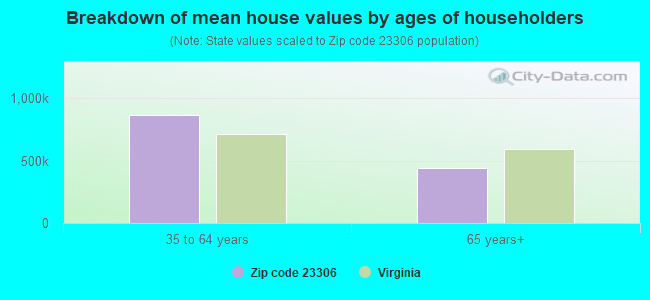
Median house value below state average.
Unemployed percentage significantly below state average.
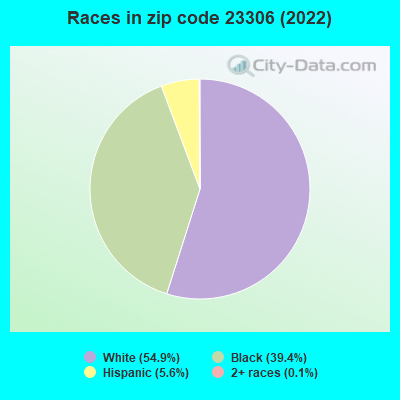
Black race population percentage above state average.
Hispanic race population percentage below state average.
Median age above state average.
Renting percentage above state average.
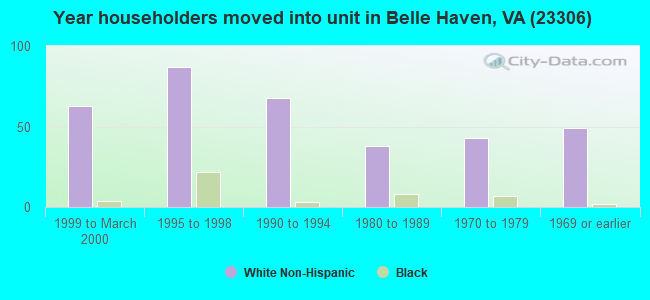
Length of stay since moving in significantly above state average.
Number of college students below state average.
Percentage of population with a bachelor's degree or higher below state average.
Estimated median house/condo value in 2022: $222,670
23306:
$222,670
Virginia:
$365,700
According to our research of Virginia and other state lists, there were 2 registered sex offenders living in 23306 zip code as of April 27, 2024. The ratio of all residents to sex offenders in zip code 23306 is 437 to 1. The ratio of registered sex offenders to all residents in this zip code is lower than the state average.
Median resident age:
This zip code:
45.8 years
Virginia median age:
39.0 years
Average household size:
This zip code:
2.1 people
Virginia:
2.5 people
Averages for the 2020 tax year for zip code 23306, filed in 2021:
Average Adjusted Gross Income (AGI) in 2020: $60,884 (Individual Income Tax Returns)
Here:
$60,884
State:
$86,446
Salary/wage: $48,274 (reported on 76.4% of returns)
Here:
$48,274
State:
$71,185
(% of AGI for various income ranges: 995.7% for AGIs below $25k, 3943.0% for AGIs $25k-50k, 7638.0% for AGIs $50k-75k, 7473.3% for AGIs $75k-100k, 22192.5% for AGIs $100k-200k)
Taxable interest for individuals: $1,455 (reported on 36.4% of returns)
This zip code:
$1,455
Virginia:
$1,805
(% of AGI for various income ranges: 22.1% for AGIs below $25k, 36.0% for AGIs $25k-50k, 126.0% for AGIs $50k-75k, 83.3% for AGIs $75k-100k, 340.0% for AGIs $100k-200k)
Ordinary dividends: $6,287 (reported on 27.3% of returns)
Here:
$6,287
State:
$8,327
(% of AGI for various income ranges: 135.0% for AGIs $25k-50k, 180.0% for AGIs $50k-75k, 723.3% for AGIs $75k-100k, 1252.5% for AGIs $100k-200k)
Net capital gain/loss in AGI: +$14,179 (reported on 25.5% of returns)
Here:
+$14,179
State:
+$24,644
(% of AGI for various income ranges: 33.0% for AGIs $25k-50k, 128.0% for AGIs $50k-75k, 270.0% for AGIs $75k-100k, 4517.5% for AGIs $100k-200k)
Profit/loss from business: +$4,025 (reported on 21.8% of returns)
Here:
+$4,025
State:
+$12,836
(% of AGI for various income ranges: 37.9% for AGIs below $25k, 150.0% for AGIs $25k-50k, 60.0% for AGIs $50k-75k, 625.0% for AGIs $100k-200k)
Taxable individual retirement arrangement distribution: $14,883 (reported on 10.9% of returns)
23306:
$14,883
Virginia:
$21,535
(% of AGI for various income ranges: 82.1% for AGIs below $25k, 236.0% for AGIs $50k-75k, 1650.0% for AGIs $100k-200k)
Total itemized deductions: $22,333 (reported on 5.5% of returns)
Here:
$22,333
State:
$33,287
(% of AGI for various income ranges: 1340.0% for AGIs $50k-75k)
Charity contributions: $8,000 (reported on 3.6% of returns)
Here:
$8,000
State:
$10,381
(% of AGI for various income ranges: 160.0% for AGIs $25k-50k)
Taxes paid: $6,200 (reported on 5.5% of returns)
23306:
$6,200
State:
$8,284
(% of AGI for various income ranges: 372.0% for AGIs $50k-75k)
Earned income credit: $2,420 (reported on 18.2% of returns)
Here:
$2,420
State:
$2,214
(% of AGI for various income ranges: 105.0% for AGIs below $25k, 95.0% for AGIs $25k-50k)
Percentage of individuals using paid preparers for their 2020 taxes: 90.9%
Here:
91%
State:
92%
(% for various income ranges: 89.5% for AGIs below $25k, 85.7% for AGIs $25k-50k, 88.9% for AGIs $50k-75k, 100.0% for AGIs $75k-100k, 100.0% for AGIs $100k-200k, 100.0% for AGIs over 200k)
Averages for the 2012 tax year for zip code 23306, filed in 2013:
Average Adjusted Gross Income (AGI) in 2012: $50,704 (Individual Income Tax Returns)
Here:
$50,704
State:
$71,192
Salary/wage: $40,514 (reported on 79.2% of returns)
Here:
$40,514
State:
$59,229
(% of AGI for various income ranges: 74.2% for AGIs below $25k, 73.2% for AGIs $25k-50k, 69.3% for AGIs $50k-75k, 58.5% for AGIs $75k-100k, 56.4% for AGIs $100k-200k)
Taxable interest for individuals: $1,715 (reported on 37.7% of returns)
This zip code:
$1,715
Virginia:
$1,600
(% of AGI for various income ranges: 1.9% for AGIs below $25k, 1.4% for AGIs $25k-50k, 0.6% for AGIs $50k-75k, 2.3% for AGIs $75k-100k, 1.0% for AGIs $100k-200k)
Ordinary dividends: $6,075 (reported on 22.6% of returns)
Here:
$6,075
State:
$6,959
(% of AGI for various income ranges: 1.1% for AGIs below $25k, 1.0% for AGIs $25k-50k, 1.8% for AGIs $50k-75k, 4.8% for AGIs $100k-200k)
Net capital gain/loss in AGI: +$2,170 (reported on 18.9% of returns)
Here:
+$2,170
State:
+$16,672
(% of AGI for various income ranges: 2.0% for AGIs $100k-200k)
Profit/loss from business: +$6,100 (reported on 17.0% of returns)
Here:
+$6,100
State:
+$14,116
(% of AGI for various income ranges: 10.4% for AGIs below $25k, 2.4% for AGIs $25k-50k, 4.2% for AGIs $75k-100k)
Taxable individual retirement arrangement distribution: $12,044 (reported on 17.0% of returns)
23306:
$12,044
Virginia:
$16,667
(% of AGI for various income ranges: 8.8% for AGIs below $25k, 7.8% for AGIs $50k-75k, 4.2% for AGIs $100k-200k)
Total itemized deductions: $23,500 (27% of AGI, reported on 34.0% of returns)
Here:
$23,500
State:
$26,596
Here:
26.7% of AGI
State:
20.1% of AGI
(% of AGI for various income ranges: 10.0% for AGIs below $25k, 15.1% for AGIs $25k-50k, 17.1% for AGIs $50k-75k, 14.0% for AGIs $75k-100k, 17.4% for AGIs $100k-200k)
Charity contributions: $4,740 (reported on 28.3% of returns)
Here:
$4,740
State:
$4,443
(% of AGI for various income ranges: 2.5% for AGIs $25k-50k, 2.5% for AGIs $50k-75k, 3.6% for AGIs $75k-100k, 3.1% for AGIs $100k-200k)
Taxes paid: $6,061 (reported on 34.0% of returns)
23306:
$6,061
State:
$9,951
(% of AGI for various income ranges: 1.8% for AGIs below $25k, 2.7% for AGIs $25k-50k, 3.8% for AGIs $50k-75k, 4.4% for AGIs $75k-100k, 5.1% for AGIs $100k-200k)
Earned income credit: $2,660 (reported on 18.9% of returns)
Here:
$2,660
State:
$2,211
(% of AGI for various income ranges: 8.0% for AGIs below $25k, 0.8% for AGIs $25k-50k)
Percentage of individuals using paid preparers for their 2012 taxes: 58.5%
Here:
58%
State:
46%
(% for various income ranges: 54.5% for AGIs below $25k, 58.3% for AGIs $25k-50k, 71.4% for AGIs $50k-75k, 50.0% for AGIs $75k-100k, 62.5% for AGIs $100k-200k)
Averages for the 2004 tax year for zip code 23306, filed in 2005:
Average Adjusted Gross Income (AGI) in 2004: $46,080 (Individual Income Tax Returns)
Here:
$46,080
State:
$56,704
Salary/wage: $34,796 (reported on 84.0% of returns)
Here:
$34,796
State:
$48,441
(% of AGI for various income ranges: 118.0% for AGIs below $10k, 79.4% for AGIs $10k-25k, 79.9% for AGIs $25k-50k, 64.7% for AGIs $50k-75k, 58.9% for AGIs $75k-100k, 52.2% for AGIs over 100k)
Taxable interest for individuals: $2,283 (reported on 44.6% of returns)
This zip code:
$2,283
Virginia:
$1,688
(% of AGI for various income ranges: 1.0% for AGIs below $10k, 4.2% for AGIs $10k-25k, 1.6% for AGIs $25k-50k, 2.3% for AGIs $50k-75k, 1.2% for AGIs $75k-100k, 2.3% for AGIs over 100k)
Taxable dividends: $5,783 (reported on 28.3% of returns)
Here:
$5,783
State:
$4,028
(% of AGI for various income ranges: 0.7% for AGIs below $10k, 1.8% for AGIs $10k-25k, 2.5% for AGIs $25k-50k, 1.5% for AGIs $50k-75k, 2.1% for AGIs $75k-100k, 5.9% for AGIs over 100k)
Net capital gain/loss: +$10,162 (reported on 19.5% of returns)
Here:
+$10,162
State:
+$14,375
(% of AGI for various income ranges: -0.2% for AGIs $10k-25k, 0.4% for AGIs $25k-50k, -0.8% for AGIs $50k-75k, 1.0% for AGIs $75k-100k, 10.5% for AGIs over 100k)
Profit/loss from business: +$8,696 (reported on 14.7% of returns)
Here:
+$8,696
State:
+$13,342
(% of AGI for various income ranges: 3.9% for AGIs $10k-25k, 0.3% for AGIs $25k-50k, 1.4% for AGIs $50k-75k, -0.9% for AGIs $75k-100k, 5.5% for AGIs over 100k)
IRA payment deduction: $2,222 (reported on 3.3% of returns)
23306:
$2,222
Virginia:
$2,943
Total itemized deductions: $21,678 (22% of AGI, reported on 28.3% of returns)
Here:
$21,678
State:
$21,492
Here:
22.3% of AGI
State:
21.0% of AGI
(% of AGI for various income ranges: 8.9% for AGIs $10k-25k, 8.4% for AGIs $25k-50k, 14.1% for AGIs $50k-75k, 18.1% for AGIs $75k-100k, 14.6% for AGIs over 100k)
Charity contributions deductions: $5,118 (5% of AGI, reported on 25.3% of returns)
Here:
$5,118
State:
$3,794
Here:
5.2% of AGI
State:
3.5% of AGI
(% of AGI for various income ranges: 4.2% for AGIs below $10k, 1.4% for AGIs $25k-50k, 2.5% for AGIs $50k-75k, 2.4% for AGIs $75k-100k, 4.3% for AGIs over 100k)
Total tax: $7,682 (reported on 70.1% of returns)
23306:
$7,682
State:
$9,537
(% of AGI for various income ranges: 2.2% for AGIs below $10k, 2.8% for AGIs $10k-25k, 6.8% for AGIs $25k-50k, 8.6% for AGIs $50k-75k, 10.4% for AGIs $75k-100k, 18.0% for AGIs over 100k)
Earned income credit: $1,915 (reported on 21.9% of returns)
Here:
$1,915
State:
$1,734
Percentage of individuals using paid preparers for their 2004 taxes: 59.3%
Here:
59%
State:
52%
(% for various income ranges: 50.9% for AGIs below $10k, 59.2% for AGIs $10k-25k, 56.6% for AGIs $25k-50k, 57.7% for AGIs $50k-75k, 63.6% for AGIs $75k-100k, 81.1% for AGIs over 100k)
Household received Food Stamps/SNAP in the past 12 months: 41 Household did not receive Food Stamps/SNAP in the past 12 months: 375
Women who had a birth in the past 12 months: 12 (12 now married, 0 unmarried) Women who did not have a birth in the past 12 months: 268 (64 now married, 205 unmarried)
Housing units in zip code 23306 with a mortgage: 77 (5 second mortgage, 4 both second mortgage and home equity loan) Houses without a mortgage: 3
Median monthly owner costs for units with a mortgage: $1,280 Median monthly owner costs for units without a mortgage: $522
Residents with income below the poverty level in 2022:
This zip code:
3.5%
Whole state:
10.6%
Residents with income below 50% of the poverty level in 2022:
This zip code:
1.2%
Whole state:
5.2%
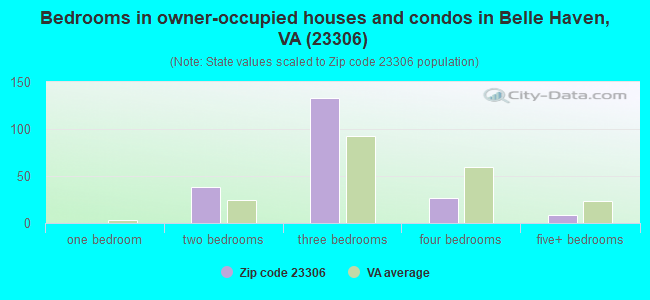
Median number of rooms in houses and condos:
Here:
6.4
State:
7.0
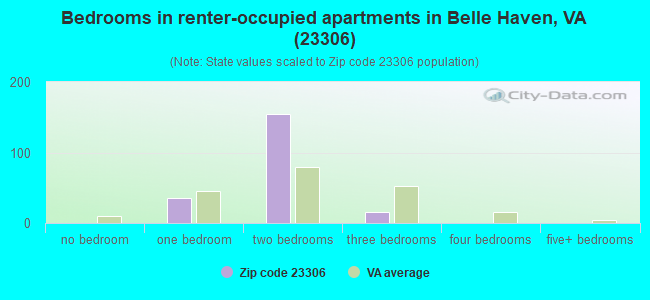
Median number of rooms in apartments:
Here:
3.2
State:
4.3
Notable locations in this zip code not listed on our city pages
Size of family households: 119 2-persons, 11 3-persons, 61 4-persons
Size of nonfamily households: 205 1-person, 19 2-persons
28 married couples with children.
92 single-parent households (92 women).
78.8% of residents of 23306 zip code speak English at home.
4.3% of residents speak Spanish at home (15% very well, 85% well).
16.4% of residents speak other Indo-European language at home (72% very well, 28% not well).
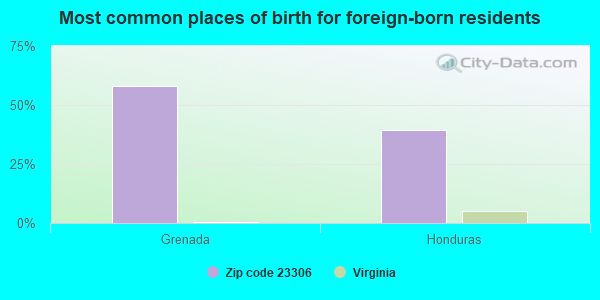
Foreign born population: 99 (11.5%) (34.1% of them are naturalized citizens)
This zip code:
11.5%
Whole state:
12.7%
58%Grenada
39%Honduras
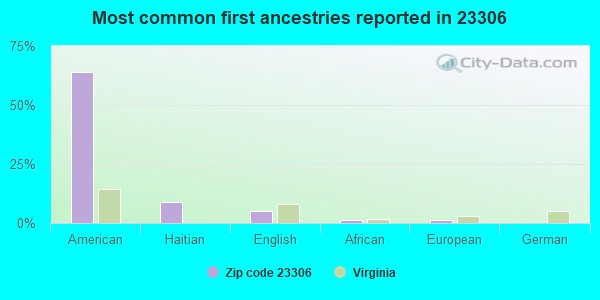
64%American
9%Haitian
5%English
1%African
1%European
0%German
0%Northern European
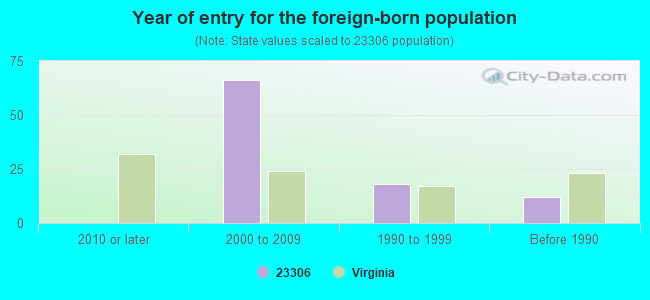
Year of entry for the foreign-born population
02010 or later
662000 to 2009
181990 to 1999
12Before 1990
Housing units lacking complete plumbing facilities: 9.0% Housing units lacking complete kitchen facilities: 9.3%
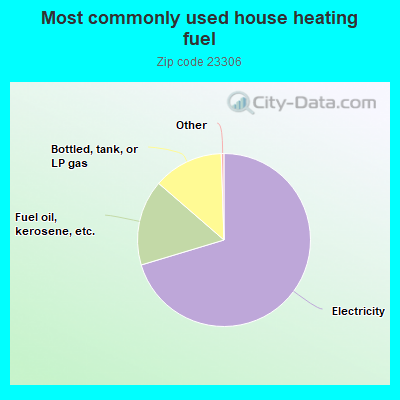
70.7%Electricity
16.1%Fuel oil, kerosene, etc.
13.2%Bottled, tank, or LP gas
Population in 1990: 344. Population change in the 1990s: +582 (+169.2%).
Place of birth for U.S.-born residents:
This state: 539
Northeast: 60
Midwest: 1
South: 141
West: 14
62% of the 23306 zip code residents lived in the same house 5 years ago. Out of people who lived in different houses, 54% lived in this county. Out of people who lived in different counties, 50% lived in Virginia.
81% of the 23306 zip code residents lived in the same house 1 year ago. Out of people who lived in different houses, 83% moved from this county. Out of people who lived in different houses, 4% moved from different county within same state. Out of people who lived in different houses, 1% moved from different state.
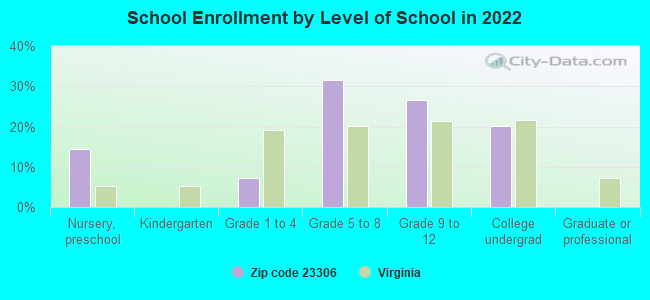
Private vs. public school enrollment:
Students in private schools in grades 1 to 8 (elementary and middle school):
Here:
0.0%
Virginia:
13.2%
Students in private schools in grades 9 to 12 (high school):
Here:
0.0%
Virginia:
10.2%
Students in private undergraduate colleges:
Here:
0.0%
Virginia:
18.7%
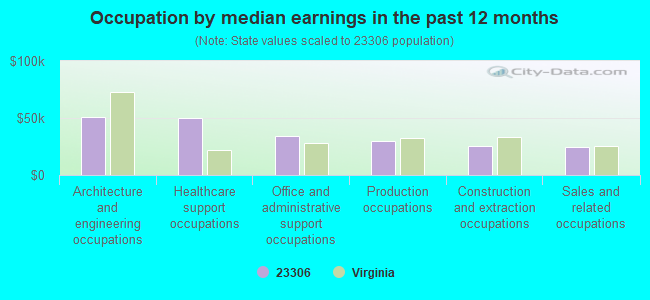
Occupation by median earnings in the past 12 months ($)
51,104Architecture and engineering occupations
49,999Healthcare support occupations
34,458Office and administrative support occupations
29,552Production occupations
25,108Construction and extraction occupations
24,154Sales and related occupations
Companies with federal contracts located in this zip code:
GLOBAL MAPPING SYSTEMS INC (15480 MERRY CAT LANE in BELLE HAVEN, VA; small business) : $71,658 in 3 contractsfrom 2002 to 2003
$53,700 with Army for Digital Maps, Charts & Geoditic Products. Taking place in TX. Signed on 2002-07-26. Completion date: 2002-09-30.
$17,959, same as above.Signed on 2003-06-21. Completion date: 2003-07-10.
-$1, same as above.Signed on 2003-07-18. Completion date: 2002-09-30.
Top industries in this zip code by the number of employees in 2005:
Health Care and Social Assistance: Home Health Care Services (50-99 employees: 1 establishment)
Health Care and Social Assistance: Child and Youth Services (10-19: 2)
Wholesale Trade: Beer and Ale Merchant Wholesalers (10-19: 1)
Wholesale Trade: Other Miscellaneous Nondurable Goods Merchant Wholesalers (10-19: 1)
Construction: Site Preparation Contractors (10-19: 1)
People in group quarters in 2010:
17 people in group homes intended for adults
People in group quarters in 2000:
15 people in homes for the mentally retarded
Fatal accident statistics in 2014:
Fatal accident count: 1
Vehicles involved in fatal accidents: 1
Fatal accidents caused by drunken drivers: 0
Fatalities: 1
Persons involved in fatal accidents: 1
Pedestrians involved in fatal accidents: 0
Fatal accident statistics in 2011:
Fatal accident count: 1
Vehicles involved in fatal accidents: 2
Fatal accidents caused by drunken drivers: 0
Fatalities: 1
Persons involved in fatal accidents: 5
Pedestrians involved in fatal accidents: 0
2002 - 2018 National Fire Incident Reporting System (NFIRS) incidents
According to the data from the years 2002 - 2018 the average number of fire incidents per year is 9. The highest number of fire incidents - 15 took place in 2012, and the least - 2 in 2014. The data has a constant trend.
When looking into fire subcategories, the most reports belonged to: Structure Fires (53.1%), and Outside Fires (27.6%).
Fire incident types reported to NFIRS in Zip Code 23306
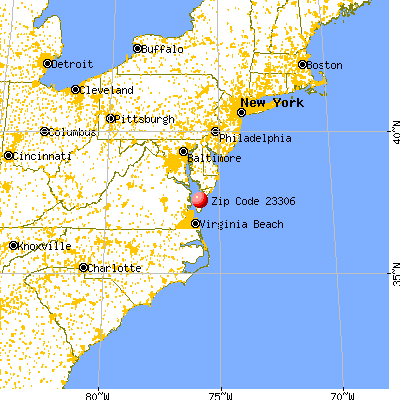


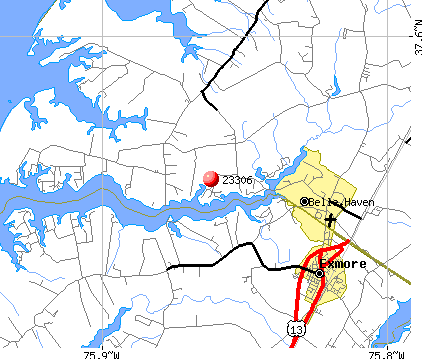 Nearest zip codes: 23350, 23420, 23486, 23398, 23422, 23413.
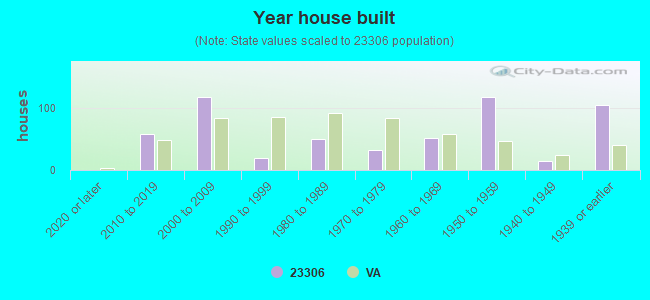


 : $71,658 in 3 contracts from 2002 to 2003
 According to the data from the years 2002 - 2018 the average number of fire incidents per year is 9. The highest number of fire incidents - 15 took place in 2012, and the least - 2 in 2014. The data has a constant trend.
 When looking into fire subcategories, the most reports belonged to: Structure Fires (53.1%), and Outside Fires (27.6%).