Estimated zip code population in 2022: 1,944 Zip code population in 2010: 1,597 Zip code population in 2000: 1,580
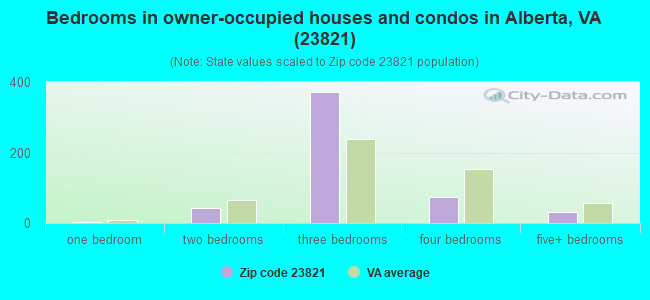
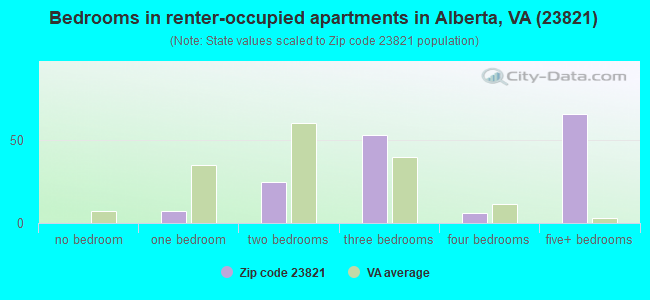
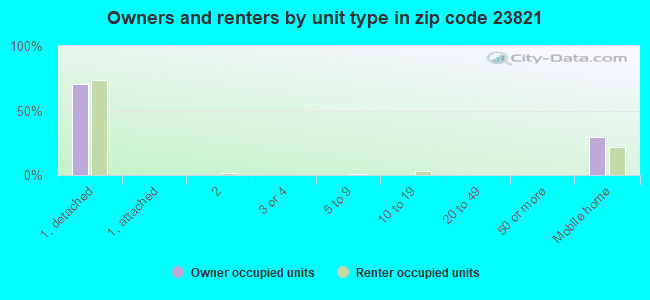
Houses and condos: 888 Renter-occupied apartments: 155
% of renters here:
23%
State:
33%
March 2022 cost of living index in zip code 23821: 84.5 (less than average, U.S. average is 100)
Land area: 64.9 sq. mi. Water area: 0.1 sq. mi.
Population density: 30 people per square mile
(very low).
OSM Map
General Map
Google Map
MSN Map
OSM Map
General Map
Google Map
MSN Map
OSM Map
General Map
Google Map
MSN Map
OSM Map
General Map
Google Map
MSN Map
Please wait while loading the map...
Real estate property taxes paid for housing units in 2022:
This zip code:
0.4% ($570)
Virginia:
0.7% ($2,617)
Median real estate property taxes paid for housing units with mortgages in 2022: $621 (0.4%) Median real estate property taxes paid for housing units with no mortgage in 2022: $532 (0.5%)
Averages for the 2020 tax year for zip code 23821, filed in 2021:
Average Adjusted Gross Income (AGI) in 2020: $47,241 (Individual Income Tax Returns)
Here:
$47,241
State:
$86,446
Salary/wage: $41,084 (reported on 81.2% of returns)
Here:
$41,084
State:
$71,185
(% of AGI for various income ranges: 1338.9% for AGIs below $25k, 3531.2% for AGIs $25k-50k, 5938.8% for AGIs $50k-75k, 8820.0% for AGIs $75k-100k, 21780.0% for AGIs $100k-200k)
Taxable interest for individuals: $307 (reported on 20.3% of returns)
This zip code:
$307
Virginia:
$1,805
(% of AGI for various income ranges: 2.6% for AGIs below $25k, 3.1% for AGIs $25k-50k, 18.8% for AGIs $50k-75k, 60.0% for AGIs $100k-200k)
Ordinary dividends: $2,729 (reported on 10.1% of returns)
Here:
$2,729
State:
$8,327
(% of AGI for various income ranges: 58.8% for AGIs $25k-50k, 242.5% for AGIs $75k-100k)
Net capital gain/loss in AGI: +$3,033 (reported on 8.7% of returns)
Here:
+$3,033
State:
+$24,644
(% of AGI for various income ranges: 16.9% for AGIs $25k-50k, 387.5% for AGIs $75k-100k)
Profit/loss from business: +$86 (reported on 10.1% of returns)
Here:
+$86
State:
+$12,836
(% of AGI for various income ranges: 92.5% for AGIs $50k-75k)
Taxable individual retirement arrangement distribution: $8,800 (reported on 7.2% of returns)
23821:
$8,800
Virginia:
$21,535
(% of AGI for various income ranges: 550.0% for AGIs $50k-75k)
Total itemized deductions: $26,725 (reported on 5.8% of returns)
Here:
$26,725
State:
$33,287
(% of AGI for various income ranges: 1336.2% for AGIs $50k-75k)
Charity contributions: $12,233 (reported on 4.3% of returns)
Here:
$12,233
State:
$10,381
(% of AGI for various income ranges: 458.8% for AGIs $50k-75k)
Taxes paid: $4,600 (reported on 5.8% of returns)
23821:
$4,600
State:
$8,284
(% of AGI for various income ranges: 230.0% for AGIs $50k-75k)
Earned income credit: $2,606 (reported on 23.2% of returns)
Here:
$2,606
State:
$2,214
(% of AGI for various income ranges: 146.8% for AGIs below $25k, 86.2% for AGIs $25k-50k)
Percentage of individuals using paid preparers for their 2020 taxes: 94.2%
Here:
94%
State:
92%
(% for various income ranges: 95.8% for AGIs below $25k, 90.5% for AGIs $25k-50k, 91.7% for AGIs $50k-75k, 100.0% for AGIs $75k-100k, 100.0% for AGIs $100k-200k)
Averages for the 2012 tax year for zip code 23821, filed in 2013:
Average Adjusted Gross Income (AGI) in 2012: $37,117 (Individual Income Tax Returns)
Here:
$37,117
State:
$71,192
Salary/wage: $32,731 (reported on 88.4% of returns)
Here:
$32,731
State:
$59,229
(% of AGI for various income ranges: 76.7% for AGIs below $25k, 78.8% for AGIs $25k-50k, 79.7% for AGIs $50k-75k, 81.1% for AGIs $75k-100k, 71.0% for AGIs $100k-200k)
Taxable interest for individuals: $424 (reported on 24.6% of returns)
This zip code:
$424
Virginia:
$1,600
(% of AGI for various income ranges: 0.3% for AGIs below $25k, 0.4% for AGIs $25k-50k, 0.2% for AGIs $50k-75k, 0.2% for AGIs $75k-100k, 0.1% for AGIs $100k-200k)
Ordinary dividends: $1,300 (reported on 10.1% of returns)
Here:
$1,300
State:
$6,959
Net capital gain/loss in AGI: +$1,300 (reported on 7.2% of returns)
Here:
+$1,300
State:
+$16,672
Profit/loss from business: +$5,571 (reported on 10.1% of returns)
Here:
+$5,571
State:
+$14,116
(% of AGI for various income ranges: 4.8% for AGIs below $25k, 2.3% for AGIs $25k-50k)
Taxable individual retirement arrangement distribution: $5,800 (reported on 7.2% of returns)
23821:
$5,800
Virginia:
$16,667
Total itemized deductions: $19,400 (33% of AGI, reported on 21.7% of returns)
Here:
$19,400
State:
$26,596
Here:
33.3% of AGI
State:
20.1% of AGI
(% of AGI for various income ranges: 6.5% for AGIs below $25k, 12.4% for AGIs $25k-50k, 9.1% for AGIs $50k-75k, 27.3% for AGIs $75k-100k)
Charity contributions: $4,608 (reported on 17.4% of returns)
Here:
$4,608
State:
$4,443
(% of AGI for various income ranges: 2.9% for AGIs $25k-50k, 1.8% for AGIs $50k-75k, 5.3% for AGIs $75k-100k)
Taxes paid: $3,547 (reported on 21.7% of returns)
23821:
$3,547
State:
$9,951
(% of AGI for various income ranges: 2.1% for AGIs $25k-50k, 1.8% for AGIs $50k-75k, 6.4% for AGIs $75k-100k)
Earned income credit: $2,528 (reported on 26.1% of returns)
Here:
$2,528
State:
$2,211
(% of AGI for various income ranges: 8.8% for AGIs below $25k, 1.1% for AGIs $25k-50k)
Percentage of individuals using paid preparers for their 2012 taxes: 47.8%
Here:
48%
State:
46%
(% for various income ranges: 48.3% for AGIs below $25k, 43.5% for AGIs $25k-50k, 55.6% for AGIs $50k-75k, 80.0% for AGIs $75k-100k)
Averages for the 2004 tax year for zip code 23821, filed in 2005:
Average Adjusted Gross Income (AGI) in 2004: $31,510 (Individual Income Tax Returns)
Here:
$31,510
State:
$56,704
Salary/wage: $27,669 (reported on 87.8% of returns)
Here:
$27,669
State:
$48,441
(% of AGI for various income ranges: 98.5% for AGIs below $10k, 82.1% for AGIs $10k-25k, 79.5% for AGIs $25k-50k, 82.0% for AGIs $50k-75k, 85.7% for AGIs $75k-100k, 44.0% for AGIs over 100k)
Taxable interest for individuals: $880 (reported on 27.8% of returns)
This zip code:
$880
Virginia:
$1,688
(% of AGI for various income ranges: 2.9% for AGIs below $10k, 0.6% for AGIs $10k-25k, 1.0% for AGIs $25k-50k, 0.5% for AGIs $50k-75k, 0.2% for AGIs $75k-100k, 1.1% for AGIs over 100k)
Taxable dividends: $1,274 (reported on 11.7% of returns)
Here:
$1,274
State:
$4,028
(% of AGI for various income ranges: 0.2% for AGIs $10k-25k, 0.4% for AGIs $25k-50k, 0.7% for AGIs $50k-75k, 0.9% for AGIs over 100k)
Net capital gain/loss: +$10,426 (reported on 8.5% of returns)
Here:
+$10,426
State:
+$14,375
(% of AGI for various income ranges: 1.7% for AGIs below $10k, -0.1% for AGIs $25k-50k, -0.2% for AGIs $50k-75k, 21.7% for AGIs over 100k)
Profit/loss from business: +$6,531 (reported on 8.9% of returns)
Here:
+$6,531
State:
+$13,342
(% of AGI for various income ranges: 6.1% for AGIs below $10k, 4.0% for AGIs $10k-25k, 1.3% for AGIs $25k-50k, 2.4% for AGIs $50k-75k)
Total itemized deductions: $13,577 (24% of AGI, reported on 22.6% of returns)
Here:
$13,577
State:
$21,492
Here:
24.4% of AGI
State:
21.0% of AGI
(% of AGI for various income ranges: 7.3% for AGIs $10k-25k, 10.5% for AGIs $25k-50k, 10.9% for AGIs $50k-75k, 10.7% for AGIs $75k-100k, 10.4% for AGIs over 100k)
Charity contributions deductions: $3,162 (5% of AGI, reported on 19.7% of returns)
Here:
$3,162
State:
$3,794
Here:
5.5% of AGI
State:
3.5% of AGI
(% of AGI for various income ranges: 0.8% for AGIs $10k-25k, 2.5% for AGIs $25k-50k, 2.3% for AGIs $50k-75k, 1.8% for AGIs $75k-100k, 2.3% for AGIs over 100k)
Total tax: $3,755 (reported on 67.5% of returns)
23821:
$3,755
State:
$9,537
(% of AGI for various income ranges: 1.9% for AGIs below $10k, 3.2% for AGIs $10k-25k, 6.1% for AGIs $25k-50k, 9.0% for AGIs $50k-75k, 10.2% for AGIs $75k-100k, 17.3% for AGIs over 100k)
Earned income credit: $1,956 (reported on 28.6% of returns)
Here:
$1,956
State:
$1,734
Percentage of individuals using paid preparers for their 2004 taxes: 61.8%
Here:
62%
State:
52%
(% for various income ranges: 52.5% for AGIs below $10k, 66.7% for AGIs $10k-25k, 59.1% for AGIs $25k-50k, 66.7% for AGIs $50k-75k, 65.5% for AGIs $75k-100k, 73.7% for AGIs over 100k)
Likely homosexual households (counted as self-reported same-sex unmarried-partner households)
Lesbian couples: 0.0% of all households
Gay men: 0.3% of all households
Household received Food Stamps/SNAP in the past 12 months: 130 Household did not receive Food Stamps/SNAP in the past 12 months: 555
Women who had a birth in the past 12 months: 32 (23 now married, 8 unmarried) Women who did not have a birth in the past 12 months: 313 (145 now married, 167 unmarried)
Housing units in zip code 23821 with a mortgage: 212 (5 second mortgage, 4 both second mortgage and home equity loan) Median monthly owner costs for units with a mortgage: $1,050 Median monthly owner costs for units without a mortgage: $338
Residents with income below the poverty level in 2022:
This zip code:
16.3%
Whole state:
10.6%
Residents with income below 50% of the poverty level in 2022:
This zip code:
11.5%
Whole state:
5.2%
Median number of rooms in houses and condos:
Here:
6.7
State:
7.0
Median number of rooms in apartments:
Here:
6.0
State:
4.3
Notable locations in this zip code not listed on our city pages
Notable locations in zip code 23821: Masons Mill (A), Alberta Volunteer Fire Department Company 1 (B), Alberta Police Department (C). Display/hide their locations on the map
Churches in zip code 23821 include: Rocky Run Church (A), Saint Marks Church (B), Saint Pauls Chapel (C), Taylors Chapel (D), White Rock Church (E), Mount Zion Church (F). Display/hide their locations on the map
Cemeteries: Stainback Cemetery (1), Stewart Cemetery (2), Bragg Cemetery (3), Trinity Cemetery (4), Winn Cemetery (5), Daniels Cemetery (6), Elmore Cemetery (7). Display/hide their locations on the map
In group quarters: 339 (-1 institutionalized population)
Size of family households: 175 2-persons, 68 3-persons, 31 4-persons, 107 5-persons, 30 6-persons
Size of nonfamily households: 238 1-person, 21 2-persons
218 married couples with children.
82 single-parent households (1 men, 81 women).
98.5% of residents of 23821 zip code speak English at home.
0.9% of residents speak Spanish at home (20% very well, 80% not well).
0.5% of residents speak other language at home (100% very well).
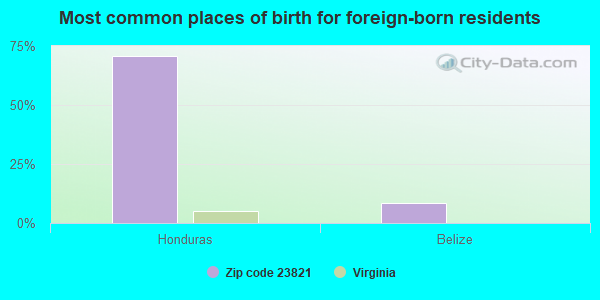
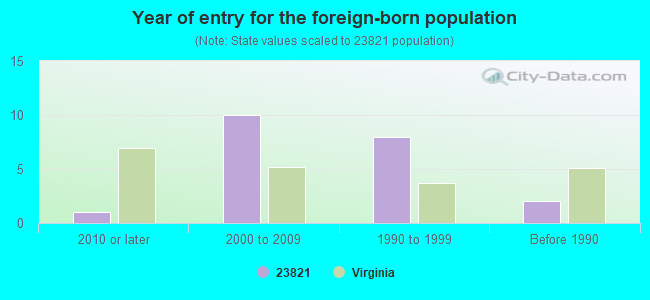
Foreign born population: 23 (1.2%) (13.7% of them are naturalized citizens)
This zip code:
1.2%
Whole state:
12.7%
71%Honduras
8%Belize
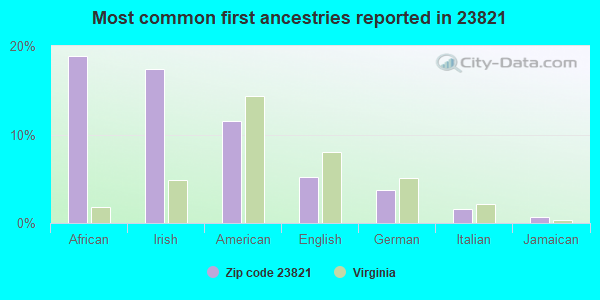
19%African
17%Irish
11%American
5%English
4%German
2%Italian
1%Jamaican
Year of entry for the foreign-born population
12010 or later
102000 to 2009
81990 to 1999
2Before 1990
Facilities with environmental interests located in this zip code:
ALBERTA WASTEWATER TREATMENT P (PO BOX 157 in ALBERTA, VA) . Federal Facility
National Pollutant Discharge Elimination System NON-MAJOR (Tracking pollutant discharge elimination systems) - permit Business SIC classification: SEWERAGE SYSTEMS Alternative names: ALBERTA,TOWN OF
Housing units lacking complete plumbing facilities: 9.3% Housing units lacking complete kitchen facilities: 7.2%
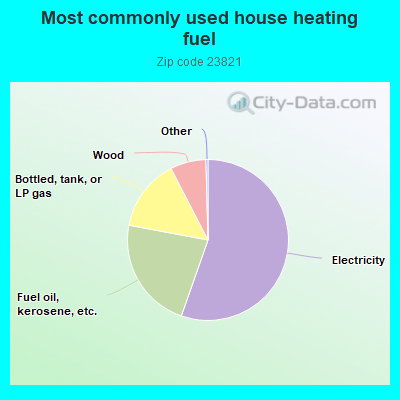
55.5%Electricity
22.6%Fuel oil, kerosene, etc.
14.5%Bottled, tank, or LP gas
7.2%Wood
Population in 1990: 1,553. Population change in the 1990s: +27 (+1.7%).
Place of birth for U.S.-born residents:
This state: 1,629
Northeast: 121
Midwest: 11
South: 140
West: 1
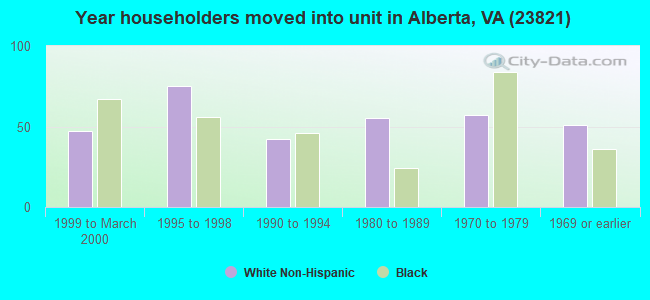
65% of the 23821 zip code residents lived in the same house 5 years ago. Out of people who lived in different houses, 60% lived in this county. Out of people who lived in different counties, 50% lived in Virginia.
91% of the 23821 zip code residents lived in the same house 1 year ago. Out of people who lived in different houses, 11% moved from this county. Out of people who lived in different houses, 81% moved from different county within same state. Out of people who lived in different houses, 11% moved from different state.
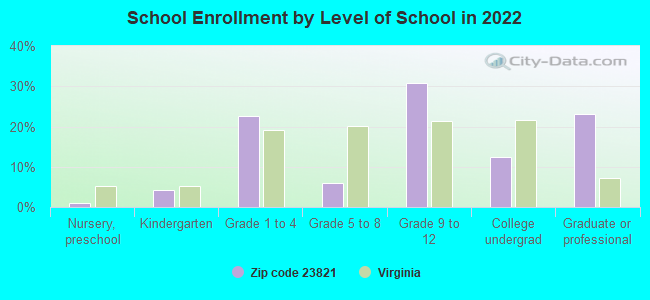
Private vs. public school enrollment:
Students in private schools in grades 1 to 8 (elementary and middle school):
Here:
0.0%
Virginia:
13.2%
Students in private schools in grades 9 to 12 (high school):
Here:
0.0%
Virginia:
10.2%
Students in private undergraduate colleges: 2
Here:
6.4%
Virginia:
18.7%
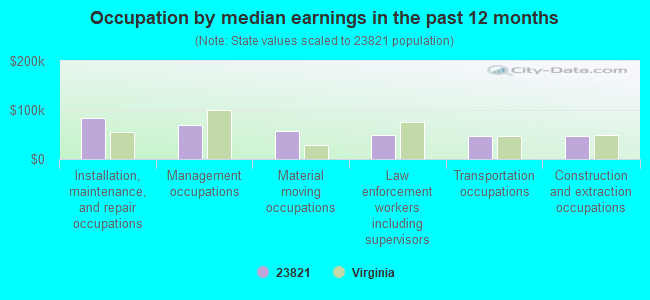
Occupation by median earnings in the past 12 months ($)
84,307Installation, maintenance, and repair occupations
70,238Management occupations
57,762Material moving occupations
48,244Law enforcement workers including supervisors
47,297Transportation occupations
46,656Construction and extraction occupations
Top industries in this zip code by the number of employees in 2005:
Arts, Entertainment, and Recreation: Other Gambling Industries (20-49 employees: 1 establishment)
Construction: Highway, Street, and Bridge Construction (10-19: 1, 1-4: 1)
Construction: Land Subdivision (10-19: 1)
Administrative and Support and Waste Management and Remediation Services: Janitorial Services (10-19: 1)
Accommodation and Food Services: Full-Service Restaurants (5-9: 1, 1-4: 2)
Other Services (except Public Administration): Automotive Body, Paint, and Interior Repair and Maintenance (5-9: 1)
Fatal accident statistics in 2014:
Fatal accident count: 2
Vehicles involved in fatal accidents: 3
Fatal accidents caused by drunken drivers: 0
Fatalities: 2
Persons involved in fatal accidents: 4
Pedestrians involved in fatal accidents: 0
Fatal accident statistics in 2013:
Fatal accident count: 3
Vehicles involved in fatal accidents: 4
Fatal accidents caused by drunken drivers: 1
Fatalities: 8
Persons involved in fatal accidents: 10
Pedestrians involved in fatal accidents: 0
2002 - 2017 National Fire Incident Reporting System (NFIRS) incidents
According to the data from the years 2002 - 2017 the average number of fires per year is 18. The highest number of reported fire incidents - 46 took place in 2007, and the least - 5 in 2015. The data has a decreasing trend.
When looking into fire subcategories, the most reports belonged to: Outside Fires (39.5%), and Structure Fires (30.3%).
Fire incident types reported to NFIRS in Zip Code 23821


 Nearest zip codes: 23938, 23843, 23876, 23889, 23920, 23868.


 . Federal Facility
 According to the data from the years 2002 - 2017 the average number of fires per year is 18. The highest number of reported fire incidents - 46 took place in 2007, and the least - 5 in 2015. The data has a decreasing trend.
 When looking into fire subcategories, the most reports belonged to: Outside Fires (39.5%), and Structure Fires (30.3%).