Estimated zip code population in 2022: 3,544 Zip code population in 2010: 4,677 Zip code population in 2000: 4,255
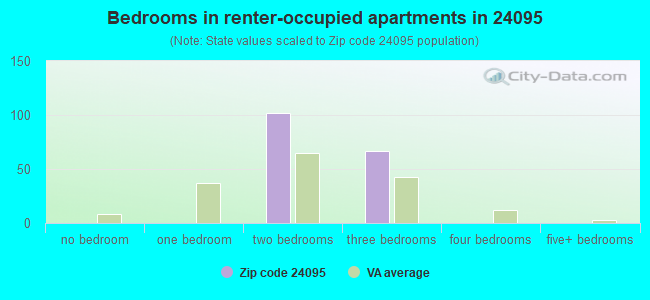
Houses and condos: 1,980 Renter-occupied apartments: 171
% of renters here:
10%
State:
33%
March 2022 cost of living index in zip code 24095: 84.5 (less than average, U.S. average is 100)
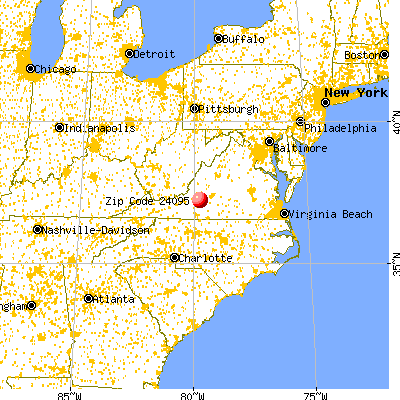
Land area: 25.2 sq. mi. Water area: 1.5 sq. mi.
Population density: 140 people per square mile
(very low).
OSM Map
General Map
Google Map
MSN Map
OSM Map
General Map
Google Map
MSN Map
OSM Map
General Map
Google Map
MSN Map
OSM Map
General Map
Google Map
MSN Map
Please wait while loading the map...
Real estate property taxes paid for housing units in 2022:
This zip code:
0.5% ($1,120)
Virginia:
0.7% ($2,617)
Median real estate property taxes paid for housing units with mortgages in 2022: $1,120 (0.5%) Median real estate property taxes paid for housing units with no mortgage in 2022: $1,145 (0.6%)
Business Search- 14 Million verified businesses
Males: 1,833
(51.7%)
Females: 1,711
(48.3%)
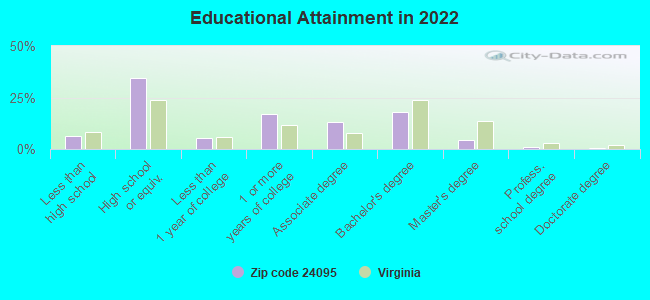
For population 25 years and over in 24095:
High school or higher: 92.5%
Bachelor's degree or higher: 23.5%
Graduate or professional degree: 5.9%
Unemployed: 2.0%
Mean travel time to work (commute): 36.1 minutes
For population 15 years and over in 24095:
Never married: 21.5%
Now married: 60.2%
Separated: 2.6%
Widowed: 4.5%
Divorced: 11.2%
Zip code 24095 compared to state average:
Median house value below state average.
Unemployed percentage below state average.
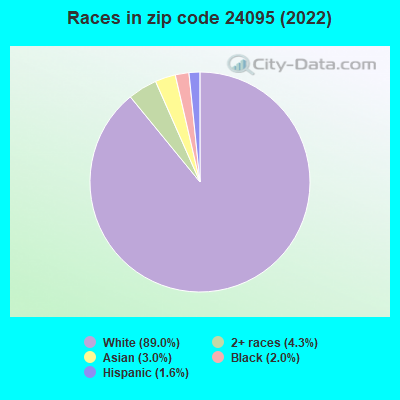
Black race population percentage significantly below state average.
Hispanic race population percentage significantly below state average.
Median age above state average.
Foreign-born population percentage significantly below state average.
Renting percentage significantly below state average.
Length of stay since moving in significantly above state average.
Percentage of population with a bachelor's degree or higher below state average.
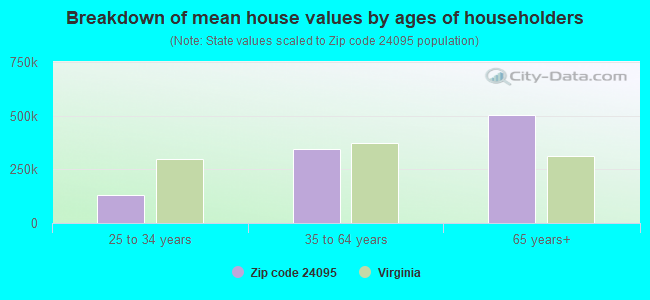
Estimated median house/condo value in 2022: $228,589
24095:
$228,589
Virginia:
$365,700
According to our research of Virginia and other state lists, there were 13 registered sex offenders living in 24095 zip code as of April 27, 2024. The ratio of all residents to sex offenders in zip code 24095 is 371 to 1. The ratio of registered sex offenders to all residents in this zip code is near the state average.
Median resident age:
This zip code:
47.0 years
Virginia median age:
39.0 years
Average household size:
This zip code:
2.1 people
Virginia:
2.5 people
Averages for the 2020 tax year for zip code 24095, filed in 2021:
Average Adjusted Gross Income (AGI) in 2020: $61,121 (Individual Income Tax Returns)
Here:
$61,121
State:
$86,446
Salary/wage: $52,249 (reported on 80.7% of returns)
Here:
$52,249
State:
$71,185
(% of AGI for various income ranges: 1055.0% for AGIs below $25k, 3412.8% for AGIs $25k-50k, 5969.2% for AGIs $50k-75k, 8984.4% for AGIs $75k-100k, 15847.6% for AGIs $100k-200k, 36030.0% for AGIs over 200k)
Taxable interest for individuals: $1,509 (reported on 28.2% of returns)
This zip code:
$1,509
Virginia:
$1,805
(% of AGI for various income ranges: 13.3% for AGIs below $25k, 18.2% for AGIs $25k-50k, 35.4% for AGIs $50k-75k, 90.0% for AGIs $75k-100k, 95.9% for AGIs $100k-200k, 1103.3% for AGIs over 200k)
Ordinary dividends: $4,422 (reported on 17.8% of returns)
Here:
$4,422
State:
$8,327
(% of AGI for various income ranges: 19.8% for AGIs below $25k, 24.0% for AGIs $25k-50k, 93.8% for AGIs $50k-75k, 149.4% for AGIs $75k-100k, 310.6% for AGIs $100k-200k, 1363.3% for AGIs over 200k)
Net capital gain/loss in AGI: +$10,334 (reported on 14.4% of returns)
Here:
+$10,334
State:
+$24,644
(% of AGI for various income ranges: 17.5% for AGIs $25k-50k, 65.0% for AGIs $50k-75k, 165.0% for AGIs $75k-100k, 521.8% for AGIs $100k-200k, 5456.7% for AGIs over 200k)
Profit/loss from business: +$8,575 (reported on 11.9% of returns)
Here:
+$8,575
State:
+$12,836
(% of AGI for various income ranges: 92.9% for AGIs below $25k, 59.8% for AGIs $25k-50k, 128.3% for AGIs $50k-75k, 184.4% for AGIs $75k-100k, 452.9% for AGIs $100k-200k)
Taxable individual retirement arrangement distribution: $16,504 (reported on 11.4% of returns)
24095:
$16,504
Virginia:
$21,535
(% of AGI for various income ranges: 78.1% for AGIs below $25k, 99.2% for AGIs $25k-50k, 235.4% for AGIs $50k-75k, 318.8% for AGIs $75k-100k, 1146.5% for AGIs $100k-200k)
Total itemized deductions: $29,433 (reported on 5.9% of returns)
Here:
$29,433
State:
$33,287
(% of AGI for various income ranges: 646.7% for AGIs $50k-75k, 643.5% for AGIs $100k-200k, 2953.3% for AGIs over 200k)
Charity contributions: $8,667 (reported on 4.5% of returns)
Here:
$8,667
State:
$10,381
(% of AGI for various income ranges: 76.2% for AGIs $50k-75k, 351.2% for AGIs $100k-200k)
Taxes paid: $6,367 (reported on 5.9% of returns)
24095:
$6,367
State:
$8,284
(% of AGI for various income ranges: 99.2% for AGIs $50k-75k, 181.2% for AGIs $100k-200k, 726.7% for AGIs over 200k)
Earned income credit: $2,141 (reported on 14.4% of returns)
Here:
$2,141
State:
$2,214
(% of AGI for various income ranges: 79.4% for AGIs below $25k, 60.0% for AGIs $25k-50k)
Percentage of individuals using paid preparers for their 2020 taxes: 94.6%
Here:
95%
State:
92%
(% for various income ranges: 92.1% for AGIs below $25k, 95.9% for AGIs $25k-50k, 93.8% for AGIs $50k-75k, 95.7% for AGIs $75k-100k, 96.6% for AGIs $100k-200k, 100.0% for AGIs over 200k)
Averages for the 2012 tax year for zip code 24095, filed in 2013:
Average Adjusted Gross Income (AGI) in 2012: $49,792 (Individual Income Tax Returns)
Here:
$49,792
State:
$71,192
Salary/wage: $42,844 (reported on 85.6% of returns)
Here:
$42,844
State:
$59,229
(% of AGI for various income ranges: 75.8% for AGIs below $25k, 77.1% for AGIs $25k-50k, 78.9% for AGIs $50k-75k, 79.4% for AGIs $75k-100k, 74.8% for AGIs $100k-200k, 47.1% for AGIs over 200k)
Taxable interest for individuals: $953 (reported on 31.8% of returns)
This zip code:
$953
Virginia:
$1,600
(% of AGI for various income ranges: 1.1% for AGIs below $25k, 0.8% for AGIs $25k-50k, 0.7% for AGIs $50k-75k, 0.3% for AGIs $75k-100k, 0.5% for AGIs $100k-200k, 0.3% for AGIs over 200k)
Ordinary dividends: $2,746 (reported on 17.4% of returns)
Here:
$2,746
State:
$6,959
(% of AGI for various income ranges: 1.3% for AGIs below $25k, 0.7% for AGIs $25k-50k, 0.7% for AGIs $50k-75k, 0.5% for AGIs $75k-100k, 2.1% for AGIs $100k-200k)
Net capital gain/loss in AGI: +$1,288 (reported on 8.0% of returns)
Here:
+$1,288
State:
+$16,672
(% of AGI for various income ranges: 0.3% for AGIs $75k-100k, 0.6% for AGIs $100k-200k)
Profit/loss from business: +$7,588 (reported on 11.9% of returns)
Here:
+$7,588
State:
+$14,116
(% of AGI for various income ranges: 4.6% for AGIs below $25k, 2.0% for AGIs $25k-50k, 1.1% for AGIs $50k-75k, 1.1% for AGIs $75k-100k, 2.7% for AGIs $100k-200k)
Taxable individual retirement arrangement distribution: $12,505 (reported on 10.9% of returns)
24095:
$12,505
Virginia:
$16,667
(% of AGI for various income ranges: 4.7% for AGIs below $25k, 2.7% for AGIs $25k-50k, 2.1% for AGIs $50k-75k, 2.3% for AGIs $75k-100k, 4.4% for AGIs $100k-200k)
Total itemized deductions: $19,161 (22% of AGI, reported on 30.8% of returns)
Here:
$19,161
State:
$26,596
Here:
21.6% of AGI
State:
20.1% of AGI
(% of AGI for various income ranges: 7.7% for AGIs below $25k, 10.1% for AGIs $25k-50k, 11.7% for AGIs $50k-75k, 13.9% for AGIs $75k-100k, 13.6% for AGIs $100k-200k, 11.9% for AGIs over 200k)
Charity contributions: $3,179 (reported on 23.9% of returns)
Here:
$3,179
State:
$4,443
(% of AGI for various income ranges: 0.6% for AGIs below $25k, 0.8% for AGIs $25k-50k, 1.1% for AGIs $50k-75k, 1.8% for AGIs $75k-100k, 2.1% for AGIs $100k-200k, 2.5% for AGIs over 200k)
Taxes paid: $5,634 (reported on 30.8% of returns)
24095:
$5,634
State:
$9,951
(% of AGI for various income ranges: 1.0% for AGIs below $25k, 1.8% for AGIs $25k-50k, 2.9% for AGIs $50k-75k, 3.8% for AGIs $75k-100k, 4.9% for AGIs $100k-200k, 5.8% for AGIs over 200k)
Earned income credit: $2,106 (reported on 17.9% of returns)
Here:
$2,106
State:
$2,211
(% of AGI for various income ranges: 5.9% for AGIs below $25k, 1.1% for AGIs $25k-50k)
Percentage of individuals using paid preparers for their 2012 taxes: 48.8%
Here:
49%
State:
46%
(% for various income ranges: 46.7% for AGIs below $25k, 50.0% for AGIs $25k-50k, 47.1% for AGIs $50k-75k, 52.4% for AGIs $75k-100k, 50.0% for AGIs $100k-200k, 66.7% for AGIs over 200k)
Averages for the 2004 tax year for zip code 24095, filed in 2005:
Average Adjusted Gross Income (AGI) in 2004: $41,739 (Individual Income Tax Returns)
Here:
$41,739
State:
$56,704
Salary/wage: $38,255 (reported on 86.8% of returns)
Here:
$38,255
State:
$48,441
(% of AGI for various income ranges: 103.1% for AGIs below $10k, 77.1% for AGIs $10k-25k, 79.8% for AGIs $25k-50k, 84.2% for AGIs $50k-75k, 86.6% for AGIs $75k-100k, 66.0% for AGIs over 100k)
Taxable interest for individuals: $1,021 (reported on 37.8% of returns)
This zip code:
$1,021
Virginia:
$1,688
(% of AGI for various income ranges: 6.5% for AGIs below $10k, 1.9% for AGIs $10k-25k, 1.1% for AGIs $25k-50k, 0.3% for AGIs $50k-75k, 0.5% for AGIs $75k-100k, 1.1% for AGIs over 100k)
Taxable dividends: $1,624 (reported on 19.3% of returns)
Here:
$1,624
State:
$4,028
(% of AGI for various income ranges: 3.3% for AGIs below $10k, 0.9% for AGIs $10k-25k, 0.5% for AGIs $25k-50k, 0.5% for AGIs $50k-75k, 0.6% for AGIs $75k-100k, 1.2% for AGIs over 100k)
Net capital gain/loss: +$3,629 (reported on 14.4% of returns)
Here:
+$3,629
State:
+$14,375
(% of AGI for various income ranges: -2.1% for AGIs below $10k, 0.2% for AGIs $10k-25k, 0.3% for AGIs $25k-50k, 0.8% for AGIs $50k-75k, 0.4% for AGIs $75k-100k, 4.5% for AGIs over 100k)
Profit/loss from business: +$8,059 (reported on 14.3% of returns)
Here:
+$8,059
State:
+$13,342
(% of AGI for various income ranges: 15.0% for AGIs below $10k, 5.2% for AGIs $10k-25k, 3.4% for AGIs $25k-50k, 2.6% for AGIs $50k-75k, 1.2% for AGIs $75k-100k, 1.4% for AGIs over 100k)
IRA payment deduction: $2,758 (reported on 1.7% of returns)
24095:
$2,758
Virginia:
$2,943
Total itemized deductions: $15,349 (22% of AGI, reported on 34.4% of returns)
Here:
$15,349
State:
$21,492
Here:
21.8% of AGI
State:
21.0% of AGI
(% of AGI for various income ranges: 10.8% for AGIs below $10k, 7.9% for AGIs $10k-25k, 11.6% for AGIs $25k-50k, 12.3% for AGIs $50k-75k, 17.1% for AGIs $75k-100k, 13.0% for AGIs over 100k)
Charity contributions deductions: $2,655 (4% of AGI, reported on 28.4% of returns)
Here:
$2,655
State:
$3,794
Here:
3.5% of AGI
State:
3.5% of AGI
(% of AGI for various income ranges: 0.5% for AGIs below $10k, 0.8% for AGIs $10k-25k, 1.1% for AGIs $25k-50k, 1.9% for AGIs $50k-75k, 2.1% for AGIs $75k-100k, 2.8% for AGIs over 100k)
Total tax: $5,153 (reported on 77.4% of returns)
24095:
$5,153
State:
$9,537
(% of AGI for various income ranges: 3.2% for AGIs below $10k, 4.0% for AGIs $10k-25k, 6.2% for AGIs $25k-50k, 8.3% for AGIs $50k-75k, 10.3% for AGIs $75k-100k, 17.6% for AGIs over 100k)
Earned income credit: $1,706 (reported on 15.1% of returns)
Here:
$1,706
State:
$1,734
Percentage of individuals using paid preparers for their 2004 taxes: 56.1%
Here:
56%
State:
52%
(% for various income ranges: 48.4% for AGIs below $10k, 58.3% for AGIs $10k-25k, 57.0% for AGIs $25k-50k, 58.1% for AGIs $50k-75k, 54.1% for AGIs $75k-100k, 63.4% for AGIs over 100k)
Notable locations in zip code 24095: Chandler Boat Marina (A), Moorman Marina (B), Chamblissburg Rescue Squad Number 4 (C). Display/hide their locations on the map
Churches in zip code 24095 include: Barnhardt Church (A), Goodview Church (B), Green Spring Church (C), Diamond Hill Church (D), Parris Chapel (E). Display/hide their locations on the map
Streams, rivers, and creeks: Kates Creek (A), Jumping Run (B), Nat Branch (C), Falling Creek (D), Curby Branch (E), Beaverdam Creek (F). Display/hide their locations on the map
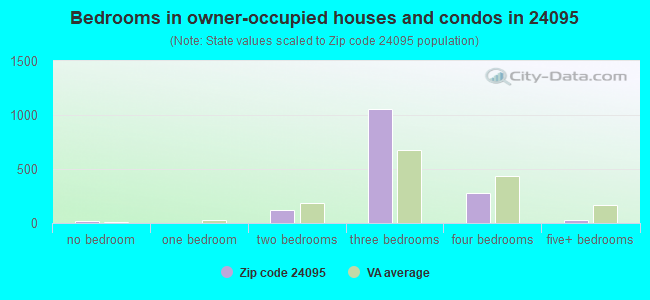
Size of family households: 695 2-persons, 152 3-persons, 171 4-persons, 131 5-persons
Size of nonfamily households: 452 1-person, 38 2-persons, 9 4-persons
400 married couples with children.
96 single-parent households (21 men, 75 women).
96.4% of residents of 24095 zip code speak English at home.
0.6% of residents speak Spanish at home (100% very well).
3.2% of residents speak other Indo-European language at home (32% very well, 68% well).
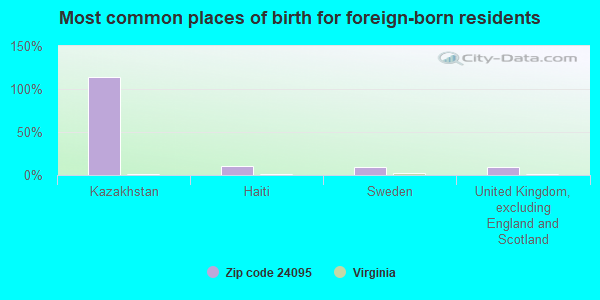
Foreign born population: 114 (3.2%) (100.0% of them are naturalized citizens)
This zip code:
3.2%
Whole state:
12.7%
114%Kazakhstan
10%Haiti
9%Sweden
9%United Kingdom, excluding England and Scotland
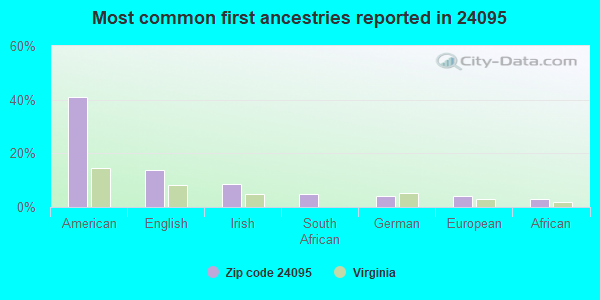
41%American
14%English
9%Irish
5%South African
4%German
4%European
3%African
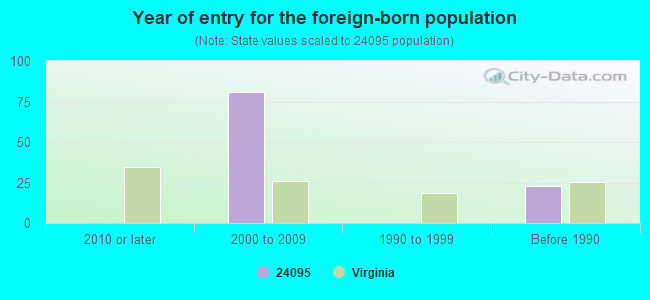
Year of entry for the foreign-born population
02010 or later
812000 to 2009
01990 to 1999
23Before 1990
Facilities with environmental interests located in this zip code:
BEDFORD COUNTY - STEWARTSVILLE ELEMENTARY SCHOOL (1138 WILDCAT RD in GOODVIEW, VA)
AIR MINOR (AIRS/AFS) STATE MASTER (Virginia pollutants databases) - CEDS-30214, AIR PROGRAM (National Center for Education Statistics) - STATE ID-0100640 National Pollutant Discharge Elimination System NON-MAJOR (Tracking pollutant discharge elimination systems) - permit Business SIC classification: SEWERAGE SYSTEMS; ELEMENTARY AND SECONDARY SCHOOLS Business NAICS classification: ELEMENTARY AND SECONDARY SCHOOLS. Organizations: BEDFORD COUNTY SCHOOLS - STEWA (CONTACT/OWNER)
, BEDFORD COUNTY PUBLIC SCHOOLS (SCHOOL DISTRICT)
Alternative names: BEDFORD CO.SCHOOL BOARD, BEDFORD COUNTY SCHOOLS - STEWA, STEWARTSVILLE ELEM. SCHOOL
Housing units lacking complete plumbing facilities: 0.5% Housing units lacking complete kitchen facilities: 0.6%
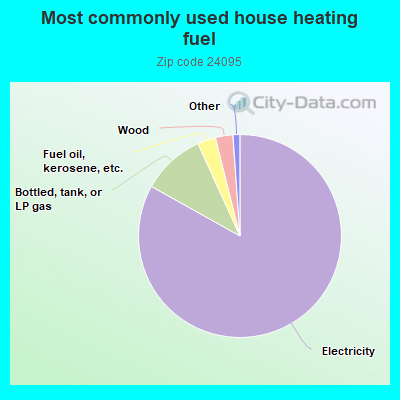
83.2%Electricity
10.1%Bottled, tank, or LP gas
2.9%Fuel oil, kerosene, etc.
2.8%Wood
0.6%Utility gas
0.6%Other fuel
Population in 1990: 1,686. Population change in the 1990s: +2,569 (+152.4%).
Place of birth for U.S.-born residents:
This state: 2,097
Northeast: 385
Midwest: 142
South: 703
West: 94
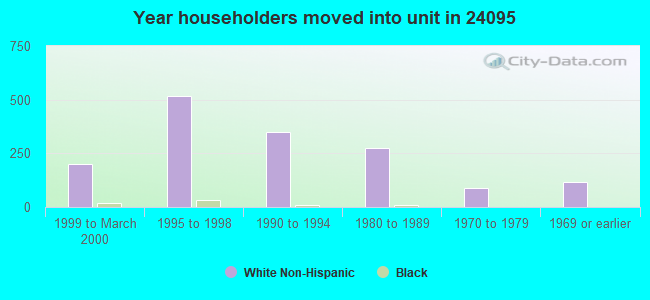
61% of the 24095 zip code residents lived in the same house 5 years ago. Out of people who lived in different houses, 23% lived in this county. Out of people who lived in different counties, 50% lived in Virginia.
94% of the 24095 zip code residents lived in the same house 1 year ago. Out of people who lived in different houses, 37% moved from this county. Out of people who lived in different houses, 33% moved from different county within same state. Out of people who lived in different houses, 29% moved from different state. Out of people who lived in different houses, 7% moved from abroad.
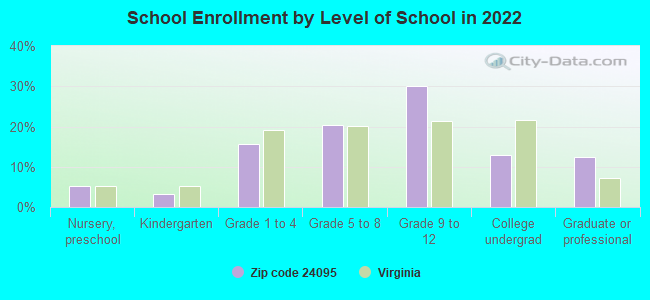
Private vs. public school enrollment:
Students in private schools in grades 1 to 8 (elementary and middle school): 27
Here:
12.0%
Virginia:
13.2%
Students in private schools in grades 9 to 12 (high school):
Here:
0.0%
Virginia:
10.2%
Students in private undergraduate colleges: 25
Here:
30.1%
Virginia:
18.7%
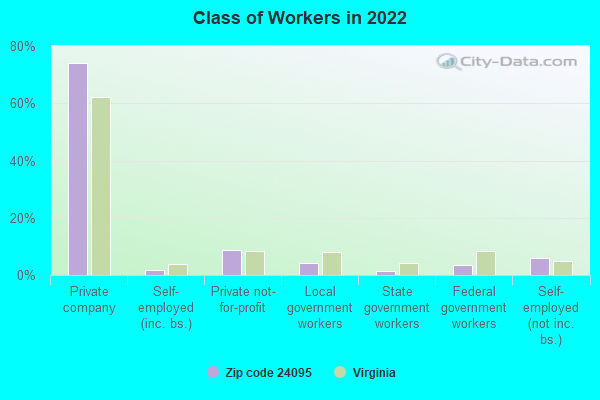
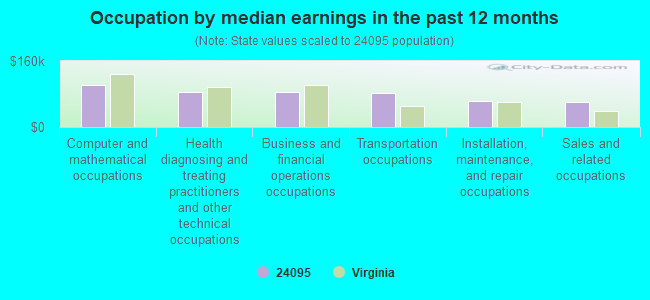
Occupation by median earnings in the past 12 months ($)
101,179Computer and mathematical occupations
85,588Health diagnosing and treating practitioners and other technical occupations
83,712Business and financial operations occupations
82,680Transportation occupations
62,972Installation, maintenance, and repair occupations
60,966Sales and related occupations
Companies with federal contracts located in this zip code:
RICHARDS LANDSCAPING INC (301 HEMLOCK SHORES DR in GOODVIEW, VA; small business) : $69,138 in 6 contractsfrom 2003 to 2006
Contracts for Maintenance, Repair or Alteration of Real Property -- Other Non-Building Facilities, Landscaping/Groundskeeping Services by Navy Signed by year:2000: $0; 2001: $0; 2002: $0; 2003: $12,332; 2004: $17,394; 2005: $20,447; 2006: $18,965.
Biggest contracts:
$18,965 with Navy for Maintenance, Repair or Alteration of Real Property -- Other Non-Building Facilities. Signed on 2006-03-01. Completion date: 2006-04-27.
$17,400, same as above.Signed on 2005-03-25. Completion date: 2005-03-27.
$17,394, same as above.Signed on 2004-03-22. Completion date: 2005-03-27.
$12,332 with Navy for Landscaping/Groundskeeping Services. Signed on 2003-03-28. Completion date: 2004-03-20.
Top industries in this zip code by the number of employees in 2005:
Construction: Industrial Building Construction (20-49 employees: 1 establishment)
Construction: Roofing Contractors (20-49: 1)
Construction: New Single-Family Housing Construction (except Operative Builders) (5-9: 1, 1-4: 6)
Administrative and Support and Waste Management and Remediation Services: Landscaping Services (5-9: 1, 1-4: 5)
Construction: Framing Contractors (10-19: 1)
Other Services (except Public Administration): Religious Organizations (5-9: 1, 1-4: 1)
Construction: Painting and Wall Covering Contractors (1-4: 4)
Construction: All Other Specialty Trade Contractors (5-9: 1)
Other Services (except Public Administration): Labor Unions and Similar Labor Organizations (5-9: 1)
Fatal accident statistics in 2013:
Fatal accident count: 1
Vehicles involved in fatal accidents: 1
Fatal accidents caused by drunken drivers: 0
Fatalities: 1
Persons involved in fatal accidents: 1
Pedestrians involved in fatal accidents: 0
Fatal accident statistics in 2012:
Fatal accident count: 2
Vehicles involved in fatal accidents: 3
Fatal accidents caused by drunken drivers: 1
Fatalities: 4
Persons involved in fatal accidents: 7
Pedestrians involved in fatal accidents: 0
Home Mortgage Disclosure Act Aggregated Statistics For Year 2009 (Based on 4 partial tracts)
A) FHA, FSA/RHS & VA Home Purchase Loans
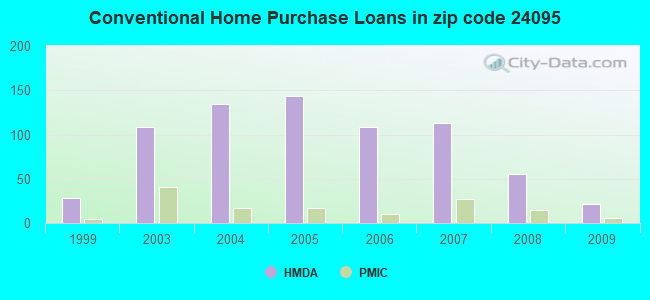
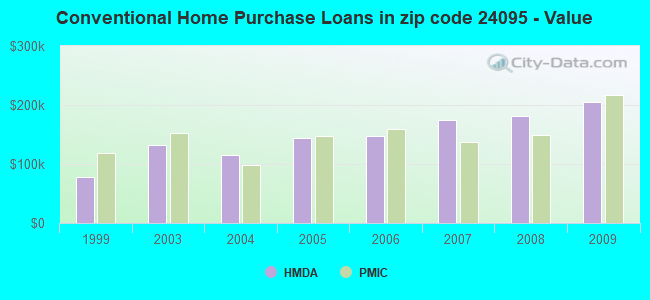
B) Conventional Home Purchase Loans
C) Refinancings
D) Home Improvement Loans
F) Non-occupant Loans on < 5 Family Dwellings (A B C & D)
G) Loans On Manufactured Home Dwelling (A B C & D)
Number
Average Value
Number
Average Value
Number
Average Value
Number
Average Value
Number
Average Value
Number
Average Value
LOANS ORIGINATED
28
$170,064
21
$205,690
229
$174,210
23
$48,886
19
$257,587
13
$82,224
APPLICATIONS APPROVED, NOT ACCEPTED
1
$60,420
1
$29,650
21
$185,992
0
$0
2
$241,850
2
$63,860
APPLICATIONS DENIED
4
$130,215
3
$164,693
75
$164,445
10
$123,696
6
$186,148
7
$88,049
APPLICATIONS WITHDRAWN
2
$53,980
2
$257,080
33
$162,937
1
$58,180
2
$112,170
1
$60,970
FILES CLOSED FOR INCOMPLETENESS
3
$154,460
2
$233,330
5
$161,722
0
$0
0
$0
2
$151,475
Aggregated Statistics For Year 2008 (Based on 4 partial tracts)
A) FHA, FSA/RHS & VA Home Purchase Loans
B) Conventional Home Purchase Loans
C) Refinancings
D) Home Improvement Loans
F) Non-occupant Loans on < 5 Family Dwellings (A B C & D)
G) Loans On Manufactured Home Dwelling (A B C & D)
Number
Average Value
Number
Average Value
Number
Average Value
Number
Average Value
Number
Average Value
Number
Average Value
LOANS ORIGINATED
17
$168,092
55
$180,713
168
$163,934
23
$77,020
26
$218,824
17
$93,938
APPLICATIONS APPROVED, NOT ACCEPTED
1
$71,600
7
$139,640
32
$127,290
1
$100,130
7
$205,309
2
$42,570
APPLICATIONS DENIED
2
$198,360
2
$149,300
105
$181,522
28
$62,529
6
$6,258
19
$89,568
APPLICATIONS WITHDRAWN
3
$144,637
1
$155,510
36
$164,904
5
$118,422
2
$315,200
0
$0
FILES CLOSED FOR INCOMPLETENESS
0
$0
0
$0
13
$148,534
1
$54,260
0
$0
0
$0
Aggregated Statistics For Year 2007 (Based on 4 partial tracts)
A) FHA, FSA/RHS & VA Home Purchase Loans
B) Conventional Home Purchase Loans
C) Refinancings
D) Home Improvement Loans
F) Non-occupant Loans on < 5 Family Dwellings (A B C & D)
G) Loans On Manufactured Home Dwelling (A B C & D)
Number
Average Value
Number
Average Value
Number
Average Value
Number
Average Value
Number
Average Value
Number
Average Value
LOANS ORIGINATED
21
$150,832
113
$174,292
191
$143,416
52
$68,750
27
$216,389
34
$82,959
APPLICATIONS APPROVED, NOT ACCEPTED
0
$0
7
$150,641
37
$130,280
15
$163,601
4
$194,610
2
$123,435
APPLICATIONS DENIED
5
$147,018
22
$103,257
111
$132,298
25
$77,950
2
$163,155
23
$77,243
APPLICATIONS WITHDRAWN
0
$0
11
$134,144
70
$140,085
14
$110,869
5
$77,852
9
$92,390
FILES CLOSED FOR INCOMPLETENESS
1
$44,750
3
$272,353
24
$147,458
0
$0
1
$67,130
2
$91,695
Aggregated Statistics For Year 2006 (Based on 4 partial tracts)
A) FHA, FSA/RHS & VA Home Purchase Loans
B) Conventional Home Purchase Loans
C) Refinancings
D) Home Improvement Loans
F) Non-occupant Loans on < 5 Family Dwellings (A B C & D)
G) Loans On Manufactured Home Dwelling (A B C & D)
Number
Average Value
Number
Average Value
Number
Average Value
Number
Average Value
Number
Average Value
Number
Average Value
LOANS ORIGINATED
24
$140,803
109
$147,506
235
$151,910
30
$57,451
34
$139,871
29
$90,120
APPLICATIONS APPROVED, NOT ACCEPTED
0
$0
14
$81,511
40
$122,449
4
$115,622
3
$203,967
12
$55,901
APPLICATIONS DENIED
3
$105,887
25
$82,729
144
$131,636
36
$53,984
6
$110,530
47
$76,451
APPLICATIONS WITHDRAWN
4
$67,192
12
$104,009
73
$149,050
9
$60,700
1
$131,460
6
$73,592
FILES CLOSED FOR INCOMPLETENESS
2
$93,330
4
$100,248
21
$230,088
2
$144,495
4
$453,248
2
$93,330
Aggregated Statistics For Year 2005 (Based on 4 partial tracts)
A) FHA, FSA/RHS & VA Home Purchase Loans
B) Conventional Home Purchase Loans
C) Refinancings
D) Home Improvement Loans
E) Loans on Dwellings For 5+ Families
F) Non-occupant Loans on < 5 Family Dwellings (A B C & D)
G) Loans On Manufactured Home Dwelling (A B C & D)
Number
Average Value
Number
Average Value
Number
Average Value
Number
Average Value
Number
Average Value
Number
Average Value
Number
Average Value
LOANS ORIGINATED
28
$106,558
144
$144,354
237
$137,679
28
$52,576
1
$111,880
33
$175,269
34
$85,339
APPLICATIONS APPROVED, NOT ACCEPTED
3
$74,840
14
$250,469
37
$138,164
3
$20,740
0
$0
2
$112,980
4
$102,728
APPLICATIONS DENIED
2
$74,500
30
$100,796
103
$127,343
43
$29,776
0
$0
5
$112,194
34
$64,917
APPLICATIONS WITHDRAWN
3
$142,453
9
$138,466
78
$130,186
9
$20,666
0
$0
2
$94,150
3
$56,217
FILES CLOSED FOR INCOMPLETENESS
5
$98,898
4
$95,855
19
$158,615
4
$91,080
0
$0
0
$0
2
$57,310
Aggregated Statistics For Year 2004 (Based on 4 partial tracts)
A) FHA, FSA/RHS & VA Home Purchase Loans
B) Conventional Home Purchase Loans
C) Refinancings
D) Home Improvement Loans
F) Non-occupant Loans on < 5 Family Dwellings (A B C & D)
G) Loans On Manufactured Home Dwelling (A B C & D)
Number
Average Value
Number
Average Value
Number
Average Value
Number
Average Value
Number
Average Value
Number
Average Value
LOANS ORIGINATED
36
$115,665
134
$114,590
223
$115,777
27
$66,151
24
$99,465
36
$86,194
APPLICATIONS APPROVED, NOT ACCEPTED
8
$142,975
20
$115,792
50
$109,403
4
$36,148
2
$35,205
17
$95,082
APPLICATIONS DENIED
5
$90,652
33
$85,011
134
$126,345
20
$22,651
4
$288,312
36
$79,973
APPLICATIONS WITHDRAWN
2
$157,290
11
$105,304
76
$117,771
7
$81,630
4
$67,682
7
$73,899
FILES CLOSED FOR INCOMPLETENESS
0
$0
3
$166,833
16
$134,666
0
$0
0
$0
2
$92,515
Aggregated Statistics For Year 2003 (Based on 4 partial tracts)
A) FHA, FSA/RHS & VA Home Purchase Loans
B) Conventional Home Purchase Loans
C) Refinancings
D) Home Improvement Loans
F) Non-occupant Loans on < 5 Family Dwellings (A B C & D)
Number
Average Value
Number
Average Value
Number
Average Value
Number
Average Value
Number
Average Value
LOANS ORIGINATED
41
$107,240
109
$131,589
414
$112,026
54
$69,020
40
$172,002
APPLICATIONS APPROVED, NOT ACCEPTED
0
$0
25
$115,053
59
$102,339
2
$16,155
1
$24,610
APPLICATIONS DENIED
6
$78,630
50
$81,696
133
$96,777
13
$21,497
10
$132,342
APPLICATIONS WITHDRAWN
1
$86,150
19
$170,986
95
$123,616
7
$70,876
9
$117,883
FILES CLOSED FOR INCOMPLETENESS
0
$0
4
$186,640
34
$137,575
0
$0
2
$140,000
Aggregated Statistics For Year 1999 (Based on 1 partial tract)
A) FHA, FSA/RHS & VA Home Purchase Loans
B) Conventional Home Purchase Loans
C) Refinancings
D) Home Improvement Loans
F) Non-occupant Loans on < 5 Family Dwellings (A B C & D)
Detailed PMIC statistics for the following Tracts:0306.01
, 0306.02
2002 - 2018 National Fire Incident Reporting System (NFIRS) incidents
Based on the data from the years 2002 - 2018 the average number of fire incidents per year is 18. The highest number of reported fire incidents - 37 took place in 2006, and the least - 2 in 2002. The data has a rising trend.
When looking into fire subcategories, the most incidents belonged to: Structure Fires (49.8%), and Outside Fires (39.7%).
Fire incident types reported to NFIRS in Zip Code 24095


 Nearest zip codes: 24101, 24179, 24121, 24184, 24174, 24064.


 Based on the data from the years 2002 - 2018 the average number of fire incidents per year is 18. The highest number of reported fire incidents - 37 took place in 2006, and the least - 2 in 2002. The data has a rising trend.
 When looking into fire subcategories, the most incidents belonged to: Structure Fires (49.8%), and Outside Fires (39.7%).