Estimated zip code population in 2022: 8,251 Zip code population in 2010: 8,250 Zip code population in 2000: 9,151
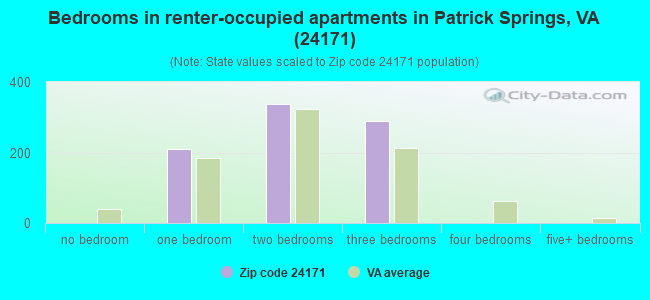
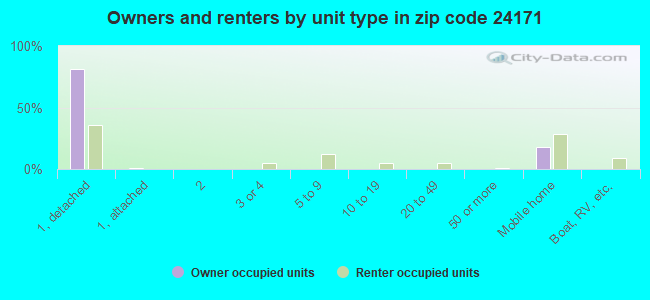
Houses and condos: 4,725 Renter-occupied apartments: 840
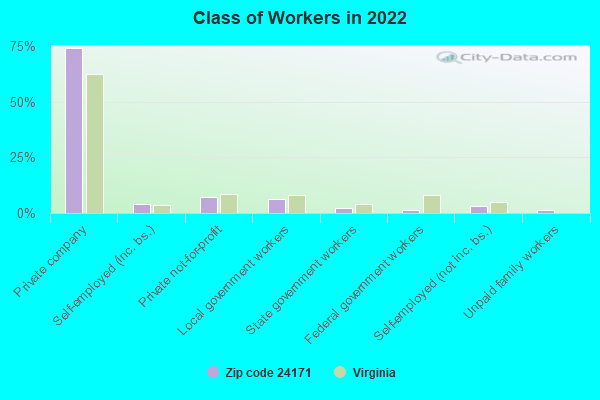
% of renters here:
22%
State:
33%
March 2022 cost of living index in zip code 24171: 82.8 (low, U.S. average is 100)
Land area: 199.7 sq. mi. Water area: 0.5 sq. mi.
Population density: 41 people per square mile
(very low).
OSM Map
General Map
Google Map
MSN Map
OSM Map
General Map
Google Map
MSN Map
OSM Map
General Map
Google Map
MSN Map
OSM Map
General Map
Google Map
MSN Map
Please wait while loading the map...
Real estate property taxes paid for housing units in 2022:
This zip code:
0.6% ($834)
Virginia:
0.7% ($2,617)
Median real estate property taxes paid for housing units with mortgages in 2022: $881 (0.6%) Median real estate property taxes paid for housing units with no mortgage in 2022: $793 (0.7%)
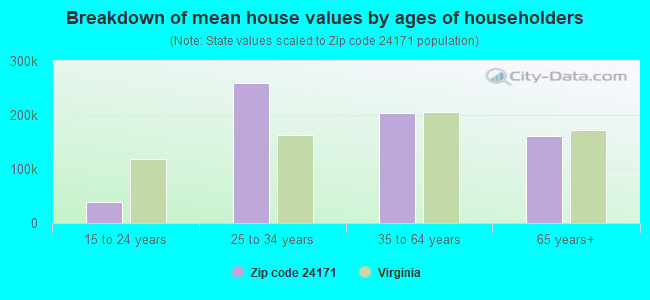
Estimated median house/condo value in 2022: $138,402
24171:
$138,402
Virginia:
$365,700
According to our research of Virginia and other state lists, there were 32 registered sex offenders living in 24171 zip code as of April 27, 2024. The ratio of all residents to sex offenders in zip code 24171 is 274 to 1. The ratio of registered sex offenders to all residents in this zip code is near the state average.
Median resident age:
This zip code:
52.7 years
Virginia median age:
39.0 years
Average household size:
This zip code:
2.1 people
Virginia:
2.5 people
Averages for the 2020 tax year for zip code 24171, filed in 2021:
Average Adjusted Gross Income (AGI) in 2020: $49,362 (Individual Income Tax Returns)
Here:
$49,362
State:
$86,446
Salary/wage: $40,768 (reported on 81.2% of returns)
Here:
$40,768
State:
$71,185
(% of AGI for various income ranges: 1190.2% for AGIs below $25k, 3436.0% for AGIs $25k-50k, 6084.1% for AGIs $50k-75k, 8679.1% for AGIs $75k-100k, 13846.7% for AGIs $100k-200k)
Taxable interest for individuals: $1,686 (reported on 29.0% of returns)
This zip code:
$1,686
Virginia:
$1,805
(% of AGI for various income ranges: 25.9% for AGIs below $25k, 33.5% for AGIs $25k-50k, 50.3% for AGIs $50k-75k, 126.8% for AGIs $75k-100k, 131.7% for AGIs $100k-200k)
Ordinary dividends: $6,095 (reported on 16.4% of returns)
Here:
$6,095
State:
$8,327
(% of AGI for various income ranges: 19.5% for AGIs below $25k, 35.8% for AGIs $25k-50k, 91.5% for AGIs $50k-75k, 211.4% for AGIs $75k-100k, 282.2% for AGIs $100k-200k)
Net capital gain/loss in AGI: +$8,668 (reported on 13.8% of returns)
Here:
+$8,668
State:
+$24,644
(% of AGI for various income ranges: 43.5% for AGIs $25k-50k, 94.4% for AGIs $50k-75k, 245.5% for AGIs $75k-100k, 711.7% for AGIs $100k-200k)
Profit/loss from business: +$9,232 (reported on 13.8% of returns)
Here:
+$9,232
State:
+$12,836
(% of AGI for various income ranges: 73.3% for AGIs below $25k, 122.9% for AGIs $25k-50k, 205.0% for AGIs $50k-75k, 313.6% for AGIs $75k-100k, 720.6% for AGIs $100k-200k)
Taxable individual retirement arrangement distribution: $12,531 (reported on 10.3% of returns)
24171:
$12,531
Virginia:
$21,535
(% of AGI for various income ranges: 58.3% for AGIs below $25k, 123.7% for AGIs $25k-50k, 182.1% for AGIs $50k-75k, 344.5% for AGIs $75k-100k, 827.8% for AGIs $100k-200k)
Total itemized deductions: $35,658 (reported on 3.5% of returns)
Here:
$35,658
State:
$33,287
(% of AGI for various income ranges: 135.9% for AGIs $25k-50k, 266.8% for AGIs $75k-100k, 531.7% for AGIs $100k-200k)
Charity contributions: $20,700 (reported on 2.6% of returns)
Here:
$20,700
State:
$10,381
(% of AGI for various income ranges: 31.5% for AGIs $25k-50k, 105.0% for AGIs $75k-100k, 171.1% for AGIs $100k-200k)
Taxes paid: $6,367 (reported on 3.5% of returns)
24171:
$6,367
State:
$8,284
(% of AGI for various income ranges: 15.6% for AGIs $25k-50k, 61.4% for AGIs $75k-100k, 129.4% for AGIs $100k-200k)
Earned income credit: $2,277 (reported on 19.1% of returns)
Here:
$2,277
State:
$2,214
(% of AGI for various income ranges: 100.4% for AGIs below $25k, 67.4% for AGIs $25k-50k)
Percentage of individuals using paid preparers for their 2020 taxes: 94.1%
Here:
94%
State:
92%
(% for various income ranges: 93.9% for AGIs below $25k, 94.9% for AGIs $25k-50k, 93.5% for AGIs $50k-75k, 93.5% for AGIs $75k-100k, 96.4% for AGIs $100k-200k, 83.3% for AGIs over 200k)
Averages for the 2012 tax year for zip code 24171, filed in 2013:
Average Adjusted Gross Income (AGI) in 2012: $40,950 (Individual Income Tax Returns)
Here:
$40,950
State:
$71,192
Salary/wage: $35,219 (reported on 82.5% of returns)
Here:
$35,219
State:
$59,229
(% of AGI for various income ranges: 74.8% for AGIs below $25k, 78.6% for AGIs $25k-50k, 73.8% for AGIs $50k-75k, 70.3% for AGIs $75k-100k, 73.5% for AGIs $100k-200k, 40.7% for AGIs over 200k)
Taxable interest for individuals: $1,263 (reported on 37.6% of returns)
This zip code:
$1,263
Virginia:
$1,600
(% of AGI for various income ranges: 1.9% for AGIs below $25k, 1.0% for AGIs $25k-50k, 1.0% for AGIs $50k-75k, 1.0% for AGIs $75k-100k, 0.9% for AGIs $100k-200k, 1.2% for AGIs over 200k)
Ordinary dividends: $3,074 (reported on 16.9% of returns)
Here:
$3,074
State:
$6,959
(% of AGI for various income ranges: 1.0% for AGIs below $25k, 0.9% for AGIs $25k-50k, 1.3% for AGIs $50k-75k, 1.0% for AGIs $75k-100k, 0.8% for AGIs $100k-200k, 3.4% for AGIs over 200k)
Net capital gain/loss in AGI: +$7,524 (reported on 11.8% of returns)
Here:
+$7,524
State:
+$16,672
(% of AGI for various income ranges: 0.5% for AGIs below $25k, 0.2% for AGIs $25k-50k, 1.2% for AGIs $50k-75k, 1.8% for AGIs $75k-100k, 3.2% for AGIs $100k-200k, 9.7% for AGIs over 200k)
Profit/loss from business: +$8,993 (reported on 14.6% of returns)
Here:
+$8,993
State:
+$14,116
(% of AGI for various income ranges: 5.3% for AGIs below $25k, 4.1% for AGIs $25k-50k, 2.4% for AGIs $50k-75k, 1.5% for AGIs $75k-100k, 5.0% for AGIs $100k-200k)
Taxable individual retirement arrangement distribution: $9,595 (reported on 11.8% of returns)
24171:
$9,595
Virginia:
$16,667
(% of AGI for various income ranges: 3.6% for AGIs below $25k, 2.7% for AGIs $25k-50k, 2.6% for AGIs $50k-75k, 3.2% for AGIs $75k-100k, 3.7% for AGIs $100k-200k)
Total itemized deductions: $19,229 (21% of AGI, reported on 18.8% of returns)
Here:
$19,229
State:
$26,596
Here:
21.5% of AGI
State:
20.1% of AGI
(% of AGI for various income ranges: 4.8% for AGIs below $25k, 5.9% for AGIs $25k-50k, 9.8% for AGIs $50k-75k, 9.9% for AGIs $75k-100k, 13.8% for AGIs $100k-200k, 10.0% for AGIs over 200k)
Charity contributions: $4,646 (reported on 15.3% of returns)
Here:
$4,646
State:
$4,443
(% of AGI for various income ranges: 0.5% for AGIs below $25k, 1.1% for AGIs $25k-50k, 1.6% for AGIs $50k-75k, 1.8% for AGIs $75k-100k, 3.8% for AGIs $100k-200k, 1.9% for AGIs over 200k)
Taxes paid: $5,590 (reported on 18.8% of returns)
24171:
$5,590
State:
$9,951
(% of AGI for various income ranges: 0.6% for AGIs below $25k, 1.1% for AGIs $25k-50k, 2.2% for AGIs $50k-75k, 2.9% for AGIs $75k-100k, 4.7% for AGIs $100k-200k, 5.7% for AGIs over 200k)
Earned income credit: $2,126 (reported on 23.6% of returns)
Here:
$2,126
State:
$2,211
(% of AGI for various income ranges: 6.3% for AGIs below $25k, 1.2% for AGIs $25k-50k)
Percentage of individuals using paid preparers for their 2012 taxes: 69.1%
Here:
69%
State:
46%
(% for various income ranges: 64.4% for AGIs below $25k, 70.7% for AGIs $25k-50k, 73.9% for AGIs $50k-75k, 77.3% for AGIs $75k-100k, 80.0% for AGIs $100k-200k, 66.7% for AGIs over 200k)
Averages for the 2004 tax year for zip code 24171, filed in 2005:
Average Adjusted Gross Income (AGI) in 2004: $33,365 (Individual Income Tax Returns)
Here:
$33,365
State:
$56,704
Salary/wage: $29,938 (reported on 83.9% of returns)
Here:
$29,938
State:
$48,441
(% of AGI for various income ranges: 106.6% for AGIs below $10k, 73.4% for AGIs $10k-25k, 81.2% for AGIs $25k-50k, 78.2% for AGIs $50k-75k, 72.0% for AGIs $75k-100k, 58.6% for AGIs over 100k)
Taxable interest for individuals: $1,483 (reported on 44.4% of returns)
This zip code:
$1,483
Virginia:
$1,688
(% of AGI for various income ranges: 8.2% for AGIs below $10k, 3.1% for AGIs $10k-25k, 1.3% for AGIs $25k-50k, 1.3% for AGIs $50k-75k, 1.7% for AGIs $75k-100k, 2.7% for AGIs over 100k)
Taxable dividends: $3,332 (reported on 18.4% of returns)
Here:
$3,332
State:
$4,028
(% of AGI for various income ranges: 3.7% for AGIs below $10k, 1.2% for AGIs $10k-25k, 0.9% for AGIs $25k-50k, 1.5% for AGIs $50k-75k, 2.2% for AGIs $75k-100k, 4.6% for AGIs over 100k)
Net capital gain/loss: +$8,434 (reported on 12.5% of returns)
Here:
+$8,434
State:
+$14,375
(% of AGI for various income ranges: -1.0% for AGIs below $10k, 1.1% for AGIs $10k-25k, 0.4% for AGIs $25k-50k, 1.0% for AGIs $50k-75k, 3.1% for AGIs $75k-100k, 15.1% for AGIs over 100k)
Profit/loss from business: +$7,635 (reported on 14.8% of returns)
Here:
+$7,635
State:
+$13,342
(% of AGI for various income ranges: -6.5% for AGIs below $10k, 5.0% for AGIs $10k-25k, 2.3% for AGIs $25k-50k, 4.3% for AGIs $50k-75k, 0.3% for AGIs $75k-100k, 6.0% for AGIs over 100k)
IRA payment deduction: $3,526 (reported on 2.4% of returns)
24171:
$3,526
Virginia:
$2,943
(% of AGI for various income ranges: 0.2% for AGIs $10k-25k, 0.3% for AGIs $25k-50k, 0.3% for AGIs $50k-75k, 0.6% for AGIs $75k-100k)
Total itemized deductions: $15,995 (24% of AGI, reported on 19.2% of returns)
Here:
$15,995
State:
$21,492
Here:
24.3% of AGI
State:
21.0% of AGI
(% of AGI for various income ranges: 6.4% for AGIs below $10k, 6.1% for AGIs $10k-25k, 7.2% for AGIs $25k-50k, 10.5% for AGIs $50k-75k, 12.4% for AGIs $75k-100k, 12.5% for AGIs over 100k)
Charity contributions deductions: $4,000 (6% of AGI, reported on 15.6% of returns)
Here:
$4,000
State:
$3,794
Here:
5.7% of AGI
State:
3.5% of AGI
(% of AGI for various income ranges: 0.7% for AGIs $10k-25k, 1.3% for AGIs $25k-50k, 2.2% for AGIs $50k-75k, 2.6% for AGIs $75k-100k, 3.4% for AGIs over 100k)
Total tax: $3,829 (reported on 73.4% of returns)
24171:
$3,829
State:
$9,537
(% of AGI for various income ranges: 3.3% for AGIs below $10k, 3.7% for AGIs $10k-25k, 6.2% for AGIs $25k-50k, 8.7% for AGIs $50k-75k, 10.1% for AGIs $75k-100k, 17.1% for AGIs over 100k)
Earned income credit: $1,625 (reported on 18.6% of returns)
Here:
$1,625
State:
$1,734
Percentage of individuals using paid preparers for their 2004 taxes: 76.0%
Here:
76%
State:
52%
(% for various income ranges: 72.2% for AGIs below $10k, 75.1% for AGIs $10k-25k, 77.2% for AGIs $25k-50k, 78.0% for AGIs $50k-75k, 81.1% for AGIs $75k-100k, 82.1% for AGIs over 100k)
Household received Food Stamps/SNAP in the past 12 months: 302 Household did not receive Food Stamps/SNAP in the past 12 months: 3,428
Women who had a birth in the past 12 months: 146 (129 now married, 19 unmarried) Women who did not have a birth in the past 12 months: 1,215 (486 now married, 729 unmarried)
Housing units in zip code 24171 with a mortgage: 1,330 (113 second mortgage, 94 both second mortgage and home equity loan) Median monthly owner costs for units with a mortgage: $1,050 Median monthly owner costs for units without a mortgage: $281
Residents with income below the poverty level in 2022:
This zip code:
9.6%
Whole state:
10.6%
Residents with income below 50% of the poverty level in 2022:
This zip code:
5.5%
Whole state:
5.2%
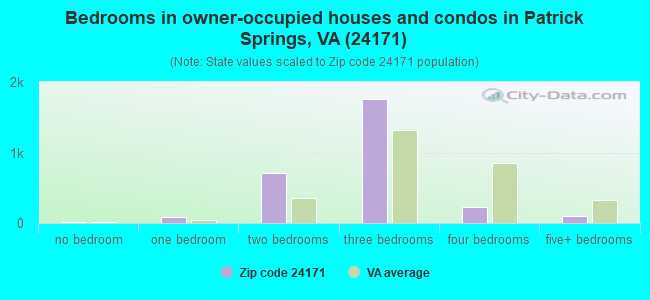
Median number of rooms in houses and condos:
Here:
5.6
State:
7.0
Median number of rooms in apartments:
Here:
4.2
State:
4.3
Notable locations in this zip code not listed on our city pages
Churches in zip code 24171 include: Big A Church (A), Ross-Harbour Church (B), Russell Creek Church (C), Black Jack Church (D), Bouldin Memorial Church (E), Buffalo Ridge Church (F), Smith River Church (G), Concord Church (H), Creaseys Chapel (I). Display/hide their locations on the map
Cemeteries: Wayside Cemetery (1), Turner Cemetery (2), Pleasant Grove Cemetery (3), Nettle Ridge Cemetery (4), Minnies Chapel Cemetery (5), High Point Cemetery (6), Goblintown Cemetery (7). Display/hide their locations on the map
Streams, rivers, and creeks: Witt Creek (A), Wilson Creek (B), Widgeon Creek (C), Townley Creek (D), Sycamore Creek (E), Spoon Creek (F), Noels Branch (G), Sandy Creek (H), Rye Cove Creek (I). Display/hide their locations on the map
In group quarters: 419 (-1 institutionalized population)
Size of family households: 1,409 2-persons, 425 3-persons, 142 4-persons, 47 5-persons, 92 6-persons, 35 7-or-more-persons
Size of nonfamily households: 1,289 1-person, 302 2-persons, 27 4-persons
562 married couples with children.
262 single-parent households (50 men, 212 women).
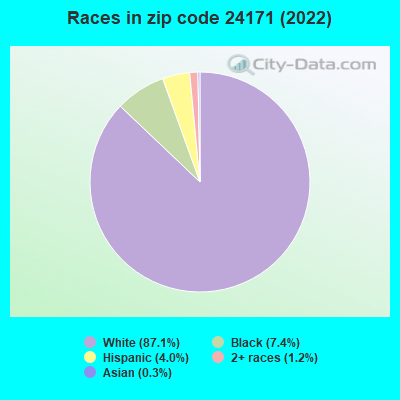
95.4% of residents of 24171 zip code speak English at home.
3.6% of residents speak Spanish at home (68% very well, 17% well, 15% not well).
1.0% of residents speak other Indo-European language at home (86% very well, 14% well).
0.2% of residents speak Asian or Pacific Island language at home (89% very well, 11% well).
0.2% of residents speak other language at home (100% very well).
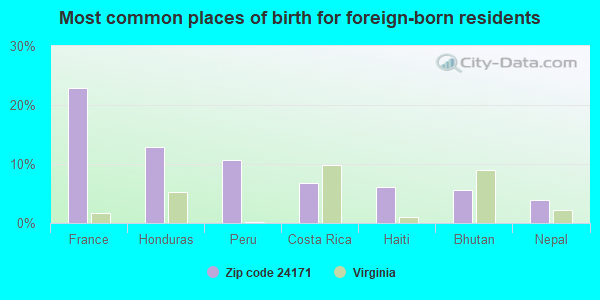
Foreign born population: 178 (2.2%) (51.3% of them are naturalized citizens)
This zip code:
2.2%
Whole state:
12.7%
23%France
13%Honduras
11%Peru
7%Costa Rica
6%Haiti
6%Bhutan
4%Nepal
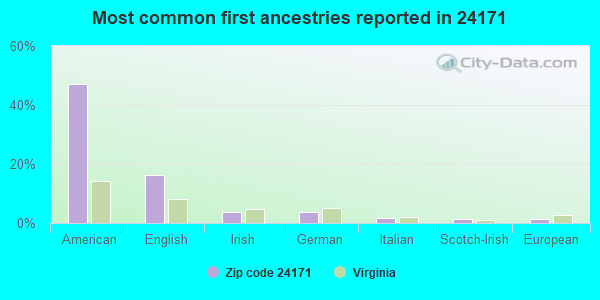
47%American
16%English
4%Irish
4%German
2%Italian
1%Scotch-Irish
1%European
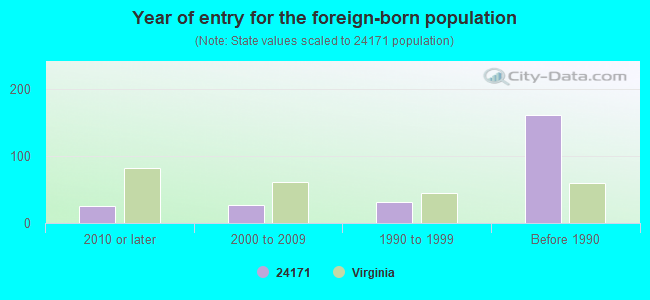
Year of entry for the foreign-born population
262010 or later
272000 to 2009
321990 to 1999
161Before 1990
Facilities with environmental interests located in this zip code:
ECO KNIT INC (COMMERCE ST in STUART, VA)
AIR MINOR (AIRS/AFS) STATE MASTER (Virginia pollutants databases) - CEDS-30047, AIR PROGRAM CRITERIA AND HAZARDOUS AIR POLLUTANT INVENTORY (Inventory of air pollution sources) Business SIC classification: KNIT OUTERWEAR MILLS Business NAICS classification: OUTERWEAR KNITTING MILLS.
DCR - FAIRY STONE STATE PARK (967 FAIRYSTONE LAKE DR in STUART, VA)
National Pollutant Discharge Elimination System NON-MAJOR (Tracking pollutant discharge elimination systems) - permit Conditionally Exempt Small Quantity Generators, less than 100 kg/month of hazardous waste (Resource Conservation and Recovery Act (tracking hazardous waste)) - notification Business SIC classification: WATER SUPPLY Organizations: VA COMMONWEALTH OF (CONTACT/OWNER)
Alternative names: FAIRY STONE ST PARK
Housing units lacking complete plumbing facilities: 9.1% Housing units lacking complete kitchen facilities: 5.6%
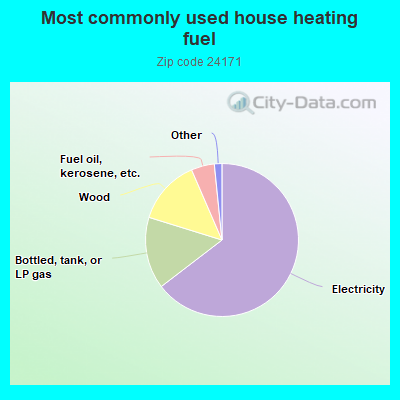
64.6%Electricity
15.2%Bottled, tank, or LP gas
13.7%Wood
4.9%Fuel oil, kerosene, etc.
0.9%Utility gas
0.6%No fuel used
Population in 1990: 7,990. Population change in the 1990s: +1,161 (+14.5%).
Place of birth for U.S.-born residents:
This state: 5,004
Northeast: 528
Midwest: 105
South: 2,059
West: 272
67% of the 24171 zip code residents lived in the same house 5 years ago. Out of people who lived in different houses, 53% lived in this county. Out of people who lived in different counties, 50% lived in Virginia.
93% of the 24171 zip code residents lived in the same house 1 year ago. Out of people who lived in different houses, 31% moved from this county. Out of people who lived in different houses, 36% moved from different county within same state. Out of people who lived in different houses, 37% moved from different state.
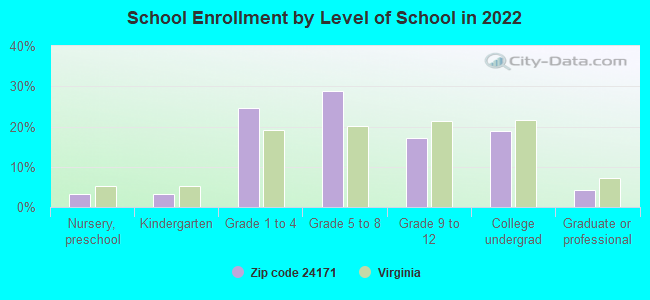
Private vs. public school enrollment:
Students in private schools in grades 1 to 8 (elementary and middle school): 88
Here:
14.8%
Virginia:
13.2%
Students in private schools in grades 9 to 12 (high school): 75
Here:
39.6%
Virginia:
10.2%
Students in private undergraduate colleges: 48
Here:
22.7%
Virginia:
18.7%
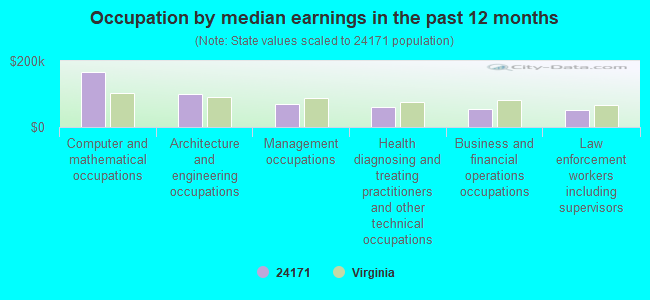
Occupation by median earnings in the past 12 months ($)
166,244Computer and mathematical occupations
99,943Architecture and engineering occupations
70,151Management occupations
60,094Health diagnosing and treating practitioners and other technical occupations
55,895Business and financial operations occupations
52,407Law enforcement workers including supervisors
Companies with federal contracts located in this zip code (STUART, VA):
CLARK BROTHERS COMPANY, INC (138 SOUTH MAIN STREET; small business) : $1,998,098 in 5 contractsfrom 2002 to 2003
Contracts for Maintenance, Repair or Alteration of Real Property -- Recreation Facilities (Non-Building) by U.S. Army Corps of Engineers - civil program financing only Signed by year:2000: $0; 2001: $0; 2002: $1,964,408; 2003: $33,690; 2004: $0; 2005: $0; 2006: $0.
Biggest contracts:
$800,000 with U.S. Army Corps of Engineers - civil program financing only for Maintenance, Repair or Alteration of Real Property -- Recreation Facilities (Non-Building). Signed on 2002-07-02. Completion date: 2002-03-26.
$700,000, same as above.Signed on 2002-02-20. Completion date: 2002-03-26.
$290,136, same as above.Signed on 2002-09-24. Completion date: 2002-03-26.
$174,272, same as above.Signed on 2002-11-13. Completion date: 2002-03-26.
BLUE RIDGE NURSING CENTER (105 LANDMARK DR; small business) 150 employees, $3200000 revenue. : $140,414 in 11 contractsfrom 2003 to 2006
Contracts for Nursing Home Care Contracts by Department of Veterans Affairs Signed by year:2000: $0; 2001: $0; 2002: $0; 2003: $57,668; 2004: $11,707; 2005: $61,701; 2006: $9,338.
Biggest contracts:
$34,234 with Department of Veterans Affairs for Nursing Home Care Contracts. Signed on 2003-10-01. Completion date: 2004-06-30.
$18,274, same as above.Signed on 2003-09-15. Completion date: 2004-04-15.
$17,952, same as above.Signed on 2005-01-01. Completion date: 2005-03-31.
$15,487, same as above.Signed on 2005-04-01. Completion date: 2005-06-30.
COUNTY OF PATRICK (106 RUCKER ST) : $58,460 in 5 contractsfrom 2004 to 2006
Contracts for Other Professional Services by Army, U.S. Army Corps of Engineers - civil program financing only Signed by year:2000: $0; 2001: $0; 2002: $0; 2003: $0; 2004: $22,400; 2005: $24,040; 2006: $12,020.
Biggest contracts:
$12,020 with Army for Other Professional Services. Signed on 2006-03-28. Completion date: 2007-03-30.
$12,020 with U.S. Army Corps of Engineers - civil program financing only for Other Professional Services. Signed on 2005-03-24. Completion date: 2005-04-08.
$12,020 with Army for Other Professional Services. Signed on 2005-03-24. Completion date: 2005-04-08.
$11,200, same as above.Signed on 2004-03-31. Completion date: 2004-04-16.
EASTERN MICROFILM SALES & SERV (636 COMMERCE ST; small business)
$5,756 with Defense Logistics Agency for Printing, Duplicating, and Bookbinding Equipment. Signed on 2005-09-27. Completion date: 2005-11-04.
Top industries in this zip code by the number of employees in 2005:
Health Care and Social Assistance: General Medical and Surgical Hospitals (100-249 employees: 2 establishments)
Health Care and Social Assistance: Nursing Care Facilities (100-249: 1, 20-49: 1)
Information: Data Processing, Hosting, and Related Services (50-99: 1)
Arts, Entertainment, and Recreation: Other Spectator Sports (50-99: 1)
Health Care and Social Assistance: Home Health Care Services (20-49: 2)
People in group quarters in 2010:
160 people in nursing facilities/skilled-nursing facilities
31 people in local jails and other municipal confinement facilities
People in group quarters in 2000:
143 people in nursing homes
63 people in other noninstitutional group quarters
22 people in local jails and other confinement facilities (including police lockups)
Fatal accident statistics in 2014:
Fatal accident count: 2
Vehicles involved in fatal accidents: 3
Fatal accidents caused by drunken drivers: 0
Fatalities: 2
Persons involved in fatal accidents: 4
Pedestrians involved in fatal accidents: 0
Fatal accident statistics in 2013:
Fatal accident count: 1
Vehicles involved in fatal accidents: 1
Fatal accidents caused by drunken drivers: 0
Fatalities: 1
Persons involved in fatal accidents: 1
Pedestrians involved in fatal accidents: 0
2002 - 2018 National Fire Incident Reporting System (NFIRS) incidents
According to the data from the years 2002 - 2018 the average number of fire incidents per year is 63. The highest number of reported fires - 117 took place in 2007, and the least - 20 in 2003. The data has an increasing trend.
When looking into fire subcategories, the most reports belonged to: Outside Fires (43.5%), and Structure Fires (41.1%).
Fire incident types reported to NFIRS in Zip Code 24171

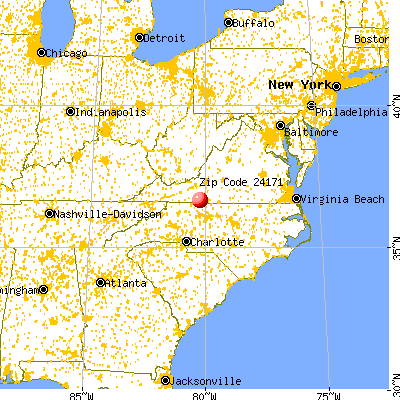


 Nearest zip codes: 24133, 24082, 24185, 27022, 24120, 24076.
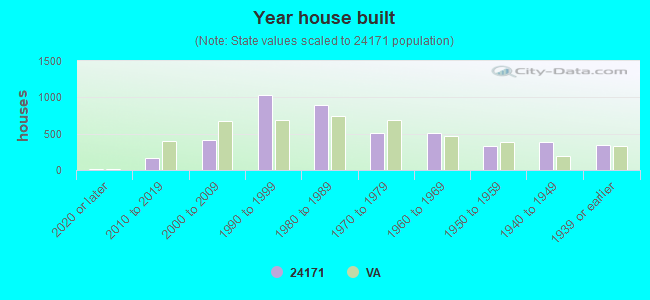


 According to the data from the years 2002 - 2018 the average number of fire incidents per year is 63. The highest number of reported fires - 117 took place in 2007, and the least - 20 in 2003. The data has an increasing trend.
 When looking into fire subcategories, the most reports belonged to: Outside Fires (43.5%), and Structure Fires (41.1%).