Estimated zip code population in 2022: 1,449 Zip code population in 2010: 2,222 Zip code population in 2000: 2,337
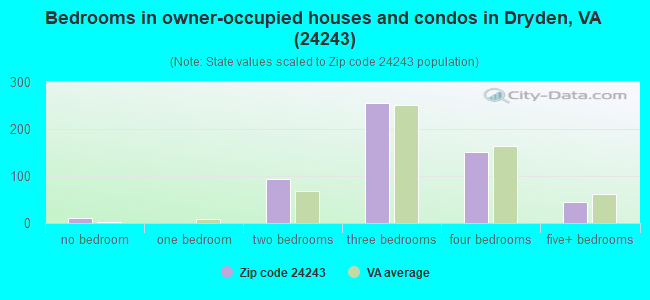
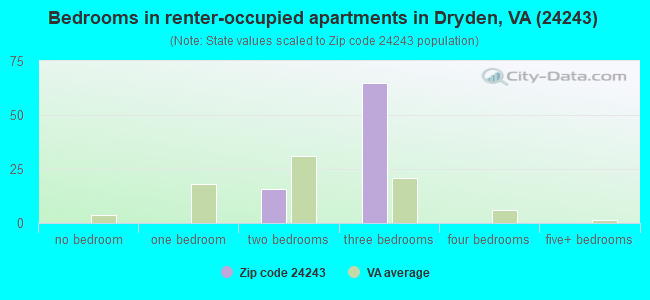
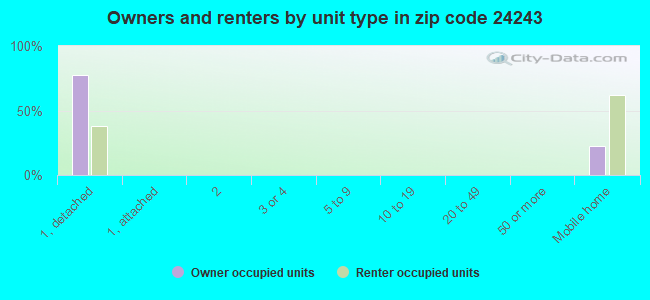
Houses and condos: 886 Renter-occupied apartments: 81
% of renters here:
13%
State:
33%
March 2022 cost of living index in zip code 24243: 83.6 (less than average, U.S. average is 100)
Land area: 22.4 sq. mi. Water area: 0.2 sq. mi.
Population density: 65 people per square mile
(very low).
OSM Map
General Map
Google Map
MSN Map
OSM Map
General Map
Google Map
MSN Map
OSM Map
General Map
Google Map
MSN Map
OSM Map
General Map
Google Map
MSN Map
Please wait while loading the map...
Real estate property taxes paid for housing units in 2022:
This zip code:
0.4% ($629)
Virginia:
0.7% ($2,617)
Median real estate property taxes paid for housing units with mortgages in 2022: $664 (0.5%) Median real estate property taxes paid for housing units with no mortgage in 2022: $614 (0.7%)
Business Search- 14 Million verified businesses
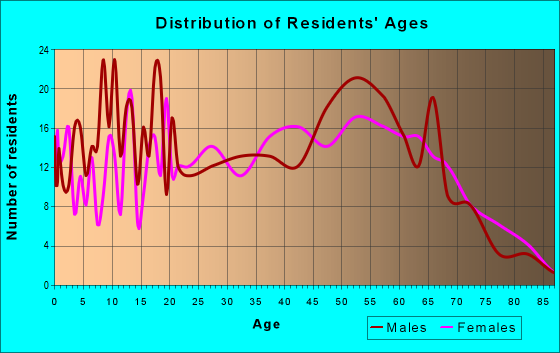
Males: 721
(49.7%)
Females: 728
(50.3%)
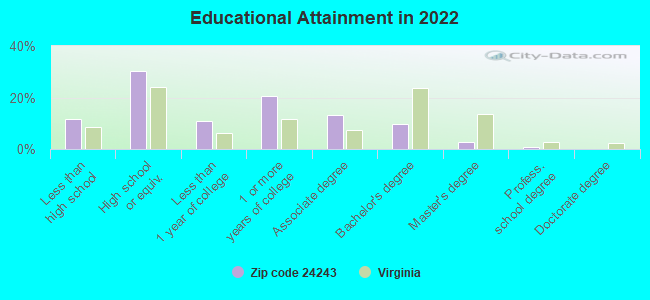
For population 25 years and over in 24243:
High school or higher: 86.2%
Bachelor's degree or higher: 12.9%
Graduate or professional degree: 3.4%
Unemployed: 2.8%
Mean travel time to work (commute): 28.1 minutes
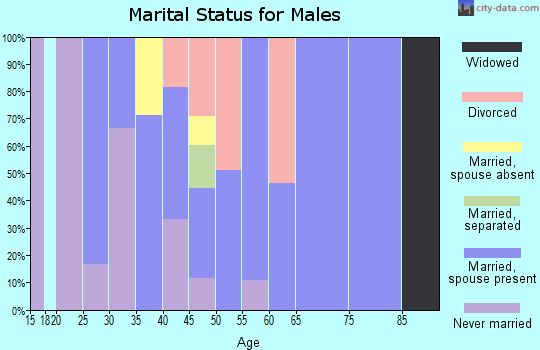
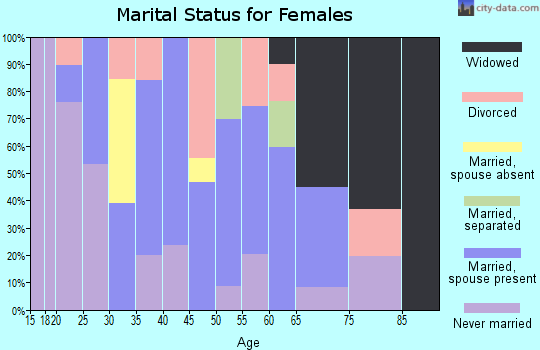
For population 15 years and over in 24243:
Never married: 20.1%
Now married: 52.6%
Separated: 1.8%
Widowed: 6.5%
Divorced: 19.0%
Zip code 24243 compared to state average:
Median household income below state average.
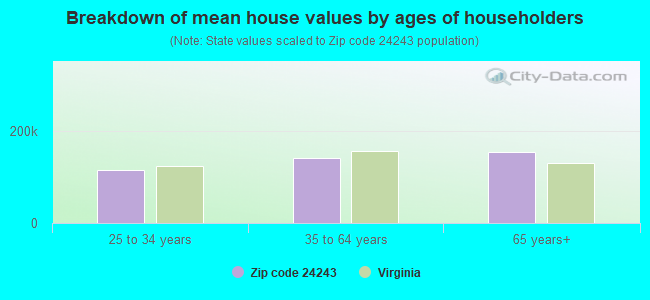
Median house value significantly below state average.
Black race population percentage significantly below state average.
Hispanic race population percentage significantly below state average.
Foreign-born population percentage significantly below state average.
Renting percentage significantly below state average.
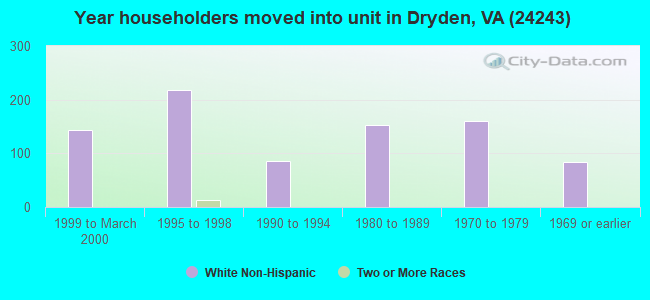
Length of stay since moving in above state average.
Percentage of population with a bachelor's degree or higher significantly below state average.
Estimated median house/condo value in 2022: $141,738
24243:
$141,738
Virginia:
$365,700
According to our research of Virginia and other state lists, there were 5 registered sex offenders living in 24243 zip code as of April 27, 2024. The ratio of all residents to sex offenders in zip code 24243 is 457 to 1. The ratio of registered sex offenders to all residents in this zip code is lower than the state average.
Median resident age:
This zip code:
41.1 years
Virginia median age:
39.0 years
Average household size:
This zip code:
2.3 people
Virginia:
2.5 people
Averages for the 2020 tax year for zip code 24243, filed in 2021:
Average Adjusted Gross Income (AGI) in 2020: $39,219 (Individual Income Tax Returns)
Here:
$39,219
State:
$86,446
Salary/wage: $35,035 (reported on 83.5% of returns)
Here:
$35,035
State:
$71,185
(% of AGI for various income ranges: 1165.9% for AGIs below $25k, 3351.1% for AGIs $25k-50k, 5922.2% for AGIs $50k-75k, 8500.0% for AGIs $75k-100k, 13426.7% for AGIs $100k-200k)
Taxable interest for individuals: $635 (reported on 29.1% of returns)
This zip code:
$635
Virginia:
$1,805
(% of AGI for various income ranges: 13.7% for AGIs below $25k, 20.5% for AGIs $25k-50k, 44.4% for AGIs $50k-75k, 22.0% for AGIs $75k-100k, 63.3% for AGIs $100k-200k)
Ordinary dividends: $1,375 (reported on 5.1% of returns)
Here:
$1,375
State:
$8,327
(% of AGI for various income ranges: 61.1% for AGIs $50k-75k)
Net capital gain/loss in AGI: +$1,733 (reported on 3.8% of returns)
Here:
+$1,733
State:
+$24,644
(% of AGI for various income ranges: 27.4% for AGIs $25k-50k)
Profit/loss from business: +$7,178 (reported on 11.4% of returns)
Here:
+$7,178
State:
+$12,836
(% of AGI for various income ranges: 72.2% for AGIs below $25k, 237.4% for AGIs $25k-50k)
Taxable individual retirement arrangement distribution: $12,240 (reported on 6.3% of returns)
24243:
$12,240
Virginia:
$21,535
(% of AGI for various income ranges: 74.1% for AGIs below $25k, 457.8% for AGIs $50k-75k)
Earned income credit: $2,433 (reported on 30.4% of returns)
Here:
$2,433
State:
$2,214
(% of AGI for various income ranges: 141.9% for AGIs below $25k, 105.8% for AGIs $25k-50k)
Percentage of individuals using paid preparers for their 2020 taxes: 98.7%
Here:
99%
State:
92%
(% for various income ranges: 97.1% for AGIs below $25k, 100.0% for AGIs $25k-50k, 100.0% for AGIs $50k-75k, 100.0% for AGIs $75k-100k, 100.0% for AGIs $100k-200k)
Averages for the 2012 tax year for zip code 24243, filed in 2013:
Average Adjusted Gross Income (AGI) in 2012: $37,358 (Individual Income Tax Returns)
Here:
$37,358
State:
$71,192
Salary/wage: $34,897 (reported on 85.0% of returns)
Here:
$34,897
State:
$59,229
(% of AGI for various income ranges: 75.9% for AGIs below $25k, 80.8% for AGIs $25k-50k, 84.4% for AGIs $50k-75k, 84.1% for AGIs $75k-100k, 69.6% for AGIs $100k-200k)
Taxable interest for individuals: $474 (reported on 28.7% of returns)
This zip code:
$474
Virginia:
$1,600
(% of AGI for various income ranges: 0.7% for AGIs below $25k, 0.5% for AGIs $25k-50k, 0.3% for AGIs $50k-75k, 0.3% for AGIs $75k-100k)
Ordinary dividends: $700 (reported on 6.2% of returns)
Here:
$700
State:
$6,959
Net capital gain/loss in AGI: +$325 (reported on 5.0% of returns)
Here:
+$325
State:
+$16,672
Profit/loss from business: +$5,382 (reported on 13.8% of returns)
Here:
+$5,382
State:
+$14,116
(% of AGI for various income ranges: 7.7% for AGIs below $25k, 1.4% for AGIs $25k-50k, 2.1% for AGIs $50k-75k)
Taxable individual retirement arrangement distribution: $7,825 (reported on 5.0% of returns)
24243:
$7,825
Virginia:
$16,667
Total itemized deductions: $17,280 (22% of AGI, reported on 12.5% of returns)
Here:
$17,280
State:
$26,596
Here:
22.1% of AGI
State:
20.1% of AGI
(% of AGI for various income ranges: 6.0% for AGIs $25k-50k, 10.2% for AGIs $50k-75k, 10.3% for AGIs $100k-200k)
Charity contributions: $3,750 (reported on 7.5% of returns)
Here:
$3,750
State:
$4,443
Taxes paid: $4,830 (reported on 12.5% of returns)
24243:
$4,830
State:
$9,951
(% of AGI for various income ranges: 1.0% for AGIs $25k-50k, 2.8% for AGIs $50k-75k, 3.9% for AGIs $100k-200k)
Earned income credit: $2,373 (reported on 27.5% of returns)
Here:
$2,373
State:
$2,211
(% of AGI for various income ranges: 9.2% for AGIs below $25k, 1.5% for AGIs $25k-50k)
Percentage of individuals using paid preparers for their 2012 taxes: 57.5%
Here:
57%
State:
46%
(% for various income ranges: 54.1% for AGIs below $25k, 55.0% for AGIs $25k-50k, 58.3% for AGIs $50k-75k, 71.4% for AGIs $75k-100k, 75.0% for AGIs $100k-200k)
Averages for the 2004 tax year for zip code 24243, filed in 2005:
Average Adjusted Gross Income (AGI) in 2004: $30,419 (Individual Income Tax Returns)
Here:
$30,419
State:
$56,704
Salary/wage: $29,842 (reported on 86.2% of returns)
Here:
$29,842
State:
$48,441
(% of AGI for various income ranges: 79.5% for AGIs below $10k, 79.6% for AGIs $10k-25k, 84.2% for AGIs $25k-50k, 89.0% for AGIs $50k-75k, 80.7% for AGIs $75k-100k, 89.7% for AGIs over 100k)
Taxable interest for individuals: $1,211 (reported on 32.3% of returns)
This zip code:
$1,211
Virginia:
$1,688
(% of AGI for various income ranges: 3.3% for AGIs below $10k, 3.1% for AGIs $10k-25k, 0.8% for AGIs $25k-50k, 0.7% for AGIs $50k-75k, 1.1% for AGIs $75k-100k, 0.4% for AGIs over 100k)
Taxable dividends: $309 (reported on 7.1% of returns)
Here:
$309
State:
$4,028
Net capital gain/loss: +$441 (reported on 4.4% of returns)
Here:
+$441
State:
+$14,375
Profit/loss from business: +$5,713 (reported on 13.0% of returns)
Here:
+$5,713
State:
+$13,342
(% of AGI for various income ranges: 10.8% for AGIs below $10k, 3.7% for AGIs $10k-25k, 3.4% for AGIs $25k-50k, 1.6% for AGIs $50k-75k)
Total itemized deductions: $14,284 (23% of AGI, reported on 10.4% of returns)
Here:
$14,284
State:
$21,492
Here:
23.1% of AGI
State:
21.0% of AGI
(% of AGI for various income ranges: 3.1% for AGIs $10k-25k, 4.2% for AGIs $25k-50k, 3.7% for AGIs $50k-75k, 12.3% for AGIs $75k-100k, 5.6% for AGIs over 100k)
Charity contributions deductions: $2,850 (5% of AGI, reported on 7.7% of returns)
Here:
$2,850
State:
$3,794
Here:
4.6% of AGI
State:
3.5% of AGI
Total tax: $3,756 (reported on 64.8% of returns)
24243:
$3,756
State:
$9,537
(% of AGI for various income ranges: 2.4% for AGIs below $10k, 2.8% for AGIs $10k-25k, 5.7% for AGIs $25k-50k, 8.4% for AGIs $50k-75k, 10.5% for AGIs $75k-100k, 18.5% for AGIs over 100k)
Earned income credit: $1,886 (reported on 28.3% of returns)
Here:
$1,886
State:
$1,734
Percentage of individuals using paid preparers for their 2004 taxes: 77.1%
Here:
77%
State:
52%
(% for various income ranges: 73.0% for AGIs below $10k, 79.2% for AGIs $10k-25k, 77.1% for AGIs $25k-50k, 75.5% for AGIs $50k-75k, 79.4% for AGIs $75k-100k, 90.0% for AGIs over 100k)
Household received Food Stamps/SNAP in the past 12 months: 162 Household did not receive Food Stamps/SNAP in the past 12 months: 488
Women who had a birth in the past 12 months: 34 (35 now married, 0 unmarried) Women who did not have a birth in the past 12 months: 269 (82 now married, 188 unmarried)
Housing units in zip code 24243 with a mortgage: 257 (35 second mortgage, 9 both second mortgage and home equity loan) Houses without a mortgage: 22
Median monthly owner costs for units with a mortgage: $922 Median monthly owner costs for units without a mortgage: $317
Residents with income below the poverty level in 2022:
This zip code:
14.7%
Whole state:
10.6%
Residents with income below 50% of the poverty level in 2022:
This zip code:
7.5%
Whole state:
5.2%
Median number of rooms in houses and condos:
Here:
6.8
State:
7.0
Median number of rooms in apartments:
Here:
4.8
State:
4.3
Notable locations in this zip code not listed on our city pages
Churches in zip code 24243 include: Calvary Church (A), Ely Memorial Church (B), Green Hill Church (C), Valley View Church (D). Display/hide their locations on the map
Size of family households: 251 2-persons, 120 3-persons, 48 4-persons, 13 5-persons, 14 7-or-more-persons
Size of nonfamily households: 168 1-person, 18 2-persons
65 married couples with children.
135 single-parent households (20 men, 115 women).
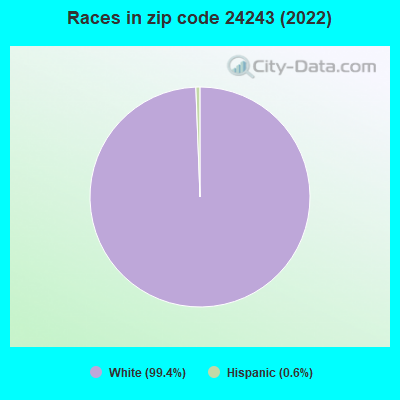
98.7% of residents of 24243 zip code speak English at home.
1.4% of residents speak Spanish at home (100% very well).
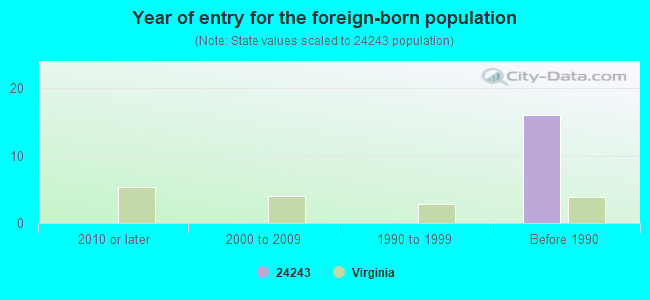
Foreign born population: 0 (0.0%)
:
0.0%
Whole state:
12.7%
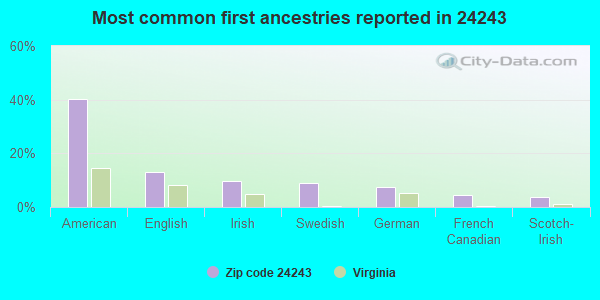
40%American
13%English
10%Irish
9%Swedish
7%German
4%French Canadian
4%Scotch-Irish
Year of entry for the foreign-born population
02010 or later
02000 to 2009
01990 to 1999
16Before 1990
Facilities with environmental interests located in this zip code:
C & P TELEPHONE OF VA-DRYDEN WC (RTE 750 in DRYDEN, VA)
Conditionally Exempt Small Quantity Generators, less than 100 kg/month of hazardous waste (Resource Conservation and Recovery Act (tracking hazardous waste)) - notification Organizations: THE C & P TELEPHONE CO OF VA (CONTACT/OWNER)
Housing units lacking complete plumbing facilities: 6.4% Housing units lacking complete kitchen facilities: 8.4%
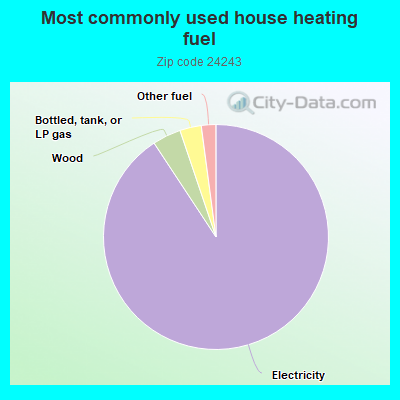
91.1%Electricity
4.1%Wood
3.1%Bottled, tank, or LP gas
2.1%Other fuel
Population in 1990: 2,185. Population change in the 1990s: +152 (+7.0%).
Place of birth for U.S.-born residents:
This state: 921
Northeast: 43
Midwest: 74
South: 284
West: 105
59% of the 24243 zip code residents lived in the same house 5 years ago. Out of people who lived in different houses, 65% lived in this county. Out of people who lived in different counties, 50% lived in Virginia.
93% of the 24243 zip code residents lived in the same house 1 year ago. Out of people who lived in different houses, 26% moved from this county. Out of people who lived in different houses, 65% moved from different county within same state. Out of people who lived in different houses, 12% moved from abroad.
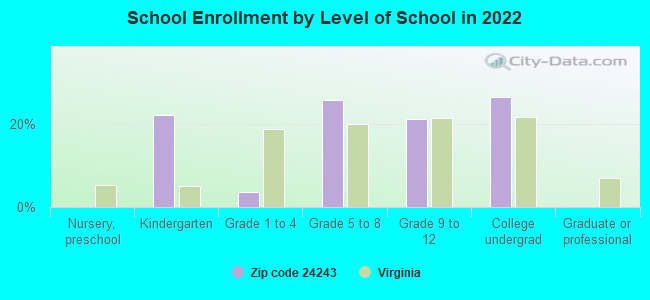
Private vs. public school enrollment:
Students in private schools in grades 1 to 8 (elementary and middle school):
Here:
0.0%
Virginia:
13.2%
Students in private schools in grades 9 to 12 (high school):
Here:
0.0%
Virginia:
10.2%
Students in private undergraduate colleges: 39
Here:
56.9%
Virginia:
18.7%
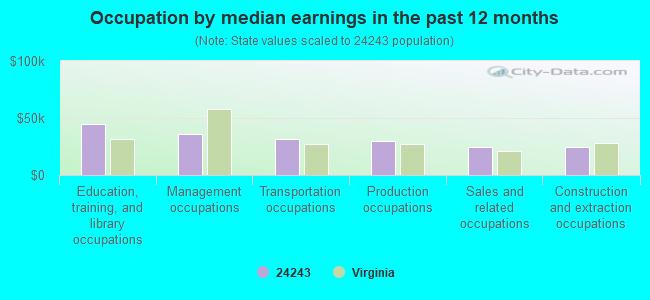
Occupation by median earnings in the past 12 months ($)
45,114Education, training, and library occupations
36,396Management occupations
31,553Transportation occupations
30,119Production occupations
24,463Sales and related occupations
24,359Construction and extraction occupations
Top industries in this zip code by the number of employees in 2005:
Mining: Crushed and Broken Limestone Mining and Quarrying (10-19: 1)
Construction: Drywall and Insulation Contractors (5-9: 1)
Other Services (except Public Administration): Religious Organizations (1-4: 3)
Other Services (except Public Administration): General Automotive Repair (1-4: 1)
Finance and Insurance: Commercial Banking (1-4: 1)
Mining: Bituminous Coal and Lignite Surface Mining (1-4: 1)
People in group quarters in 2010:
94 people in nursing facilities/skilled-nursing facilities
36 people in residential treatment centers for adults
People in group quarters in 2000:
76 people in homes for the mentally retarded
49 people in nursing homes
2002 - 2018 National Fire Incident Reporting System (NFIRS) incidents
Based on the data from the years 2002 - 2018 the average number of fires per year is 15. The highest number of fire incidents - 48 took place in 2005, and the least - 0 in 2010. The data has a rising trend.
When looking into fire subcategories, the most reports belonged to: Structure Fires (45.4%), and Outside Fires (39.7%).
Fire incident types reported to NFIRS in Zip Code 24243
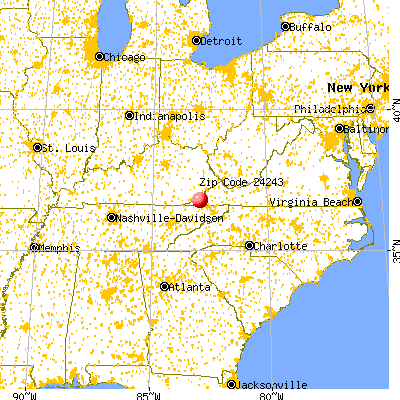


 Nearest zip codes: 24265, 24277, 40843, 24282, 24244, 24221.
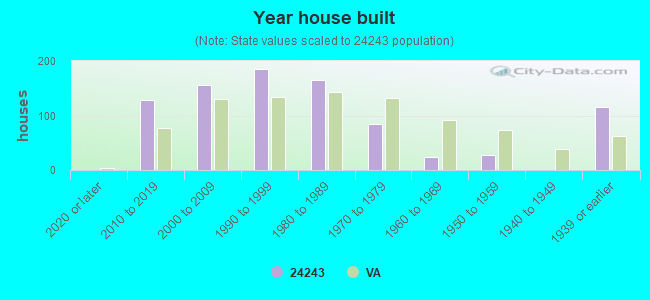


 Based on the data from the years 2002 - 2018 the average number of fires per year is 15. The highest number of fire incidents - 48 took place in 2005, and the least - 0 in 2010. The data has a rising trend.
 When looking into fire subcategories, the most reports belonged to: Structure Fires (45.4%), and Outside Fires (39.7%).