Estimated zip code population in 2022: 7,874 Zip code population in 2010: 8,773 Zip code population in 2000: 8,930
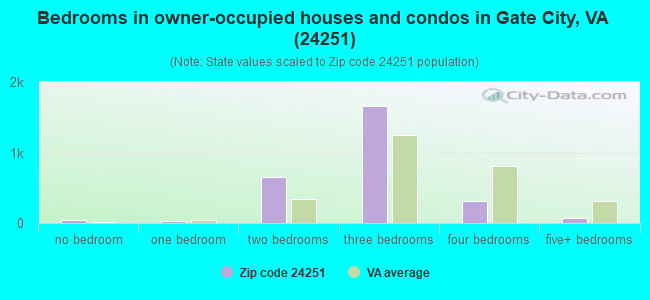
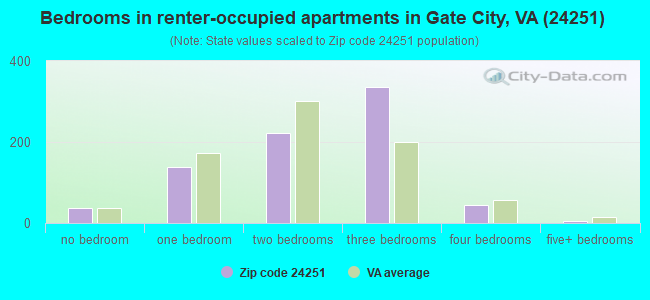
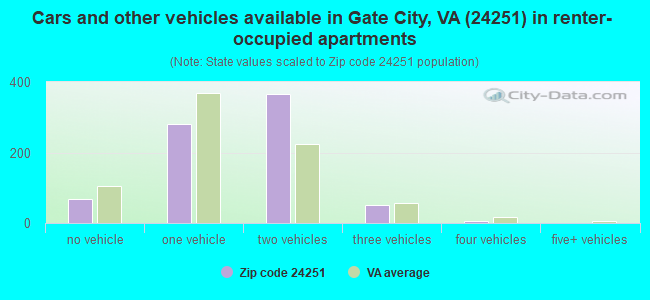
Houses and condos: 4,402 Renter-occupied apartments: 784
% of renters here:
22%
State:
33%
March 2022 cost of living index in zip code 24251: 83.2 (low, U.S. average is 100)
Land area: 118.5 sq. mi. Water area: 0.8 sq. mi.
Population density: 66 people per square mile
(very low).
OSM Map
General Map
Google Map
MSN Map
OSM Map
General Map
Google Map
MSN Map
OSM Map
General Map
Google Map
MSN Map
OSM Map
General Map
Google Map
MSN Map
Please wait while loading the map...
Real estate property taxes paid for housing units in 2022:
This zip code:
0.7% ($895)
Virginia:
0.7% ($2,617)
Median real estate property taxes paid for housing units with mortgages in 2022: $936 (0.7%) Median real estate property taxes paid for housing units with no mortgage in 2022: $885 (0.6%)
Business Search- 14 Million verified businesses
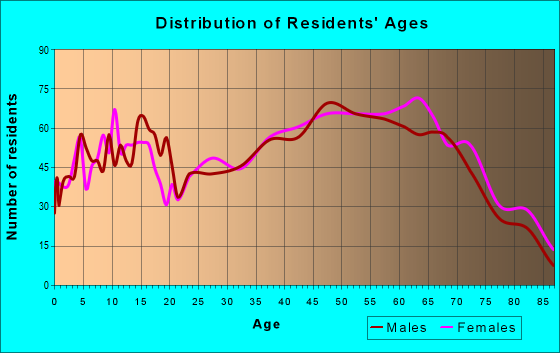
Males: 3,992
(50.7%)
Females: 3,882
(49.3%)
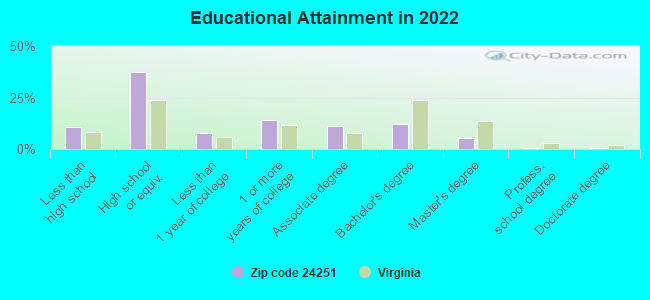
For population 25 years and over in 24251:
High school or higher: 87.5%
Bachelor's degree or higher: 18.1%
Graduate or professional degree: 6.3%
Unemployed: 1.7%
Mean travel time to work (commute): 25.2 minutes
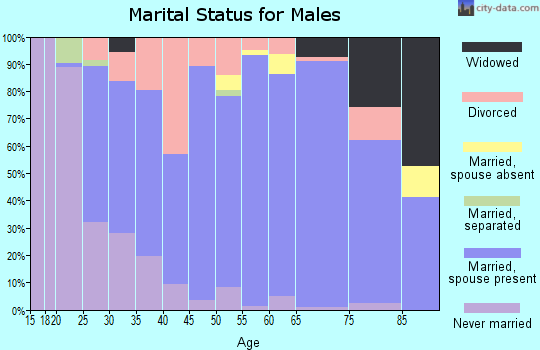
For population 15 years and over in 24251:
Never married: 25.6%
Now married: 53.1%
Separated: 2.4%
Widowed: 9.5%
Divorced: 9.4%
Zip code 24251 compared to state average:
Median household income below state average.
Median house value significantly below state average.
Unemployed percentage below state average.
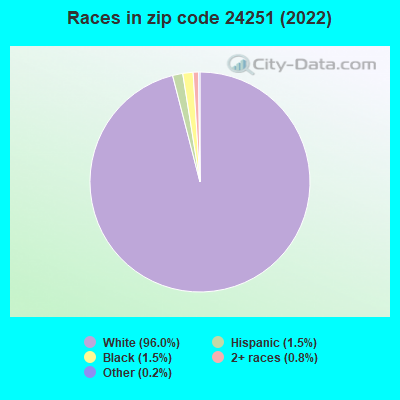
Black race population percentage significantly below state average.
Hispanic race population percentage significantly below state average.
Median age significantly above state average.
Foreign-born population percentage significantly below state average.
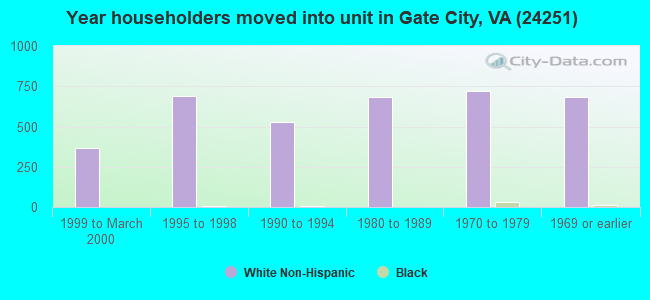
Length of stay since moving in significantly above state average.
Number of college students below state average.
Percentage of population with a bachelor's degree or higher below state average.
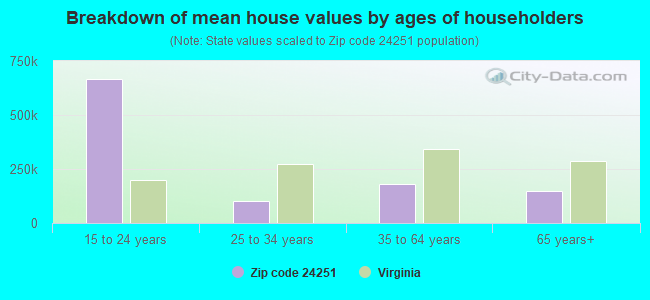
Estimated median house/condo value in 2022: $133,344
24251:
$133,344
Virginia:
$365,700
According to our research of Virginia and other state lists, there were 22 registered sex offenders living in 24251 zip code as of April 27, 2024. The ratio of all residents to sex offenders in zip code 24251 is 386 to 1. The ratio of registered sex offenders to all residents in this zip code is near the state average.
Median resident age:
This zip code:
48.9 years
Virginia median age:
39.0 years
Average household size:
This zip code:
2.2 people
Virginia:
2.5 people
Averages for the 2020 tax year for zip code 24251, filed in 2021:
Average Adjusted Gross Income (AGI) in 2020: $48,984 (Individual Income Tax Returns)
Here:
$48,984
State:
$86,446
Salary/wage: $45,314 (reported on 79.6% of returns)
Here:
$45,314
State:
$71,185
(% of AGI for various income ranges: 1048.0% for AGIs below $25k, 3385.0% for AGIs $25k-50k, 6222.0% for AGIs $50k-75k, 8916.0% for AGIs $75k-100k, 12757.4% for AGIs $100k-200k)
Taxable interest for individuals: $1,083 (reported on 50.9% of returns)
This zip code:
$1,083
Virginia:
$1,805
(% of AGI for various income ranges: 34.4% for AGIs below $25k, 39.5% for AGIs $25k-50k, 79.5% for AGIs $50k-75k, 110.8% for AGIs $75k-100k, 136.3% for AGIs $100k-200k)
Ordinary dividends: $5,085 (reported on 9.8% of returns)
Here:
$5,085
State:
$8,327
(% of AGI for various income ranges: 18.0% for AGIs below $25k, 15.8% for AGIs $25k-50k, 35.0% for AGIs $50k-75k, 42.4% for AGIs $75k-100k, 116.7% for AGIs $100k-200k)
Net capital gain/loss in AGI: +$7,645 (reported on 8.9% of returns)
Here:
+$7,645
State:
+$24,644
(% of AGI for various income ranges: 6.0% for AGIs below $25k, 19.6% for AGIs $25k-50k, 60.0% for AGIs $50k-75k, 122.8% for AGIs $75k-100k, 317.0% for AGIs $100k-200k)
Profit/loss from business: +$10,753 (reported on 10.9% of returns)
Here:
+$10,753
State:
+$12,836
(% of AGI for various income ranges: 80.8% for AGIs below $25k, 101.6% for AGIs $25k-50k, 144.5% for AGIs $50k-75k, 193.6% for AGIs $75k-100k, 542.2% for AGIs $100k-200k)
Taxable individual retirement arrangement distribution: $17,168 (reported on 11.8% of returns)
24251:
$17,168
Virginia:
$21,535
(% of AGI for various income ranges: 137.3% for AGIs below $25k, 174.1% for AGIs $25k-50k, 243.8% for AGIs $50k-75k, 377.2% for AGIs $75k-100k, 911.1% for AGIs $100k-200k)
Total itemized deductions: $33,314 (reported on 2.0% of returns)
Here:
$33,314
State:
$33,287
(% of AGI for various income ranges: 189.2% for AGIs $50k-75k, 583.3% for AGIs $100k-200k)
Charity contributions: $15,467 (reported on 1.7% of returns)
Here:
$15,467
State:
$10,381
(% of AGI for various income ranges: 55.5% for AGIs $50k-75k, 261.5% for AGIs $100k-200k)
Taxes paid: $6,225 (reported on 2.3% of returns)
24251:
$6,225
State:
$8,284
(% of AGI for various income ranges: 32.0% for AGIs $50k-75k, 137.0% for AGIs $100k-200k)
Earned income credit: $2,287 (reported on 18.1% of returns)
Here:
$2,287
State:
$2,214
(% of AGI for various income ranges: 89.8% for AGIs below $25k, 73.4% for AGIs $25k-50k)
Percentage of individuals using paid preparers for their 2020 taxes: 95.7%
Here:
96%
State:
92%
(% for various income ranges: 94.7% for AGIs below $25k, 96.7% for AGIs $25k-50k, 96.2% for AGIs $50k-75k, 96.9% for AGIs $75k-100k, 94.4% for AGIs $100k-200k, 100.0% for AGIs over 200k)
Averages for the 2012 tax year for zip code 24251, filed in 2013:
Average Adjusted Gross Income (AGI) in 2012: $41,977 (Individual Income Tax Returns)
Here:
$41,977
State:
$71,192
Salary/wage: $38,631 (reported on 83.0% of returns)
Here:
$38,631
State:
$59,229
(% of AGI for various income ranges: 67.8% for AGIs below $25k, 80.1% for AGIs $25k-50k, 80.2% for AGIs $50k-75k, 83.6% for AGIs $75k-100k, 78.7% for AGIs $100k-200k, 46.5% for AGIs over 200k)
Taxable interest for individuals: $962 (reported on 47.0% of returns)
This zip code:
$962
Virginia:
$1,600
(% of AGI for various income ranges: 1.8% for AGIs below $25k, 0.7% for AGIs $25k-50k, 0.6% for AGIs $50k-75k, 0.8% for AGIs $75k-100k, 1.0% for AGIs $100k-200k, 3.0% for AGIs over 200k)
Ordinary dividends: $3,266 (reported on 10.8% of returns)
Here:
$3,266
State:
$6,959
(% of AGI for various income ranges: 0.9% for AGIs below $25k, 0.5% for AGIs $25k-50k, 0.2% for AGIs $50k-75k, 0.2% for AGIs $75k-100k, 2.8% for AGIs $100k-200k)
Net capital gain/loss in AGI: +$3,689 (reported on 10.2% of returns)
Here:
+$3,689
State:
+$16,672
(% of AGI for various income ranges: 0.1% for AGIs below $25k, 0.1% for AGIs $25k-50k, 0.3% for AGIs $50k-75k, 0.2% for AGIs $75k-100k, 4.0% for AGIs $100k-200k)
Profit/loss from business: +$10,118 (reported on 12.5% of returns)
Here:
+$10,118
State:
+$14,116
(% of AGI for various income ranges: 5.9% for AGIs below $25k, 1.3% for AGIs $25k-50k, 1.8% for AGIs $50k-75k, 0.6% for AGIs $75k-100k, 7.7% for AGIs $100k-200k)
Taxable individual retirement arrangement distribution: $14,443 (reported on 10.5% of returns)
24251:
$14,443
Virginia:
$16,667
(% of AGI for various income ranges: 6.7% for AGIs below $25k, 3.3% for AGIs $25k-50k, 3.4% for AGIs $50k-75k, 3.1% for AGIs $75k-100k, 3.8% for AGIs $100k-200k)
Total itemized deductions: $19,051 (20% of AGI, reported on 15.6% of returns)
Here:
$19,051
State:
$26,596
Here:
19.9% of AGI
State:
20.1% of AGI
(% of AGI for various income ranges: 2.3% for AGIs below $25k, 3.8% for AGIs $25k-50k, 6.6% for AGIs $50k-75k, 8.5% for AGIs $75k-100k, 11.3% for AGIs $100k-200k, 11.8% for AGIs over 200k)
Charity contributions: $4,983 (reported on 11.6% of returns)
Here:
$4,983
State:
$4,443
(% of AGI for various income ranges: 0.6% for AGIs $25k-50k, 1.0% for AGIs $50k-75k, 2.0% for AGIs $75k-100k, 2.5% for AGIs $100k-200k, 2.8% for AGIs over 200k)
Taxes paid: $6,355 (reported on 15.6% of returns)
24251:
$6,355
State:
$9,951
(% of AGI for various income ranges: 0.3% for AGIs below $25k, 0.8% for AGIs $25k-50k, 1.5% for AGIs $50k-75k, 2.6% for AGIs $75k-100k, 4.3% for AGIs $100k-200k, 7.4% for AGIs over 200k)
Earned income credit: $2,232 (reported on 22.1% of returns)
Here:
$2,232
State:
$2,211
(% of AGI for various income ranges: 6.8% for AGIs below $25k, 1.3% for AGIs $25k-50k)
Percentage of individuals using paid preparers for their 2012 taxes: 53.8%
Here:
54%
State:
46%
(% for various income ranges: 49.4% for AGIs below $25k, 54.7% for AGIs $25k-50k, 58.0% for AGIs $50k-75k, 59.4% for AGIs $75k-100k, 63.6% for AGIs $100k-200k, 66.7% for AGIs over 200k)
Averages for the 2004 tax year for zip code 24251, filed in 2005:
Average Adjusted Gross Income (AGI) in 2004: $38,354 (Individual Income Tax Returns)
Here:
$38,354
State:
$56,704
Salary/wage: $32,959 (reported on 83.9% of returns)
Here:
$32,959
State:
$48,441
(% of AGI for various income ranges: 83.5% for AGIs below $10k, 70.1% for AGIs $10k-25k, 82.6% for AGIs $25k-50k, 84.0% for AGIs $50k-75k, 85.2% for AGIs $75k-100k, 39.3% for AGIs over 100k)
Taxable interest for individuals: $1,701 (reported on 50.6% of returns)
This zip code:
$1,701
Virginia:
$1,688
(% of AGI for various income ranges: 5.7% for AGIs below $10k, 3.0% for AGIs $10k-25k, 1.5% for AGIs $25k-50k, 1.3% for AGIs $50k-75k, 0.9% for AGIs $75k-100k, 4.0% for AGIs over 100k)
Taxable dividends: $3,235 (reported on 21.0% of returns)
Here:
$3,235
State:
$4,028
(% of AGI for various income ranges: 0.9% for AGIs below $10k, 1.0% for AGIs $10k-25k, 0.6% for AGIs $25k-50k, 0.6% for AGIs $50k-75k, 1.3% for AGIs $75k-100k, 5.2% for AGIs over 100k)
Net capital gain/loss: +$8,339 (reported on 9.4% of returns)
Here:
+$8,339
State:
+$14,375
(% of AGI for various income ranges: 0.0% for AGIs below $10k, 0.6% for AGIs $10k-25k, 0.5% for AGIs $25k-50k, 1.2% for AGIs $50k-75k, 0.8% for AGIs $75k-100k, 6.5% for AGIs over 100k)
Profit/loss from business: +$7,854 (reported on 14.1% of returns)
Here:
+$7,854
State:
+$13,342
(% of AGI for various income ranges: 7.8% for AGIs below $10k, 4.9% for AGIs $10k-25k, 2.1% for AGIs $25k-50k, 1.0% for AGIs $50k-75k, 1.9% for AGIs $75k-100k, 4.8% for AGIs over 100k)
IRA payment deduction: $2,750 (reported on 2.0% of returns)
24251:
$2,750
Virginia:
$2,943
(% of AGI for various income ranges: 0.1% for AGIs $10k-25k, 0.2% for AGIs $25k-50k, 0.2% for AGIs $50k-75k, 0.4% for AGIs $75k-100k)
Total itemized deductions: $18,810 (19% of AGI, reported on 15.2% of returns)
Here:
$18,810
State:
$21,492
Here:
19.2% of AGI
State:
21.0% of AGI
(% of AGI for various income ranges: 3.7% for AGIs $10k-25k, 4.8% for AGIs $25k-50k, 6.7% for AGIs $50k-75k, 11.7% for AGIs $75k-100k, 12.1% for AGIs over 100k)
Charity contributions deductions: $5,289 (5% of AGI, reported on 12.8% of returns)
Here:
$5,289
State:
$3,794
Here:
5.5% of AGI
State:
3.5% of AGI
(% of AGI for various income ranges: 0.5% for AGIs $10k-25k, 0.7% for AGIs $25k-50k, 1.5% for AGIs $50k-75k, 2.7% for AGIs $75k-100k, 3.8% for AGIs over 100k)
Total tax: $5,402 (reported on 74.5% of returns)
24251:
$5,402
State:
$9,537
(% of AGI for various income ranges: 2.5% for AGIs below $10k, 3.7% for AGIs $10k-25k, 6.3% for AGIs $25k-50k, 8.3% for AGIs $50k-75k, 10.3% for AGIs $75k-100k, 22.7% for AGIs over 100k)
Earned income credit: $1,630 (reported on 17.8% of returns)
Here:
$1,630
State:
$1,734
Percentage of individuals using paid preparers for their 2004 taxes: 55.6%
Here:
56%
State:
52%
(% for various income ranges: 48.7% for AGIs below $10k, 54.3% for AGIs $10k-25k, 55.3% for AGIs $25k-50k, 60.8% for AGIs $50k-75k, 68.0% for AGIs $75k-100k, 67.8% for AGIs over 100k)
Likely homosexual households (counted as self-reported same-sex unmarried-partner households)
Lesbian couples: 0.3% of all households
Gay men: 0.0% of all households
Household received Food Stamps/SNAP in the past 12 months: 674 Household did not receive Food Stamps/SNAP in the past 12 months: 2,925
Women who had a birth in the past 12 months: 202 (130 now married, 70 unmarried) Women who did not have a birth in the past 12 months: 1,222 (733 now married, 480 unmarried)
Housing units in zip code 24251 with a mortgage: 1,017 (37 second mortgage, 23 both second mortgage and home equity loan) Houses without a mortgage: 56
Median monthly owner costs for units with a mortgage: $1,041 Median monthly owner costs for units without a mortgage: $338
Residents with income below the poverty level in 2022:
This zip code:
14.5%
Whole state:
10.6%
Residents with income below 50% of the poverty level in 2022:
This zip code:
9.8%
Whole state:
5.2%
Median number of rooms in houses and condos:
Here:
6.2
State:
7.0
Median number of rooms in apartments:
Here:
5.0
State:
4.3
Notable locations in this zip code not listed on our city pages
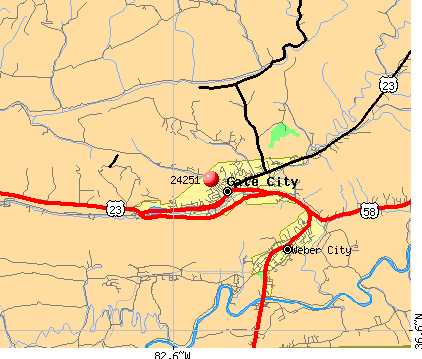
Notable locations in zip code 24251: Addington Store (A), Alley Valley (B), Moccasin Gap (C), Moccasin Siding (D), Big Cut Station (E), Danlboone Yard (F), Carter Ferry (G), Copper Siding (H), Hill (I), Scott County Library (J), Scott County Courthouse (K), Gate City Town Hall (L). Display/hide their locations on the map
Churches in zip code 24251 include: Alleys Chapel (A), Antioch Church (B), Red Hill Church (C), Bethel Church (D), Cameron Church (E), Catron Chapel (F), Center Valley Church (G), Cowan Branch Church (H), Farley Chapel (I). Display/hide their locations on the map
Cemeteries: Bellamy Cemetery (1), Peters Cemetery (2), Pierson Cemetery (3), Strong Cemetery (4), Pisgah Cemetery (5), Blair Cemetery (6), Vineyard Cemetery (7). Display/hide their locations on the map
Streams, rivers, and creeks: Venus Branch (A), Strong Branch (B), Red Hill Branch (C), Plank Camp Creek (D), Pike (E), Peters Branch (F), Lark Creek (G), Jones Branch (H), Henderson Branch (I). Display/hide their locations on the map
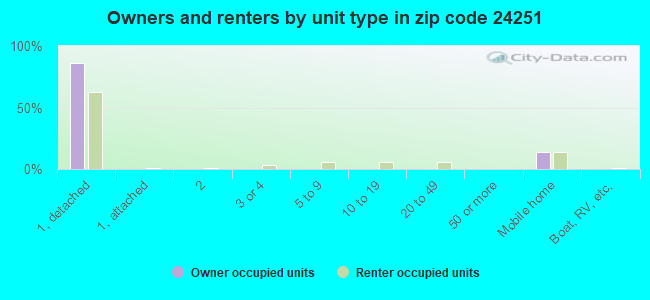
Size of family households: 1,385 2-persons, 297 3-persons, 330 4-persons, 104 5-persons, 62 6-persons, 23 7-or-more-persons
Size of nonfamily households: 1,249 1-person, 102 2-persons
852 married couples with children.
333 single-parent households (21 men, 312 women).
99.5% of residents of 24251 zip code speak English at home.
0.5% of residents speak other Indo-European language at home (100% very well).
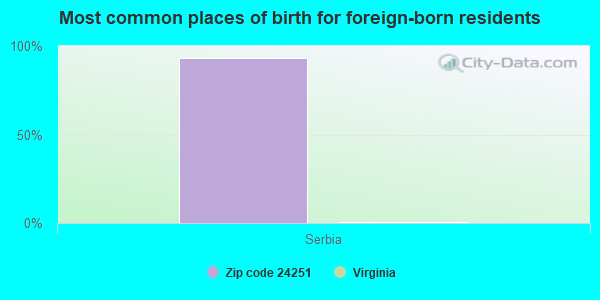
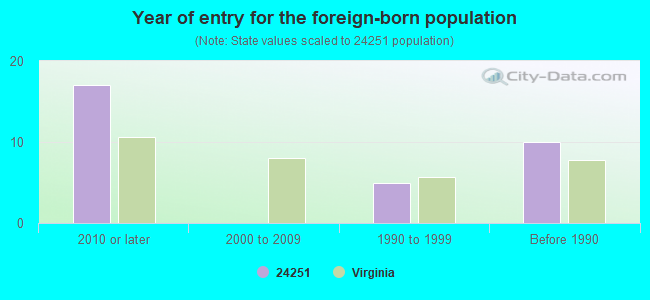
Foreign born population: 14 (0.2%) (0.0% of them are naturalized citizens)
:
0.2%
Whole state:
12.7%
93%Serbia
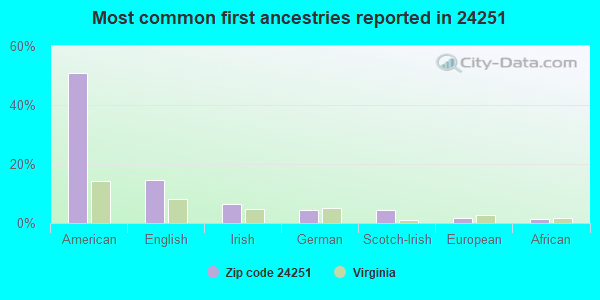
51%American
15%English
7%Irish
4%German
4%Scotch-Irish
2%European
1%African
Year of entry for the foreign-born population
172010 or later
02000 to 2009
51990 to 1999
10Before 1990
Facilities with environmental interests located in this zip code:
BROADWATER TRADING COMPANY (GATE CITY in GATE CITY, VA)
AIR MINOR (AIRS/AFS) STATE MASTER (Virginia pollutants databases) - CEDS-10421, AIR PROGRAM Business SIC and NAICS classification: HOUSEHOLD APPLIANCE STORES
A & G HEATING & COOLING (RT 6 BOX 350 in GATE CITY, VA)
AIR MINOR (AIRS/AFS) Business SIC classification: REFRIGERATION AND AIR-CONDITIONING SERVICE AND REPAIR SHOPS
Housing units lacking complete plumbing facilities: 9.5% Housing units lacking complete kitchen facilities: 11.5%
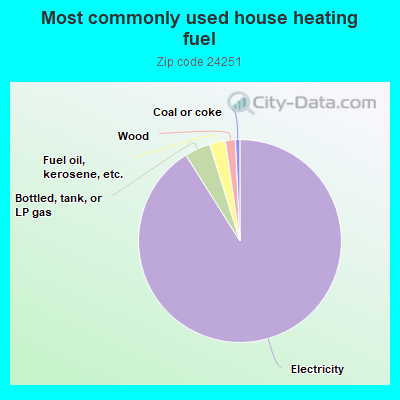
90.6%Electricity
4.1%Bottled, tank, or LP gas
2.5%Fuel oil, kerosene, etc.
1.6%Wood
0.7%Coal or coke
Population in 1990: 7,641. Population change in the 1990s: +1,289 (+16.9%).
Place of birth for U.S.-born residents:
This state: 2,197
Northeast: 167
Midwest: 240
South: 5,168
West: 68
73% of the 24251 zip code residents lived in the same house 5 years ago. Out of people who lived in different houses, 63% lived in this county. Out of people who lived in different counties, 50% lived in Virginia.
94% of the 24251 zip code residents lived in the same house 1 year ago. Out of people who lived in different houses, 66% moved from this county. Out of people who lived in different houses, 11% moved from different county within same state. Out of people who lived in different houses, 19% moved from different state. Out of people who lived in different houses, 5% moved from abroad.
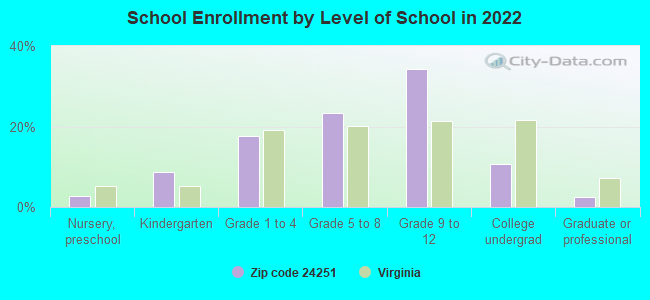
Private vs. public school enrollment:
Students in private schools in grades 1 to 8 (elementary and middle school): 24
Here:
5.3%
Virginia:
13.2%
Students in private schools in grades 9 to 12 (high school): 54
Here:
14.2%
Virginia:
10.2%
Students in private undergraduate colleges: 18
Here:
15.3%
Virginia:
18.7%
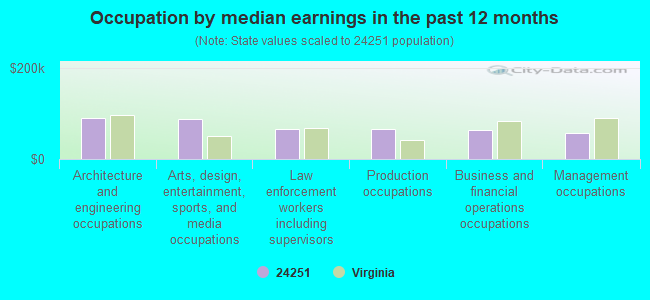
Occupation by median earnings in the past 12 months ($)
91,489Architecture and engineering occupations
88,156Arts, design, entertainment, sports, and media occupations
66,743Law enforcement workers including supervisors
65,660Production occupations
63,266Business and financial operations occupations
57,294Management occupations
Companies with federal contracts located in this zip code:
BUONACCORSI, PAUL P (RT 2 BOX 616 in GATE CITY, VA; small business) : $38,800 in 2 contractsfrom 2005 to 2006
$20,000 with Navy for Other Professional Services. Taking place in HI. Signed on 2005-07-29. Completion date: 2005-12-30.
$18,800, same as above.Signed on 2006-02-28. Completion date: 2006-04-28.
Top industries in this zip code by the number of employees in 2005:
Health Care and Social Assistance: Home Health Care Services (20-49: 1)
Health Care and Social Assistance: Services for the Elderly and Persons with Disabilities (20-49: 1)
People in group quarters in 2000:
33 people in local jails and other confinement facilities (including police lockups)
Fatal accident statistics in 2014:
Fatal accident count: 1
Vehicles involved in fatal accidents: 2
Fatal accidents caused by drunken drivers: 0
Fatalities: 1
Persons involved in fatal accidents: 3
Pedestrians involved in fatal accidents: 0
Fatal accident statistics in 2013:
Fatal accident count: 1
Vehicles involved in fatal accidents: 2
Fatal accidents caused by drunken drivers: 0
Fatalities: 1
Persons involved in fatal accidents: 4
Pedestrians involved in fatal accidents: 0
2002 - 2018 National Fire Incident Reporting System (NFIRS) incidents
According to the data from the years 2002 - 2018 the average number of fires per year is 48. The highest number of fires - 68 took place in 2002, and the least - 26 in 2015. The data has a decreasing trend.
When looking into fire subcategories, the most incidents belonged to: Outside Fires (40.3%), and Structure Fires (34.6%).
Fire incident types reported to NFIRS in Zip Code 24251
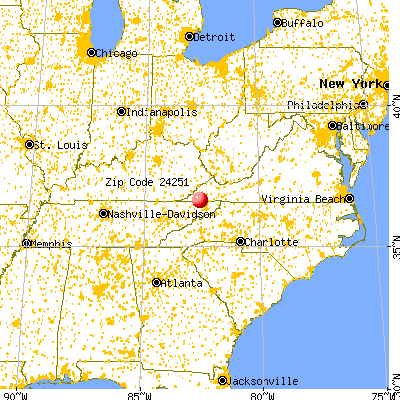


 Nearest zip codes: 24290, 37665, 24250, 37645, 37660, 37664.
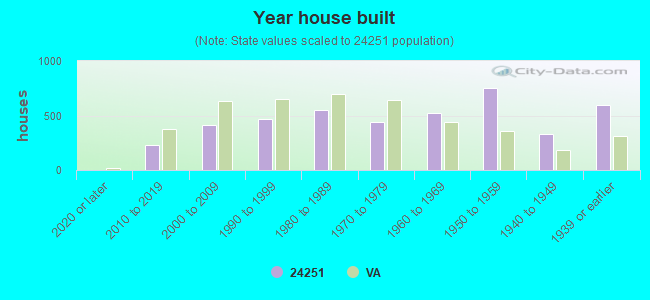


 According to the data from the years 2002 - 2018 the average number of fires per year is 48. The highest number of fires - 68 took place in 2002, and the least - 26 in 2015. The data has a decreasing trend.
 When looking into fire subcategories, the most incidents belonged to: Outside Fires (40.3%), and Structure Fires (34.6%).