Estimated zip code population in 2022: 13,089 Zip code population in 2010: 15,078 Zip code population in 2000: 16,602
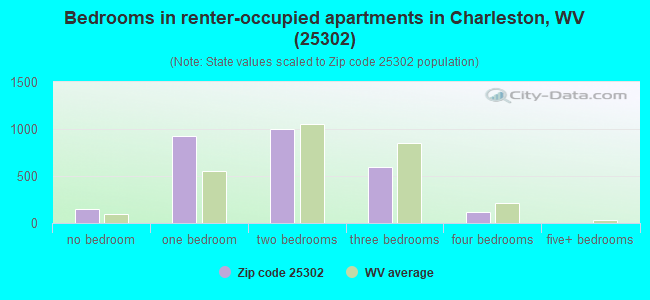
Houses and condos: 7,897 Renter-occupied apartments: 2,819
% of renters here:
42%
State:
26%
March 2022 cost of living index in zip code 25302: 85.5 (less than average, U.S. average is 100)
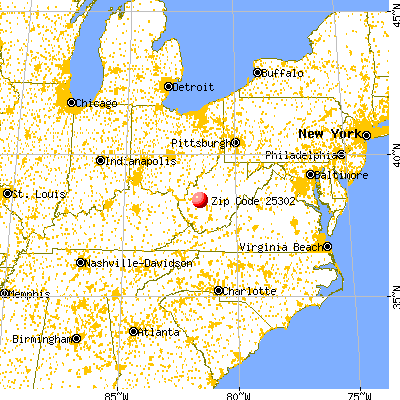
Land area: 12.2 sq. mi. Water area: 0.3 sq. mi.
Population density: 1,071 people per square mile
(low).
OSM Map
General Map
Google Map
MSN Map
OSM Map
General Map
Google Map
MSN Map
OSM Map
General Map
Google Map
MSN Map
OSM Map
General Map
Google Map
MSN Map
Please wait while loading the map...
Real estate property taxes paid for housing units in 2022:
This zip code:
0.7% ($942)
West Virginia:
0.5% ($821)
Median real estate property taxes paid for housing units with mortgages in 2022: $1,036 (0.6%) Median real estate property taxes paid for housing units with no mortgage in 2022: $819 (0.8%)
Averages for the 2020 tax year for zip code 25302, filed in 2021:
Average Adjusted Gross Income (AGI) in 2020: $49,432 (Individual Income Tax Returns)
Here:
$49,432
State:
$56,292
Salary/wage: $41,248 (reported on 80.3% of returns)
Here:
$41,248
State:
$49,093
(% of AGI for various income ranges: 1068.9% for AGIs below $25k, 3282.5% for AGIs $25k-50k, 5998.8% for AGIs $50k-75k, 8942.4% for AGIs $75k-100k, 15747.1% for AGIs $100k-200k, 57040.0% for AGIs over 200k)
Taxable interest for individuals: $1,545 (reported on 22.5% of returns)
This zip code:
$1,545
West Virginia:
$1,141
(% of AGI for various income ranges: 10.5% for AGIs below $25k, 22.4% for AGIs $25k-50k, 48.2% for AGIs $50k-75k, 57.6% for AGIs $75k-100k, 213.9% for AGIs $100k-200k, 1190.0% for AGIs over 200k)
Ordinary dividends: $7,302 (reported on 13.7% of returns)
Here:
$7,302
State:
$5,456
(% of AGI for various income ranges: 12.4% for AGIs below $25k, 30.1% for AGIs $25k-50k, 104.7% for AGIs $50k-75k, 235.3% for AGIs $75k-100k, 548.7% for AGIs $100k-200k, 6237.5% for AGIs over 200k)
Net capital gain/loss in AGI: +$8,391 (reported on 11.0% of returns)
Here:
+$8,391
State:
+$11,656
(% of AGI for various income ranges: 2.1% for AGIs below $25k, 18.8% for AGIs $25k-50k, 62.4% for AGIs $50k-75k, 162.9% for AGIs $75k-100k, 499.5% for AGIs $100k-200k, 7747.5% for AGIs over 200k)
Profit/loss from business: +$10,423 (reported on 10.4% of returns)
Here:
+$10,423
State:
+$12,084
(% of AGI for various income ranges: 50.7% for AGIs below $25k, 63.6% for AGIs $25k-50k, 122.9% for AGIs $50k-75k, 228.5% for AGIs $75k-100k, 525.3% for AGIs $100k-200k, 4460.0% for AGIs over 200k)
Taxable individual retirement arrangement distribution: $17,590 (reported on 8.5% of returns)
25302:
$17,590
West Virginia:
$15,311
(% of AGI for various income ranges: 43.3% for AGIs below $25k, 90.5% for AGIs $25k-50k, 294.1% for AGIs $50k-75k, 442.6% for AGIs $75k-100k, 913.4% for AGIs $100k-200k, 2485.0% for AGIs over 200k)
Self-employed (Keogh) retirement plans: $22,025 (reported on 0.6% of returns)
25302:
$22,025
West Virginia:
$27,405
(% of AGI for various income ranges: 231.8% for AGIs $100k-200k)
Total itemized deductions: $29,814 (reported on 3.1% of returns)
Here:
$29,814
State:
$31,950
(% of AGI for various income ranges: 32.1% for AGIs below $25k, 90.6% for AGIs $50k-75k, 242.6% for AGIs $75k-100k, 615.8% for AGIs $100k-200k, 4570.0% for AGIs over 200k)
Charity contributions: $11,639 (reported on 2.6% of returns)
Here:
$11,639
State:
$12,364
(% of AGI for various income ranges: 15.3% for AGIs $25k-50k, 63.5% for AGIs $75k-100k, 236.3% for AGIs $100k-200k, 1867.5% for AGIs over 200k)
Taxes paid: $7,755 (reported on 2.9% of returns)
25302:
$7,755
State:
$7,665
(% of AGI for various income ranges: 3.1% for AGIs below $25k, 17.0% for AGIs $50k-75k, 57.4% for AGIs $75k-100k, 180.0% for AGIs $100k-200k, 1240.0% for AGIs over 200k)
Earned income credit: $2,166 (reported on 21.2% of returns)
Here:
$2,166
State:
$2,258
(% of AGI for various income ranges: 102.1% for AGIs below $25k, 64.4% for AGIs $25k-50k)
Percentage of individuals using paid preparers for their 2020 taxes: 91.8%
Here:
92%
State:
93%
(% for various income ranges: 92.5% for AGIs below $25k, 91.6% for AGIs $25k-50k, 90.3% for AGIs $50k-75k, 90.2% for AGIs $75k-100k, 92.5% for AGIs $100k-200k, 92.3% for AGIs over 200k)
Averages for the 2012 tax year for zip code 25302, filed in 2013:
Average Adjusted Gross Income (AGI) in 2012: $44,973 (Individual Income Tax Returns)
Here:
$44,973
State:
$48,628
Salary/wage: $35,801 (reported on 83.7% of returns)
Here:
$35,801
State:
$42,328
(% of AGI for various income ranges: 76.8% for AGIs below $25k, 76.7% for AGIs $25k-50k, 71.1% for AGIs $50k-75k, 73.1% for AGIs $75k-100k, 68.8% for AGIs $100k-200k, 29.2% for AGIs over 200k)
Taxable interest for individuals: $1,387 (reported on 26.6% of returns)
This zip code:
$1,387
West Virginia:
$1,211
(% of AGI for various income ranges: 0.9% for AGIs below $25k, 0.7% for AGIs $25k-50k, 1.0% for AGIs $50k-75k, 0.8% for AGIs $75k-100k, 0.9% for AGIs $100k-200k, 0.5% for AGIs over 200k)
Ordinary dividends: $6,336 (reported on 15.4% of returns)
Here:
$6,336
State:
$4,262
(% of AGI for various income ranges: 1.5% for AGIs below $25k, 1.0% for AGIs $25k-50k, 1.8% for AGIs $50k-75k, 1.5% for AGIs $75k-100k, 2.4% for AGIs $100k-200k, 4.9% for AGIs over 200k)
Net capital gain/loss in AGI: +$5,589 (reported on 10.6% of returns)
Here:
+$5,589
State:
+$8,875
(% of AGI for various income ranges: 0.1% for AGIs $50k-75k, 0.7% for AGIs $75k-100k, 2.0% for AGIs $100k-200k, 5.2% for AGIs over 200k)
Profit/loss from business: +$13,942 (reported on 10.4% of returns)
Here:
+$13,942
State:
+$13,636
(% of AGI for various income ranges: 4.0% for AGIs below $25k, 2.1% for AGIs $25k-50k, 2.2% for AGIs $50k-75k, 3.8% for AGIs $75k-100k, 4.1% for AGIs $100k-200k, 3.3% for AGIs over 200k)
Taxable individual retirement arrangement distribution: $11,940 (reported on 9.6% of returns)
25302:
$11,940
West Virginia:
$11,787
(% of AGI for various income ranges: 1.9% for AGIs below $25k, 2.0% for AGIs $25k-50k, 2.8% for AGIs $50k-75k, 2.6% for AGIs $75k-100k, 3.5% for AGIs $100k-200k, 2.1% for AGIs over 200k)
Self-employment retirement plans: $28,300 (reported on 0.8% of returns)
25302:
$28,300
West Virginia:
$24,483
(% of AGI for various income ranges: 1.0% for AGIs $75k-100k, 2.5% for AGIs over 200k)
Total itemized deductions: $20,616 (18% of AGI, reported on 16.8% of returns)
Here:
$20,616
State:
$21,148
Here:
18.4% of AGI
State:
18.1% of AGI
(% of AGI for various income ranges: 3.0% for AGIs below $25k, 4.2% for AGIs $25k-50k, 7.1% for AGIs $50k-75k, 7.0% for AGIs $75k-100k, 11.0% for AGIs $100k-200k, 13.3% for AGIs over 200k)
Charity contributions: $5,138 (reported on 13.1% of returns)
Here:
$5,138
State:
$4,508
(% of AGI for various income ranges: 0.3% for AGIs below $25k, 0.6% for AGIs $25k-50k, 1.3% for AGIs $50k-75k, 1.3% for AGIs $75k-100k, 1.7% for AGIs $100k-200k, 3.9% for AGIs over 200k)
Taxes paid: $7,542 (reported on 16.8% of returns)
25302:
$7,542
State:
$8,103
(% of AGI for various income ranges: 0.4% for AGIs below $25k, 0.8% for AGIs $25k-50k, 1.9% for AGIs $50k-75k, 2.4% for AGIs $75k-100k, 4.7% for AGIs $100k-200k, 6.4% for AGIs over 200k)
Earned income credit: $2,103 (reported on 23.0% of returns)
Here:
$2,103
State:
$2,140
(% of AGI for various income ranges: 6.9% for AGIs below $25k, 0.9% for AGIs $25k-50k)
Percentage of individuals using paid preparers for their 2012 taxes: 40.9%
Here:
41%
State:
49%
(% for various income ranges: 38.6% for AGIs below $25k, 36.0% for AGIs $25k-50k, 43.3% for AGIs $50k-75k, 47.2% for AGIs $75k-100k, 54.4% for AGIs $100k-200k, 75.0% for AGIs over 200k)
Averages for the 2004 tax year for zip code 25302, filed in 2005:
Average Adjusted Gross Income (AGI) in 2004: $39,943 (Individual Income Tax Returns)
Here:
$39,943
State:
$37,498
Salary/wage: $33,645 (reported on 81.9% of returns)
Here:
$33,645
State:
$33,645
(% of AGI for various income ranges: 94.9% for AGIs below $10k, 73.9% for AGIs $10k-25k, 77.8% for AGIs $25k-50k, 78.1% for AGIs $50k-75k, 78.1% for AGIs $75k-100k, 48.3% for AGIs over 100k)
Taxable interest for individuals: $2,035 (reported on 40.0% of returns)
This zip code:
$2,035
West Virginia:
$1,465
(% of AGI for various income ranges: 4.2% for AGIs below $10k, 2.5% for AGIs $10k-25k, 2.2% for AGIs $25k-50k, 1.8% for AGIs $50k-75k, 2.0% for AGIs $75k-100k, 1.8% for AGIs over 100k)
Taxable dividends: $4,406 (reported on 20.9% of returns)
Here:
$4,406
State:
$2,913
(% of AGI for various income ranges: 2.9% for AGIs below $10k, 1.3% for AGIs $10k-25k, 1.6% for AGIs $25k-50k, 1.3% for AGIs $50k-75k, 2.1% for AGIs $75k-100k, 4.0% for AGIs over 100k)
Net capital gain/loss: +$6,592 (reported on 14.6% of returns)
Here:
+$6,592
State:
+$6,331
(% of AGI for various income ranges: -0.3% for AGIs below $10k, 0.0% for AGIs $10k-25k, 0.4% for AGIs $25k-50k, 0.6% for AGIs $50k-75k, 1.2% for AGIs $75k-100k, 6.8% for AGIs over 100k)
Profit/loss from business: +$13,665 (reported on 11.1% of returns)
Here:
+$13,665
State:
+$11,074
(% of AGI for various income ranges: 7.6% for AGIs below $10k, 2.8% for AGIs $10k-25k, 2.5% for AGIs $25k-50k, 1.7% for AGIs $50k-75k, 2.0% for AGIs $75k-100k, 7.1% for AGIs over 100k)
IRA payment deduction: $2,648 (reported on 2.0% of returns)
25302:
$2,648
West Virginia:
$2,796
(% of AGI for various income ranges: 0.1% for AGIs $10k-25k, 0.3% for AGIs $25k-50k, 0.1% for AGIs $50k-75k, 0.1% for AGIs $75k-100k, 0.1% for AGIs over 100k)
Self-employed pension: $19,645 (reported on 0.9% of returns)
Here:
$19,645
West Virginia:
$18,181
Total itemized deductions: $17,120 (18% of AGI, reported on 20.4% of returns)
Here:
$17,120
State:
$16,976
Here:
18.4% of AGI
State:
19.0% of AGI
(% of AGI for various income ranges: 2.7% for AGIs below $10k, 4.2% for AGIs $10k-25k, 6.2% for AGIs $25k-50k, 7.6% for AGIs $50k-75k, 10.9% for AGIs $75k-100k, 12.7% for AGIs over 100k)
Charity contributions deductions: $4,221 (4% of AGI, reported on 17.1% of returns)
Here:
$4,221
State:
$3,529
Here:
4.3% of AGI
State:
3.7% of AGI
(% of AGI for various income ranges: 0.6% for AGIs $10k-25k, 1.1% for AGIs $25k-50k, 1.3% for AGIs $50k-75k, 2.0% for AGIs $75k-100k, 3.2% for AGIs over 100k)
Total tax: $6,386 (reported on 74.4% of returns)
25302:
$6,386
State:
$5,372
(% of AGI for various income ranges: 2.1% for AGIs below $10k, 3.9% for AGIs $10k-25k, 7.7% for AGIs $25k-50k, 10.0% for AGIs $50k-75k, 11.8% for AGIs $75k-100k, 20.4% for AGIs over 100k)
Earned income credit: $1,635 (reported on 18.5% of returns)
Here:
$1,635
State:
$1,662
Percentage of individuals using paid preparers for their 2004 taxes: 49.2%
Here:
49%
State:
55%
(% for various income ranges: 47.2% for AGIs below $10k, 51.3% for AGIs $10k-25k, 46.1% for AGIs $25k-50k, 48.1% for AGIs $50k-75k, 47.7% for AGIs $75k-100k, 62.5% for AGIs over 100k)
Likely homosexual households (counted as self-reported same-sex unmarried-partner households)
Lesbian couples: 0.0% of all households
Gay men: 0.7% of all households
Household received Food Stamps/SNAP in the past 12 months: 1,420 Household did not receive Food Stamps/SNAP in the past 12 months: 5,382
Women who had a birth in the past 12 months: 87 (89 now married, 0 unmarried) Women who did not have a birth in the past 12 months: 2,908 (941 now married, 1,970 unmarried)
Housing units in zip code 25302 with a mortgage: 1,872 (246 second mortgage, 193 both second mortgage and home equity loan) Houses without a mortgage: 86
Median monthly owner costs for units with a mortgage: $1,192 Median monthly owner costs for units without a mortgage: $416
Residents with income below the poverty level in 2022:
This zip code:
15.7%
Whole state:
17.9%
Residents with income below 50% of the poverty level in 2022:
This zip code:
9.3%
Whole state:
9.7%
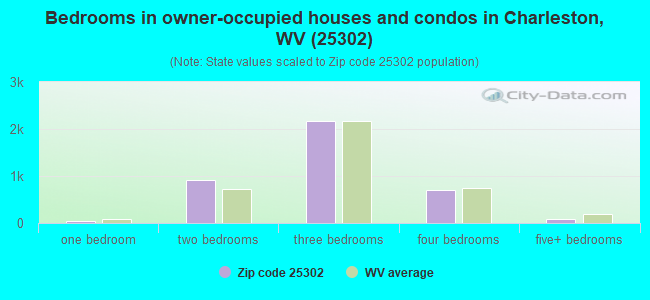
Median number of rooms in houses and condos:
Here:
6.7
State:
6.5
Median number of rooms in apartments:
Here:
4.4
State:
4.7
Notable locations in this zip code not listed on our city pages
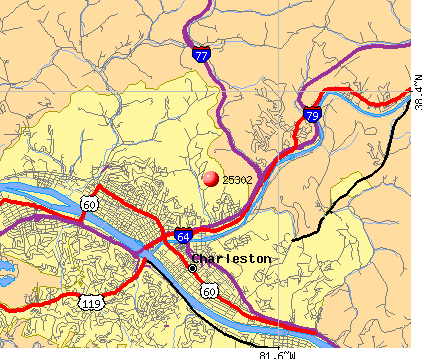
Notable locations in zip code 25302: Cato Park Golf Course (A), Edgewood Country Club (B), Pinch Volunteer Fire Department Substation (C), Charleston Fire Department Station 2 (D), Charleston Area Medical Center Women and Childrens Hospital (E), Charleston Fire Department Station 7 (F). Display/hide their locations on the map
Churches in zip code 25302 include: Saint Lukes Episcopal Church (A), Humphreys Memorial United Methodist Church (B), Hobbs Memorial Presbyterian Church (C), Boyd Memorial Church in Christ (D), Community Missionary Baptist Church (E), Wesley United Methodist Church (F), Weekley United Methodist Church (G), Sixth Street Methodist Episcopal Church (H), Saint Anthony Roman Catholic Church (I). Display/hide their locations on the map
Streams, rivers, and creeks: Newhouse Branch (A), Mink Shoal Run (B), Magazine Branch (C), Coopers Creek (D), Elk River (E). Display/hide their locations on the map
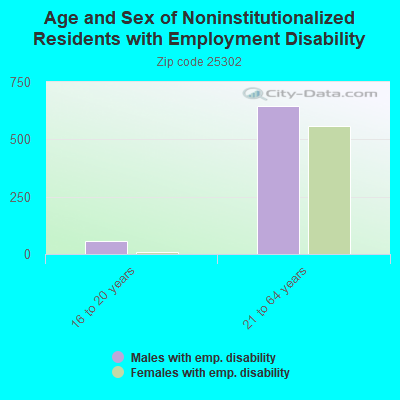
In group quarters: 30 (-1 institutionalized population)
Size of family households: 1,646 2-persons, 837 3-persons, 411 4-persons, 98 5-persons, 50 6-persons, 58 7-or-more-persons
Size of nonfamily households: 3,131 1-person, 526 2-persons, 14 4-persons
1,126 married couples with children.
566 single-parent households (147 men, 419 women).
98.4% of residents of 25302 zip code speak English at home.
0.9% of residents speak Spanish at home (19% very well, 69% well, 12% not well).
0.2% of residents speak other Indo-European language at home (100% very well).
0.5% of residents speak Asian or Pacific Island language at home (90% very well, 10% not well).
0.1% of residents speak other language at home (100% very well).
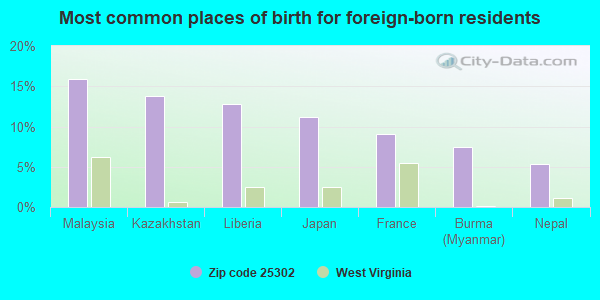
Foreign born population: 207 (1.6%) (62.7% of them are naturalized citizens)
Major facilities with environmental interests located in this zip code:
ELK ELEMENTARY CENTER (3320 PENNSYLVANIA AVE in CHARLESTON, WV)
ENFORCEMENT/COMPLIANCE ACTIVITY (Integrated Compliance Information System) COMPLIANCE ACTIVITY (Tracking inspections of insecticide, fungicide, and rodenticide, and toxic substances) (National Center for Education Statistics) - STATE ID-39279 Business SIC classification: ELEMENTARY AND SECONDARY SCHOOLS Organizations: KANAWHA COUNTY SCHOOL DISTRICT (SCHOOL DISTRICT)
Alternative names: ELK ELEMENTARY SCHOOL
CHESAPEAKE & POTOMAC TELEPHONE CO (1616 PENNSYLVANIA AVE in CHARLESTON, WV)
AIR MINOR (AIRS/AFS) (Resource Conservation and Recovery Act (tracking hazardous waste)) Business SIC classification: TELEPHONE COMMUNICATIONS, EXCEPT RADIOTELEPHONE Organizations: OPERNAME (CONTACT/OPERATOR)
, VERIZON WEST VIRGINIA INC (CONTACT/OWNER)
Alternative names: VERIZON WEST VIRGINIA INC, VERIZON WEST VIRGINIA INC.
COLUMBIA NATURAL RESOURCES (900 PENNSYLVANIA AVE in CHARLESTON, WV)
(Integrated Compliance Information System) - ICIS-03-1997-0288, FORMAL ENFORCEMENT ACTION, ICIS-03-1995-0203, ICIS-03-1994-0153, ICIS-03-2005-0206, ENFORCEMENT/COMPLIANCE ACTIVITY Business SIC classification: CRUDE PETROLEUM AND NATURAL GAS
A T & T INFORMATION SYSTEMS CHARLESTON (741 CRESCENT ROAD in CHARLESTON, WV)
(Resource Conservation and Recovery Act (tracking hazardous waste)) Organizations: OPERNAME (CONTACT/OPERATOR)
, AT & T INFORMATION SYSTEMS (CONTACT/OWNER)
AT&T COMMUNICATIONS OF WV (500 W WASHINGTON ST in CHARLESTON, WV)
(Resource Conservation and Recovery Act (tracking hazardous waste)) Organizations: OPERNAME (CONTACT/OPERATOR)
, MYERS TRANSFER CO (CONTACT/OWNER)
Alternative names: AT&T CO MYERS TRANSFER CO
BOICES AUTO CLINIC (2362 PENNSYLVANIA AVE in CHARLESTON, WV)
(Resource Conservation and Recovery Act (tracking hazardous waste)) Organizations: OPERNAME (CONTACT/OPERATOR)
, DODSON JAMES (CONTACT/OWNER)
CHESAPEAKE & POTOMAC TELEPHONE CO (1008 PENN AVE in CHARLESTON, WV)
(Resource Conservation and Recovery Act (tracking hazardous waste)) Organizations: OPERNAME (CONTACT/OPERATOR)
, CHESEPEAKE & POTOMAC TELEPHONE CO (CONTACT/OWNER)
DRAVO CORPORATION CHARLESTON PLANT (1100 PENNSYLVANIA AVENUE in CHARLESTON, WV)
BELL ATLANTIC WV 41153 (1600 PENNSYLVANIA AVE in CHARLESTON, WV)
(Resource Conservation and Recovery Act (tracking hazardous waste)) Organizations: W V AMERICAN WATER CO (CONTACT/OWNER)
BIG CHIMNEY MHP (OFF CUT DRIVE in BIG CHIMNEY, WV)
National Pollutant Discharge Elimination System NON-MAJOR (Tracking pollutant discharge elimination systems) - permit Business SIC classification: OPERATORS OF RESIDENTIAL MOBILE HOME SITES Organizations: SMART, TERRY (CONTACT/OWNER)
Alternative names: SMART, TERRY, TERRY SMART
Housing units lacking complete plumbing facilities: 5.2% Housing units lacking complete kitchen facilities: 6.8%
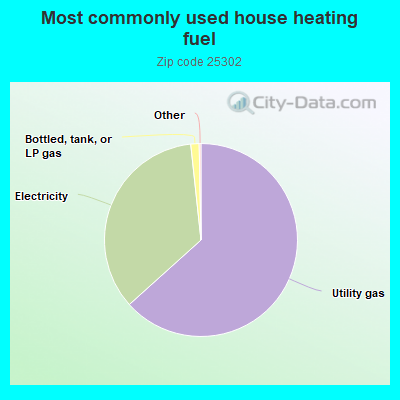
63.4%Utility gas
35.0%Electricity
1.4%Bottled, tank, or LP gas
Population in 1990: 20,267.
Place of birth for U.S.-born residents:
This state: 9,346
Northeast: 808
Midwest: 558
South: 1,637
West: 467
59% of the 25302 zip code residents lived in the same house 5 years ago. Out of people who lived in different houses, 76% lived in this county. Out of people who lived in different counties, 50% lived in West Virginia.
88% of the 25302 zip code residents lived in the same house 1 year ago. Out of people who lived in different houses, 61% moved from this county. Out of people who lived in different houses, 14% moved from different county within same state. Out of people who lived in different houses, 22% moved from different state.
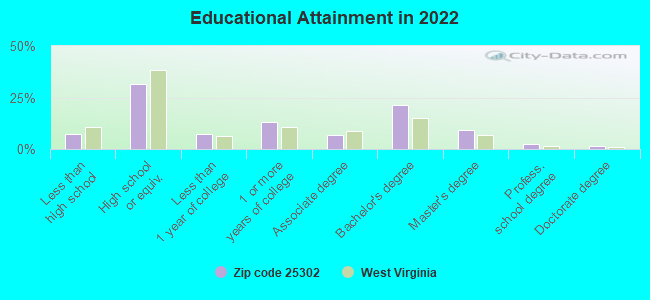
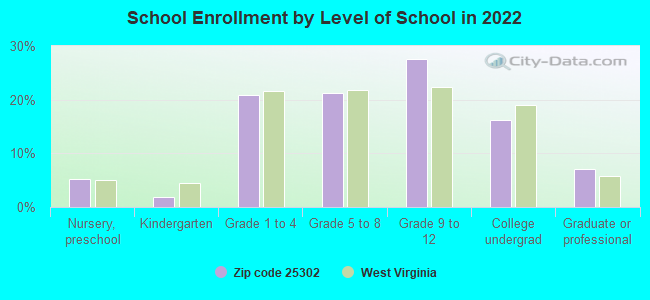
Private vs. public school enrollment:
Students in private schools in grades 1 to 8 (elementary and middle school): 51
Here:
5.7%
West Virginia:
12.2%
Students in private schools in grades 9 to 12 (high school): 3
Here:
0.6%
West Virginia:
8.8%
Students in private undergraduate colleges: 191
Here:
52.1%
West Virginia:
17.3%
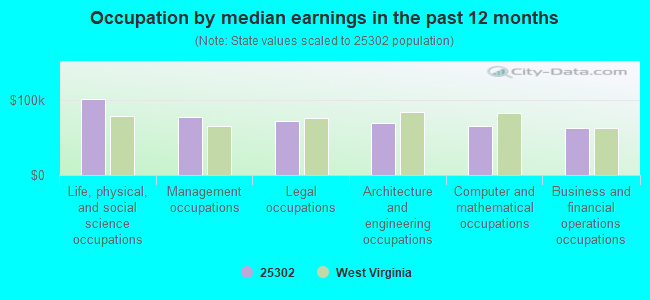
Occupation by median earnings in the past 12 months ($)
101,233Life, physical, and social science occupations
77,692Management occupations
72,078Legal occupations
69,465Architecture and engineering occupations
65,898Computer and mathematical occupations
62,712Business and financial operations occupations
Companies with federal contracts located in this zip code (CHARLESTON, WV):
CAPITOL BUSINESS EQUIPMENT (711 INDIANA AVENUE; small business) : $252,922 in 7 contractsfrom 2004 to 2005
Contracts for Office Supplies, Office Furniture, Installation of Equipment -- Furniture, Miscellaneous Furniture and Fixtures by Army Signed by year:2000: $0; 2001: $0; 2002: $0; 2003: $0; 2004: $41,543; 2005: $211,379; 2006: $0.
Biggest contracts:
$83,170 with Army for Office Supplies. Signed on 2005-09-10. Completion date: 2005-11-26.
$55,155 with Army for Office Furniture. Signed on 2005-06-10. Completion date: 2005-07-29.
$43,206, same as above.Signed on 2005-07-06. Completion date: 2005-08-05.
$23,550, same as above.Signed on 2004-09-12. Completion date: 2004-11-29.
AMERICAN OFFICE SYSTEMS INC (619 VIRGINIA ST W; small business) : $79,315 in 9 contractsfrom 2000 to 2004
Contracts for Printing, Duplicating, and Bookbinding Equipment, Office Information System Equipment, Office Supplies, Miscellaneous Office Machines, and moreby Department of Defense, U.S. Army Corps of Engineers - civil program financing only, SOCIAL SECURITY ADMINISTRATION, Army, and others Signed by year:2000: $61,928; 2001: $4,677; 2002: $13,630; 2003: $64; 2004: -$984; 2005: $0; 2006: $0.
Biggest contracts:
$32,292 with Department of Defense for Printing, Duplicating, and Bookbinding Equipment. Taking place in MD. Signed on 2000-12-05. Completion date: 2001-04-23.
$29,636 with Department of Defense for Office Information System Equipment. Taking place in MD. Signed on 2000-04-19. Completion date: 2000-04-26.
$4,677 with U.S. Army Corps of Engineers - civil program financing only for Office Supplies. Signed on 2001-12-17. Completion date: 2002-04-26.
$4,677, same as above.Signed on 2002-01-09. Completion date: 2002-04-26.
O.V. SMITH&SONS OF BIG CHIMNEY (BIG CHIMNEY STA; small business) 150 employees, $15600000 revenue. : $69,561 in 40 contractsfrom 2002 to 2006
Contracts for Lease or Rental of Facilities -- Office Buildings by Public Buildings Service Signed by year:2000: $0; 2001: $0; 2002: $8,276; 2003: $30,465; 2004: $4,188; 2005: $18,184; 2006: $8,448.
Biggest contracts:
$4,158 with Public Buildings Service for Lease or Rental of Facilities -- Office Buildings. Signed on 2003-09-15. Completion date: 2003-09-15.
$4,158, same as above.Signed on 2003-06-15. Completion date: 2003-06-15.
$4,138, same as above.Signed on 2003-09-15. Completion date: 2003-09-15.
$4,138, same as above.Signed on 2002-12-15. Completion date: 2002-12-15.
COMPTON OFFICE MACHINE COMPANY (1829 BIGLEY AVE; small business) : $55,228 in 12 contractsfrom 2004 to 2006
Contracts for ADP Components, Printing, Duplicating, and Bookbinding Equipment by U.S. Army Corps of Engineers - civil program financing only, Army Signed by year:2000: $0; 2001: $0; 2002: $0; 2003: $0; 2004: $18,292; 2005: $32,126; 2006: $4,810.
Biggest contracts:
$9,146 with U.S. Army Corps of Engineers - civil program financing only for ADP Components. Signed on 2004-08-25. Completion date: 2004-09-15.
$9,146 with Army for ADP Components. Signed on 2004-08-25. Completion date: 2004-09-15.
$4,810 with Army for Printing, Duplicating, and Bookbinding Equipment. Taking place in OH. Signed on 2006-02-08. Completion date: 2006-02-03.
$4,594 with Army for Printing, Duplicating, and Bookbinding Equipment. Signed on 2005-12-07. Completion date: 2005-12-30.
JUDY'S LOCKSMITHS, INC (534 BURLEW DR; small business) : $27,948 in 2 contractsin 2004
$16,672 with Army for Miscellaneous Items. Signed on 2004-07-26. Completion date: 2004-09-09.
$11,276 with Army for Maintenance, Repair or Alteration of Real Property -- Miscellaneous Buildings. Signed on 2004-07-20. Completion date: 2004-08-14.
WALKER SIGN CO (1501 BIGLEY AVE; small business)
$26,394 with Army for Indoor and Outdoor Electric Lighting Fixtures. Signed on 2003-09-29. Completion date: 2003-11-10.
CAPITOL ENGINEERING, INC (111 WYOMING STREET, SUITE; small business)
$22,000 with Army for Environmental Studies and Assessments. Signed on 2004-11-22. Completion date: 2004-12-31.
USA WASTE SERVICES OF WV (7 SPRING STREET) : $6,714 in 2 contractsin 2002
$6,714 with Army for Trash/Garbage Collection Services - Including Portable Sanitation Services. Signed on 2002-10-01. Completion date: 2003-09-30.
$0, same as above.Signed on 2002-10-01. Completion date: 2003-09-30.
ROLSTON & COMPANY (405 PENNSYLVANIA AVE; small business)
$3,500 with Army for Other Professional Services. Taking place in MD. Signed on 2004-11-19. Completion date: 2005-01-14.
Top industries in this zip code by the number of employees in 2005:
Health Care and Social Assistance: General Medical and Surgical Hospitals (500-999 employees: 1 establishment)
Administrative and Support and Waste Management and Remediation Services: Janitorial Services (100-249: 2, 50-99: 1, 1-4: 1)
Administrative and Support and Waste Management and Remediation Services: Temporary Help Services (100-249: 1, 50-99: 2, 5-9: 3, 1-4: 1)
Health Care and Social Assistance: Offices of Physicians (except Mental Health Specialists) (20-49: 2, 10-19: 3, 5-9: 10, 1-4: 10)
Utilities: Water Supply and Irrigation Systems (50-99: 1, 20-49: 1, 10-19: 6, 1-4: 1)
2002 - 2018 National Fire Incident Reporting System (NFIRS) incidents
According to the data from the years 2002 - 2018 the average number of fire incidents per year is 161. The highest number of fire incidents - 232 took place in 2010, and the least - 19 in 2002. The data has a growing trend.
When looking into fire subcategories, the most incidents belonged to: Structure Fires (64.3%), and Outside Fires (21.3%).
Fire incident types reported to NFIRS in Zip Code 25302


 Nearest zip codes: 25311, 25301, 25305, 25312, 25304, 25314.
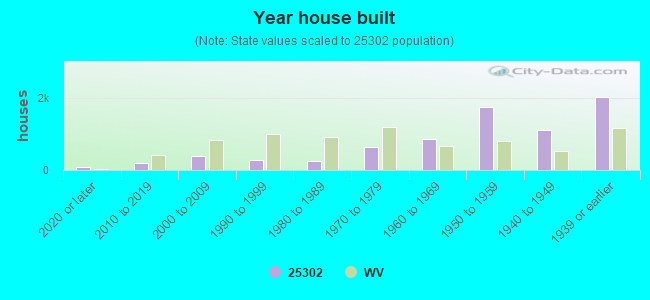


 According to the data from the years 2002 - 2018 the average number of fire incidents per year is 161. The highest number of fire incidents - 232 took place in 2010, and the least - 19 in 2002. The data has a growing trend.
 When looking into fire subcategories, the most incidents belonged to: Structure Fires (64.3%), and Outside Fires (21.3%).