Estimated zip code population in 2022: 2,492 Zip code population in 2010: 2,133 Zip code population in 2000: 1,775
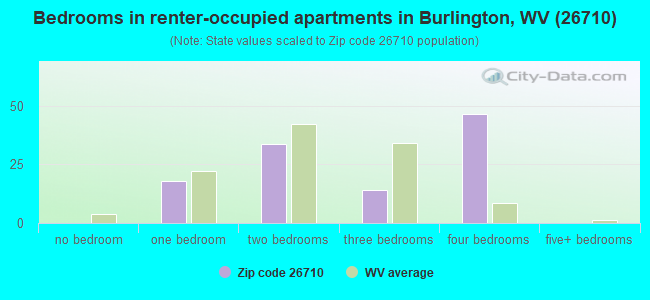
Houses and condos: 1,028 Renter-occupied apartments: 107
% of renters here:
12%
State:
26%
March 2022 cost of living index in zip code 26710: 84.6 (less than average, U.S. average is 100)
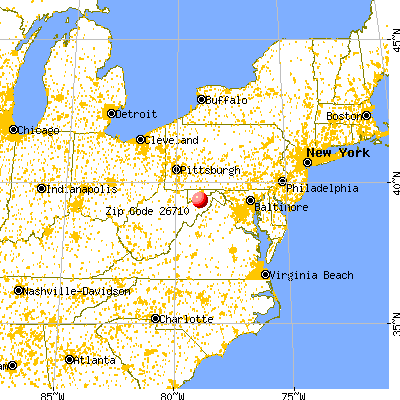
Land area: 82.5 sq. mi. Water area: 0.2 sq. mi.
Population density: 30 people per square mile
(very low).
OSM Map
General Map
Google Map
MSN Map
OSM Map
General Map
Google Map
MSN Map
OSM Map
General Map
Google Map
MSN Map
OSM Map
General Map
Google Map
MSN Map
Please wait while loading the map...
Real estate property taxes paid for housing units in 2022:
This zip code:
0.4% ($731)
West Virginia:
0.5% ($821)
Median real estate property taxes paid for housing units with mortgages in 2022: $1,026 (0.5%) Median real estate property taxes paid for housing units with no mortgage in 2022: $694 (0.4%)
Business Search- 14 Million verified businesses
Males: 1,194
(47.9%)
Females: 1,298
(52.1%)
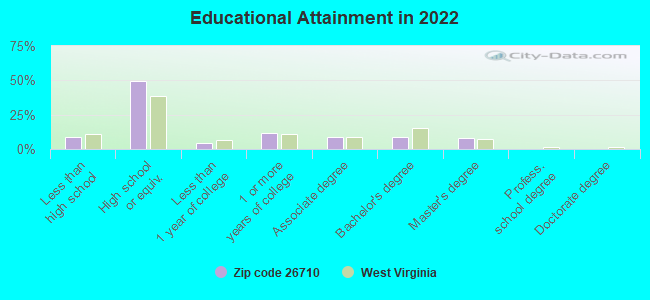
For population 25 years and over in 26710:
High school or higher: 89.8%
Bachelor's degree or higher: 16.7%
Graduate or professional degree: 8.0%
Unemployed: 2.9%
Mean travel time to work (commute): 22.9 minutes
For population 15 years and over in 26710:
Never married: 26.2%
Now married: 55.1%
Separated: 0.0%
Widowed: 3.9%
Divorced: 14.8%
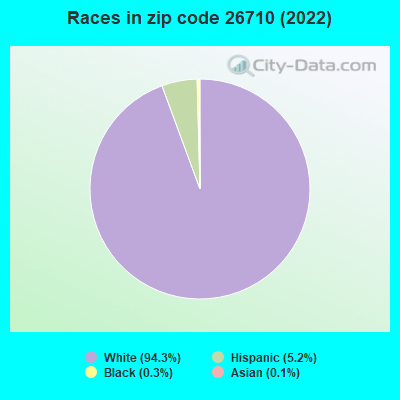
Zip code 26710 compared to state average:
Black race population percentage significantly below state average.
Hispanic race population percentage above state average.
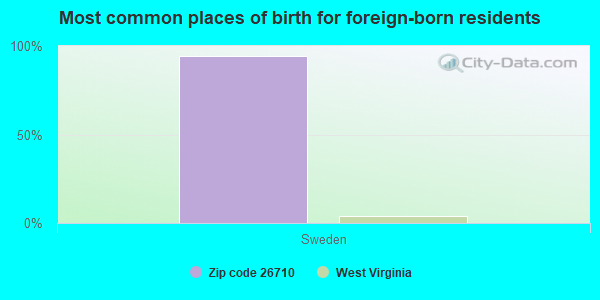
Foreign-born population percentage significantly below state average.
Renting percentage below state average.
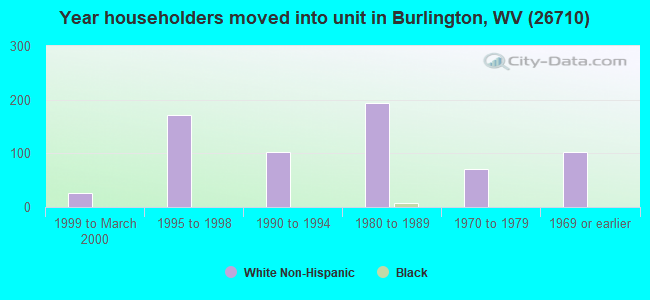
Length of stay since moving in significantly above state average.
Estimated median house/condo value in 2022: $195,417
26710:
$195,417
West Virginia:
$155,100
According to our research of West Virginia and other state lists, there were 6 registered sex offenders living in 26710 zip code as of April 26, 2024. The ratio of all residents to sex offenders in zip code 26710 is 431 to 1. The ratio of registered sex offenders to all residents in this zip code is lower than the state average.
Median resident age:
This zip code:
45.8 years
West Virginia median age:
42.9 years
Average household size:
This zip code:
2.7 people
West Virginia:
2.3 people
Averages for the 2020 tax year for zip code 26710, filed in 2021:
Average Adjusted Gross Income (AGI) in 2020: $48,800 (Individual Income Tax Returns)
Here:
$48,800
State:
$56,292
Salary/wage: $46,006 (reported on 77.8% of returns)
Here:
$46,006
State:
$49,093
(% of AGI for various income ranges: 1091.7% for AGIs below $25k, 3285.0% for AGIs $25k-50k, 6349.0% for AGIs $50k-75k, 8233.8% for AGIs $75k-100k, 16978.3% for AGIs $100k-200k)
Taxable interest for individuals: $528 (reported on 32.2% of returns)
This zip code:
$528
West Virginia:
$1,141
(% of AGI for various income ranges: 13.5% for AGIs below $25k, 12.0% for AGIs $25k-50k, 26.0% for AGIs $50k-75k, 27.5% for AGIs $75k-100k, 83.3% for AGIs $100k-200k)
Ordinary dividends: $1,717 (reported on 13.3% of returns)
Here:
$1,717
State:
$5,456
(% of AGI for various income ranges: 9.6% for AGIs below $25k, 18.5% for AGIs $25k-50k, 59.0% for AGIs $50k-75k, 146.7% for AGIs $100k-200k)
Net capital gain/loss in AGI: +$3,445 (reported on 12.2% of returns)
Here:
+$3,445
State:
+$11,656
(% of AGI for various income ranges: 27.0% for AGIs $25k-50k, 189.0% for AGIs $50k-75k, 226.7% for AGIs $100k-200k)
Profit/loss from business: +$4,550 (reported on 11.1% of returns)
Here:
+$4,550
State:
+$12,084
(% of AGI for various income ranges: 110.4% for AGIs below $25k, 89.0% for AGIs $25k-50k, 28.7% for AGIs $75k-100k)
Taxable individual retirement arrangement distribution: $11,586 (reported on 7.8% of returns)
26710:
$11,586
West Virginia:
$15,311
(% of AGI for various income ranges: 177.0% for AGIs $25k-50k, 571.2% for AGIs $75k-100k)
Earned income credit: $2,227 (reported on 16.7% of returns)
Here:
$2,227
State:
$2,258
(% of AGI for various income ranges: 83.0% for AGIs below $25k, 71.5% for AGIs $25k-50k)
Percentage of individuals using paid preparers for their 2020 taxes: 92.2%
Here:
92%
State:
93%
(% for various income ranges: 90.9% for AGIs below $25k, 95.8% for AGIs $25k-50k, 92.3% for AGIs $50k-75k, 90.0% for AGIs $75k-100k, 90.0% for AGIs $100k-200k)
Averages for the 2012 tax year for zip code 26710, filed in 2013:
Average Adjusted Gross Income (AGI) in 2012: $39,269 (Individual Income Tax Returns)
Here:
$39,269
State:
$48,628
Salary/wage: $37,079 (reported on 80.7% of returns)
Here:
$37,079
State:
$42,328
(% of AGI for various income ranges: 71.5% for AGIs below $25k, 78.2% for AGIs $25k-50k, 80.5% for AGIs $50k-75k, 83.6% for AGIs $75k-100k, 64.1% for AGIs $100k-200k)
Taxable interest for individuals: $493 (reported on 30.7% of returns)
This zip code:
$493
West Virginia:
$1,211
(% of AGI for various income ranges: 1.0% for AGIs below $25k, 0.3% for AGIs $25k-50k, 0.3% for AGIs $50k-75k, 0.3% for AGIs $75k-100k, 0.2% for AGIs $100k-200k)
Ordinary dividends: $867 (reported on 13.6% of returns)
Here:
$867
State:
$4,262
(% of AGI for various income ranges: 0.3% for AGIs below $25k, 0.4% for AGIs $25k-50k, 0.4% for AGIs $50k-75k, 0.4% for AGIs $75k-100k)
Net capital gain/loss in AGI: +$2,717 (reported on 6.8% of returns)
Here:
+$2,717
State:
+$8,875
Profit/loss from business: +$5,058 (reported on 13.6% of returns)
Here:
+$5,058
State:
+$13,636
(% of AGI for various income ranges: 7.8% for AGIs below $25k, 1.7% for AGIs $25k-50k, 1.4% for AGIs $50k-75k)
Taxable individual retirement arrangement distribution: $6,360 (reported on 5.7% of returns)
26710:
$6,360
West Virginia:
$11,787
Total itemized deductions: $17,431 (26% of AGI, reported on 18.2% of returns)
Here:
$17,431
State:
$21,148
Here:
25.5% of AGI
State:
18.1% of AGI
(% of AGI for various income ranges: 4.7% for AGIs below $25k, 5.5% for AGIs $25k-50k, 8.4% for AGIs $50k-75k, 10.6% for AGIs $75k-100k, 10.7% for AGIs $100k-200k)
Charity contributions: $3,470 (reported on 11.4% of returns)
Here:
$3,470
State:
$4,508
(% of AGI for various income ranges: 2.6% for AGIs below $25k, 0.5% for AGIs $50k-75k, 1.4% for AGIs $75k-100k, 1.5% for AGIs $100k-200k)
Taxes paid: $4,700 (reported on 18.2% of returns)
26710:
$4,700
State:
$8,103
(% of AGI for various income ranges: 0.8% for AGIs below $25k, 1.1% for AGIs $25k-50k, 1.8% for AGIs $50k-75k, 3.0% for AGIs $75k-100k, 4.2% for AGIs $100k-200k)
Earned income credit: $2,133 (reported on 20.5% of returns)
Here:
$2,133
State:
$2,140
(% of AGI for various income ranges: 6.7% for AGIs below $25k, 1.0% for AGIs $25k-50k)
Percentage of individuals using paid preparers for their 2012 taxes: 68.2%
Here:
68%
State:
49%
(% for various income ranges: 68.4% for AGIs below $25k, 69.6% for AGIs $25k-50k, 71.4% for AGIs $50k-75k, 62.5% for AGIs $75k-100k, 60.0% for AGIs $100k-200k)
Averages for the 2004 tax year for zip code 26710, filed in 2005:
Average Adjusted Gross Income (AGI) in 2004: $31,565 (Individual Income Tax Returns)
Here:
$31,565
State:
$37,498
Salary/wage: $30,426 (reported on 85.9% of returns)
Here:
$30,426
State:
$33,645
(% of AGI for various income ranges: 85.7% for AGIs below $10k, 77.1% for AGIs $10k-25k, 86.6% for AGIs $25k-50k, 85.1% for AGIs $50k-75k, 107.7% for AGIs $75k-100k)
Taxable interest for individuals: $751 (reported on 39.3% of returns)
This zip code:
$751
West Virginia:
$1,465
(% of AGI for various income ranges: 4.3% for AGIs below $10k, 1.7% for AGIs $10k-25k, 1.0% for AGIs $25k-50k, 0.3% for AGIs $50k-75k, 1.0% for AGIs $75k-100k)
Taxable dividends: $1,582 (reported on 15.8% of returns)
Here:
$1,582
State:
$2,913
(% of AGI for various income ranges: 4.0% for AGIs below $10k, 0.6% for AGIs $10k-25k, 0.4% for AGIs $25k-50k, 1.4% for AGIs $50k-75k, 0.3% for AGIs $75k-100k)
Net capital gain/loss: +$2,209 (reported on 10.1% of returns)
Here:
+$2,209
State:
+$6,331
(% of AGI for various income ranges: -2.5% for AGIs below $10k, 0.9% for AGIs $10k-25k, 1.4% for AGIs $25k-50k, 0.3% for AGIs $50k-75k, 0.7% for AGIs $75k-100k)
Profit/loss from business: +$6,796 (reported on 13.3% of returns)
Here:
+$6,796
State:
+$11,074
(% of AGI for various income ranges: -6.7% for AGIs below $10k, 6.3% for AGIs $10k-25k, 1.8% for AGIs $25k-50k, 5.2% for AGIs $50k-75k)
IRA payment deduction: $2,533 (reported on 1.8% of returns)
26710:
$2,533
West Virginia:
$2,796
Total itemized deductions: $14,103 (25% of AGI, reported on 14.8% of returns)
Here:
$14,103
State:
$16,976
Here:
24.9% of AGI
State:
19.0% of AGI
(% of AGI for various income ranges: 4.8% for AGIs $10k-25k, 5.7% for AGIs $25k-50k, 7.8% for AGIs $50k-75k, 12.6% for AGIs $75k-100k)
Charity contributions deductions: $2,770 (5% of AGI, reported on 11.8% of returns)
Here:
$2,770
State:
$3,529
Here:
4.7% of AGI
State:
3.7% of AGI
(% of AGI for various income ranges: 2.0% for AGIs below $10k, 0.8% for AGIs $25k-50k, 1.1% for AGIs $50k-75k, 2.7% for AGIs $75k-100k)
Total tax: $3,402 (reported on 71.6% of returns)
26710:
$3,402
State:
$5,372
(% of AGI for various income ranges: 3.5% for AGIs below $10k, 3.8% for AGIs $10k-25k, 6.1% for AGIs $25k-50k, 8.8% for AGIs $50k-75k, 11.1% for AGIs $75k-100k, 16.3% for AGIs over 100k)
Earned income credit: $1,649 (reported on 20.5% of returns)
Here:
$1,649
State:
$1,662
Percentage of individuals using paid preparers for their 2004 taxes: 67.1%
Here:
67%
State:
55%
(% for various income ranges: 67.9% for AGIs below $10k, 69.8% for AGIs $10k-25k, 67.3% for AGIs $25k-50k, 65.1% for AGIs $50k-75k, 72.1% for AGIs $75k-100k)
Household received Food Stamps/SNAP in the past 12 months: 106 Household did not receive Food Stamps/SNAP in the past 12 months: 802
Women who had a birth in the past 12 months: 16 (17 now married, 0 unmarried) Women who did not have a birth in the past 12 months: 544 (221 now married, 323 unmarried)
Housing units in zip code 26710 with a mortgage: 210 (16 second mortgage, 16 both second mortgage and home equity loan) Median monthly owner costs for units with a mortgage: $1,135 Median monthly owner costs for units without a mortgage: $365
Residents with income below the poverty level in 2022:
This zip code:
6.6%
Whole state:
17.9%
Residents with income below 50% of the poverty level in 2022:
This zip code:
0.4%
Whole state:
9.7%
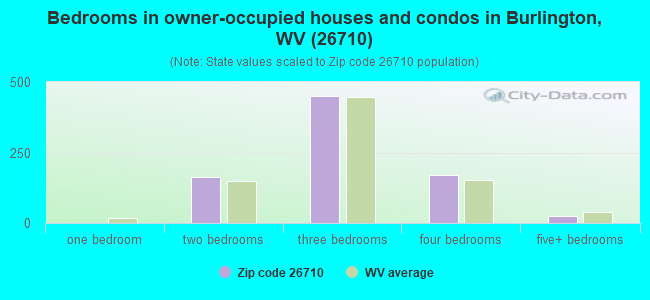
Median number of rooms in houses and condos:
Here:
6.6
State:
6.5
Median number of rooms in apartments:
Here:
4.3
State:
4.7
Notable locations in this zip code not listed on our city pages
Churches in zip code 26710 include: Kelley Chapel (A), Beaver Run Church (B), Saint Pauls Church (C), Markwood Church (D), Mount Olive United Methodist Church (E), Dry Run Church (F), The Ridge Brethren Church (G), Harness Run Church (H). Display/hide their locations on the map
Cemeteries: Whip Cemetery (1), Stone Chapel Cemetery (2), Sloan Cemetery (3), Schoemaker Cemetery (4), Roderick Cemetery (5), Rawlings Cemetery (6), Peerce Cemetery (7). Display/hide their locations on the map
Streams, rivers, and creeks: Sycamore Run (A), Sugar Run (B), Staggs Run (C), Spring Run (D), Pursley Run (E), Parrill Run (F), North Fork Patterson Creek (G), Mill Creek (H), Mikes Run (I). Display/hide their locations on the map
In group quarters: 25 (-1 institutionalized population)
Size of family households: 269 2-persons, 249 3-persons, 139 4-persons, 12 5-persons, 17 6-persons
Size of nonfamily households: 171 1-person, 48 2-persons, 6 4-persons
264 married couples with children.
98 single-parent households (16 men, 82 women).
93.9% of residents of 26710 zip code speak English at home.
5.7% of residents speak Spanish at home (100% very well).
0.5% of residents speak other Indo-European language at home (100% very well).
Foreign born population: 17 (0.7%) (0.0% of them are naturalized citizens)
:
0.7%
Whole state:
1.8%
94%Sweden
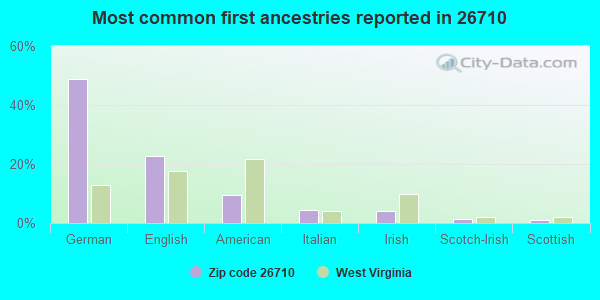
49%German
23%English
10%American
4%Italian
4%Irish
1%Scotch-Irish
1%Scottish
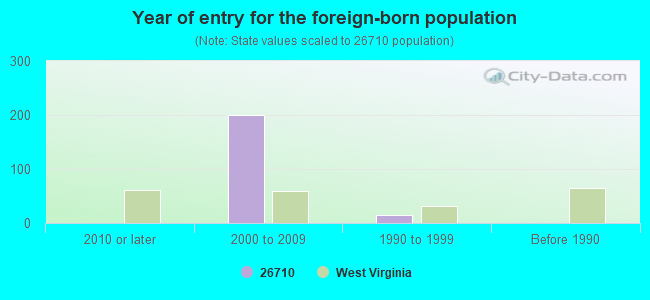
Year of entry for the foreign-born population
02010 or later
2002000 to 2009
151990 to 1999
0Before 1990
Facilities with environmental interests located in this zip code:
ARVIND AND SALGUNI PATEL (INTERSECTION RT 50 EAST/RT 220 S in BURLINGTON, WV)
(Integrated Compliance Information System) - ICIS-03-1999-0197, FORMAL ENFORCEMENT ACTION
FOXS (J RR 50 in BURLINGTON, WV)
(Integrated Compliance Information System) - ICIS-03-1999-0296, FORMAL ENFORCEMENT ACTION Business SIC classification: EATING PLACES
DISTRICT 5 HEADQUARTERS (US RT 50 in BURLINGTON, WV)
National Pollutant Discharge Elimination System NON-MAJOR (Tracking pollutant discharge elimination systems) - permit Business SIC classification: MISCELLANEOUS PERSONAL SERVICES Organizations: WV DIVISION OF HIGHWAYS (CONTACT/OWNER)
Alternative names: WV DIVISION OF HIGHWAYS
BOB'S AUTO CARE (RTE 50 WEST BOX 25813 in BURLINGTON, WV)
AIR MINOR (AIRS/AFS) Business SIC classification: AUTOMOTIVE REPAIR SHOPS
COLONIAL MOTEL (RT 1 BOX 59C in BURLINGTON, WV)
National Pollutant Discharge Elimination System NON-MAJOR (Tracking pollutant discharge elimination systems) - permit Business SIC classification: SEWERAGE SYSTEMS Alternative names: ARVIND PATEL, PATEL, ARVIND
FRAZIER'S SERVICE STATION (RTE 50 BOX 299 in BURLINGTON, WV)
AIR MINOR (AIRS/AFS) Business SIC classification: AUTOMOTIVE REPAIR SHOPS
Housing units lacking complete plumbing facilities: 1.0% Housing units lacking complete kitchen facilities: 0.9%
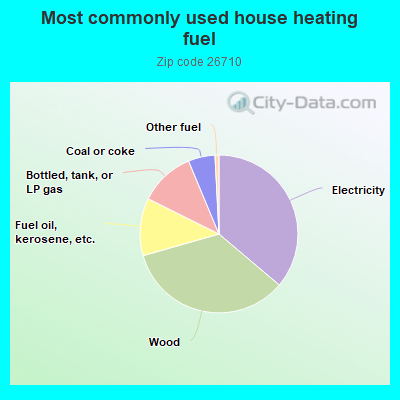
36.3%Electricity
34.5%Wood
11.8%Fuel oil, kerosene, etc.
11.4%Bottled, tank, or LP gas
5.5%Coal or coke
0.8%Other fuel
Population in 1990: 3,883.
Place of birth for U.S.-born residents:
This state: 974
Northeast: 76
Midwest: 74
South: 1,261
West: 7
76% of the 26710 zip code residents lived in the same house 5 years ago. Out of people who lived in different houses, 59% lived in this county. Out of people who lived in different counties, 50% lived in West Virginia.
97% of the 26710 zip code residents lived in the same house 1 year ago. Out of people who lived in different houses, 30% moved from this county. Out of people who lived in different houses, 85% moved from different state.
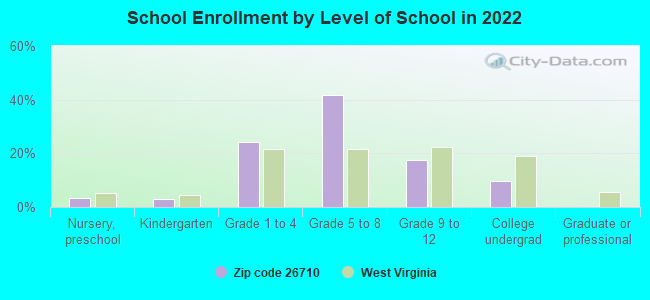
Private vs. public school enrollment:
Students in private schools in grades 1 to 8 (elementary and middle school): 23
Here:
8.4%
West Virginia:
12.2%
Students in private schools in grades 9 to 12 (high school): 30
Here:
39.3%
West Virginia:
8.8%
Students in private undergraduate colleges: 28
Here:
68.5%
West Virginia:
17.3%
Occupation by median earnings in the past 12 months ($)
144,231Business and financial operations occupations
80,154Health diagnosing and treating practitioners and other technical occupations
63,758Material moving occupations
53,467Installation, maintenance, and repair occupations
29,125Building and grounds cleaning and maintenance occupations
28,911Food preparation and serving related occupations
Top industries in this zip code by the number of employees in 2005:
Construction: New Single-Family Housing Construction (except Operative Builders) (10-19 employees: 1 establishment, 1-4 employees: 1 establishment)
Health Care and Social Assistance: Residential Mental Retardation Facilities (5-9: 1)
Professional, Scientific, and Technical Services: Surveying and Mapping (except Geophysical) Services (1-4: 1)
Accommodation and Food Services: Full-Service Restaurants (1-4: 1)
Arts, Entertainment, and Recreation: Golf Courses and Country Clubs (1-4: 1)
Construction: Residential Remodelers (1-4: 1)
People in group quarters in 2010:
24 people in residential treatment centers for juveniles (non-correctional)
People in group quarters in 2000:
15 people in other noninstitutional group quarters
9 people in other group homes
3 people in homes for the mentally retarded
Fatal accident statistics in 2014:
Fatal accident count: 1
Vehicles involved in fatal accidents: 1
Fatal accidents caused by drunken drivers: 0
Fatalities: 1
Persons involved in fatal accidents: 1
Pedestrians involved in fatal accidents: 0
Fatal accident statistics in 2013:
Fatal accident count: 1
Vehicles involved in fatal accidents: 1
Fatal accidents caused by drunken drivers: 1
Fatalities: 1
Persons involved in fatal accidents: 2
Pedestrians involved in fatal accidents: 0
2002 - 2018 National Fire Incident Reporting System (NFIRS) incidents
Based on the data from the years 2002 - 2018 the average number of fires per year is 29. The highest number of fires - 52 took place in 2005, and the least - 7 in 2002. The data has a rising trend.
When looking into fire subcategories, the most reports belonged to: Structure Fires (52.8%), and Outside Fires (32.9%).
Fire incident types reported to NFIRS in Zip Code 26710


 Nearest zip codes: 26852, 26726, 26743, 26845, 26731, 26750.


 Based on the data from the years 2002 - 2018 the average number of fires per year is 29. The highest number of fires - 52 took place in 2005, and the least - 7 in 2002. The data has a rising trend.
 When looking into fire subcategories, the most reports belonged to: Structure Fires (52.8%), and Outside Fires (32.9%).