Estimated zip code population in 2022: 3,091 Zip code population in 2010: 3,007 Zip code population in 2000: 2,811
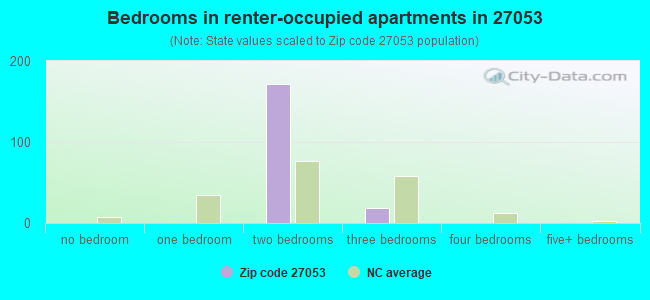
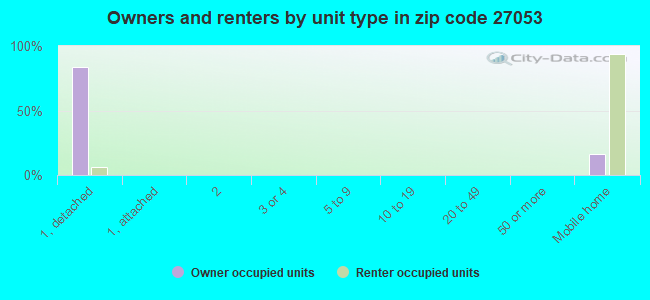
Houses and condos: 1,765 Renter-occupied apartments: 193
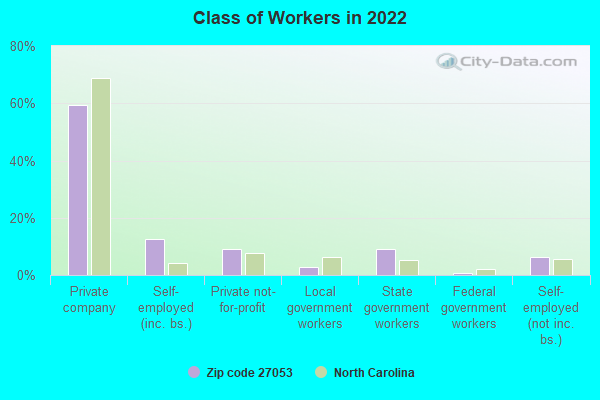
% of renters here:
13%
State:
33%
March 2022 cost of living index in zip code 27053: 79.9 (low, U.S. average is 100)
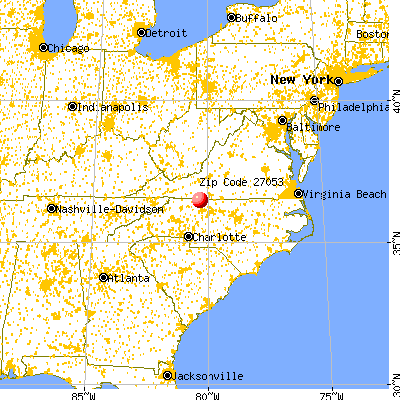
Land area: 67.6 sq. mi. Water area: 0.4 sq. mi.
Population density: 46 people per square mile
(very low).
OSM Map
General Map
Google Map
MSN Map
OSM Map
General Map
Google Map
MSN Map
OSM Map
General Map
Google Map
MSN Map
OSM Map
General Map
Google Map
MSN Map
Please wait while loading the map...
Real estate property taxes paid for housing units in 2022:
This zip code:
0.5% ($1,027)
North Carolina:
0.6% ($1,769)
Median real estate property taxes paid for housing units with mortgages in 2022: $1,330 (0.5%) Median real estate property taxes paid for housing units with no mortgage in 2022: $813 (0.4%)
Business Search- 14 Million verified businesses
Males: 1,670
(54.1%)
Females: 1,419
(45.9%)
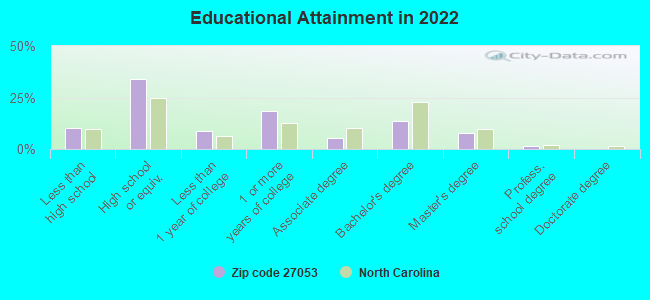
For population 25 years and over in 27053:
High school or higher: 87.8%
Bachelor's degree or higher: 22.9%
Graduate or professional degree: 9.4%
Unemployed: 6.8%
Mean travel time to work (commute): 31.8 minutes
For population 15 years and over in 27053:
Never married: 23.3%
Now married: 53.3%
Separated: 0.2%
Widowed: 8.4%
Divorced: 14.8%
Zip code 27053 compared to state average:
Unemployed percentage above state average.
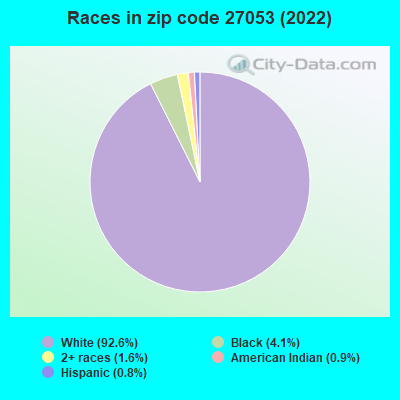
Black race population percentage significantly below state average.
Hispanic race population percentage significantly below state average.
Median age significantly above state average.
Foreign-born population percentage significantly below state average.
Renting percentage significantly below state average.
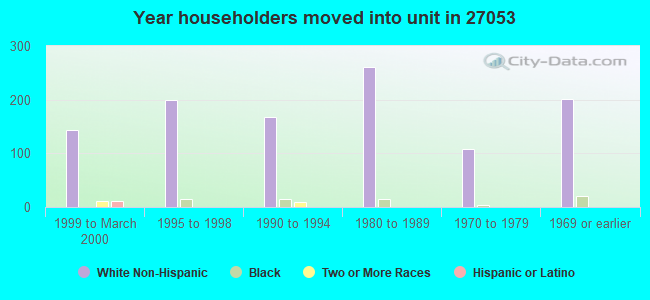
Length of stay since moving in significantly above state average.
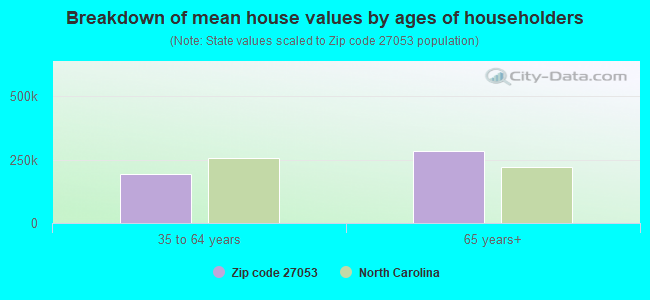
Estimated median house/condo value in 2022: $220,514
27053:
$220,514
North Carolina:
$280,600
According to our research of North Carolina and other state lists, there were 5 registered sex offenders living in 27053 zip code as of April 27, 2024. The ratio of all residents to sex offenders in zip code 27053 is 570 to 1. The ratio of registered sex offenders to all residents in this zip code is near the state average.
Median resident age:
This zip code:
55.9 years
North Carolina median age:
39.2 years
Average household size:
This zip code:
2.0 people
North Carolina:
2.4 people
Averages for the 2020 tax year for zip code 27053, filed in 2021:
Average Adjusted Gross Income (AGI) in 2020: $53,159 (Individual Income Tax Returns)
Here:
$53,159
State:
$70,020
Salary/wage: $46,963 (reported on 77.4% of returns)
Here:
$46,963
State:
$58,387
(% of AGI for various income ranges: 1222.4% for AGIs below $25k, 3609.6% for AGIs $25k-50k, 6490.0% for AGIs $50k-75k, 9600.0% for AGIs $75k-100k, 16198.8% for AGIs $100k-200k)
Taxable interest for individuals: $885 (reported on 33.6% of returns)
This zip code:
$885
North Carolina:
$1,479
(% of AGI for various income ranges: 28.8% for AGIs below $25k, 25.9% for AGIs $25k-50k, 46.2% for AGIs $50k-75k, 101.1% for AGIs $75k-100k, 96.2% for AGIs $100k-200k)
Ordinary dividends: $4,300 (reported on 15.3% of returns)
Here:
$4,300
State:
$7,888
(% of AGI for various income ranges: 43.0% for AGIs below $25k, 24.1% for AGIs $25k-50k, 41.9% for AGIs $50k-75k, 358.9% for AGIs $75k-100k, 382.5% for AGIs $100k-200k)
Net capital gain/loss in AGI: +$11,276 (reported on 12.4% of returns)
Here:
+$11,276
State:
+$23,652
(% of AGI for various income ranges: 15.2% for AGIs below $25k, 19.6% for AGIs $25k-50k, 103.8% for AGIs $50k-75k, 337.8% for AGIs $75k-100k, 1680.0% for AGIs $100k-200k)
Profit/loss from business: +$8,362 (reported on 15.3% of returns)
Here:
+$8,362
State:
+$11,710
(% of AGI for various income ranges: 132.7% for AGIs below $25k, 222.2% for AGIs $25k-50k, 290.0% for AGIs $75k-100k, 721.2% for AGIs $100k-200k)
Taxable individual retirement arrangement distribution: $13,414 (reported on 10.2% of returns)
27053:
$13,414
North Carolina:
$20,247
(% of AGI for various income ranges: 72.7% for AGIs below $25k, 91.5% for AGIs $25k-50k, 227.5% for AGIs $50k-75k, 1141.1% for AGIs $75k-100k)
Total itemized deductions: $31,000 (reported on 2.9% of returns)
Here:
$31,000
State:
$34,549
(% of AGI for various income ranges: 1550.0% for AGIs $100k-200k)
Charity contributions: $9,825 (reported on 2.9% of returns)
Here:
$9,825
State:
$13,360
(% of AGI for various income ranges: 436.7% for AGIs $75k-100k)
Taxes paid: $7,025 (reported on 2.9% of returns)
27053:
$7,025
State:
$7,586
(% of AGI for various income ranges: 351.2% for AGIs $100k-200k)
Earned income credit: $2,257 (reported on 16.8% of returns)
Here:
$2,257
State:
$2,337
(% of AGI for various income ranges: 92.1% for AGIs below $25k, 79.6% for AGIs $25k-50k)
Percentage of individuals using paid preparers for their 2020 taxes: 90.5%
Here:
91%
State:
93%
(% for various income ranges: 89.8% for AGIs below $25k, 88.6% for AGIs $25k-50k, 90.9% for AGIs $50k-75k, 100.0% for AGIs $75k-100k, 92.9% for AGIs $100k-200k, 66.7% for AGIs over 200k)
Averages for the 2012 tax year for zip code 27053, filed in 2013:
Average Adjusted Gross Income (AGI) in 2012: $42,740 (Individual Income Tax Returns)
Here:
$42,740
State:
$54,937
Salary/wage: $37,442 (reported on 79.8% of returns)
Here:
$37,442
State:
$46,336
(% of AGI for various income ranges: 65.7% for AGIs below $25k, 75.2% for AGIs $25k-50k, 75.7% for AGIs $50k-75k, 67.7% for AGIs $75k-100k, 63.9% for AGIs $100k-200k)
Taxable interest for individuals: $935 (reported on 38.0% of returns)
This zip code:
$935
North Carolina:
$1,298
(% of AGI for various income ranges: 1.2% for AGIs below $25k, 0.9% for AGIs $25k-50k, 0.8% for AGIs $50k-75k, 1.0% for AGIs $75k-100k, 0.6% for AGIs $100k-200k)
Ordinary dividends: $3,845 (reported on 15.5% of returns)
Here:
$3,845
State:
$6,213
(% of AGI for various income ranges: 2.0% for AGIs below $25k, 1.3% for AGIs $25k-50k, 0.3% for AGIs $50k-75k, 2.6% for AGIs $75k-100k, 1.3% for AGIs $100k-200k)
Net capital gain/loss in AGI: +$5,676 (reported on 16.3% of returns)
Here:
+$5,676
State:
+$12,740
(% of AGI for various income ranges: 2.1% for AGIs below $25k, 0.6% for AGIs $25k-50k, 1.5% for AGIs $50k-75k, 1.0% for AGIs $75k-100k, 5.1% for AGIs $100k-200k)
Profit/loss from business: +$5,494 (reported on 14.0% of returns)
Here:
+$5,494
State:
+$10,311
(% of AGI for various income ranges: 7.4% for AGIs below $25k, 3.2% for AGIs $25k-50k, 1.6% for AGIs $75k-100k)
Taxable individual retirement arrangement distribution: $9,688 (reported on 12.4% of returns)
27053:
$9,688
North Carolina:
$15,575
(% of AGI for various income ranges: 4.4% for AGIs below $25k, 2.9% for AGIs $25k-50k, 2.8% for AGIs $50k-75k, 5.4% for AGIs $75k-100k)
Total itemized deductions: $17,764 (23% of AGI, reported on 25.6% of returns)
Here:
$17,764
State:
$23,438
Here:
22.7% of AGI
State:
21.5% of AGI
(% of AGI for various income ranges: 6.8% for AGIs below $25k, 9.3% for AGIs $25k-50k, 11.4% for AGIs $50k-75k, 12.0% for AGIs $75k-100k, 12.0% for AGIs $100k-200k)
Charity contributions: $2,952 (reported on 20.9% of returns)
Here:
$2,952
State:
$4,687
(% of AGI for various income ranges: 0.8% for AGIs below $25k, 1.2% for AGIs $25k-50k, 1.4% for AGIs $50k-75k, 1.8% for AGIs $75k-100k, 1.7% for AGIs $100k-200k)
Taxes paid: $5,494 (reported on 25.6% of returns)
27053:
$5,494
State:
$8,823
(% of AGI for various income ranges: 1.2% for AGIs below $25k, 2.0% for AGIs $25k-50k, 3.1% for AGIs $50k-75k, 4.1% for AGIs $75k-100k, 4.9% for AGIs $100k-200k)
Earned income credit: $2,193 (reported on 20.9% of returns)
Here:
$2,193
State:
$2,376
(% of AGI for various income ranges: 6.9% for AGIs below $25k, 1.1% for AGIs $25k-50k)
Percentage of individuals using paid preparers for their 2012 taxes: 59.7%
Here:
60%
State:
53%
(% for various income ranges: 56.4% for AGIs below $25k, 59.4% for AGIs $25k-50k, 61.9% for AGIs $50k-75k, 66.7% for AGIs $75k-100k, 66.7% for AGIs $100k-200k)
Averages for the 2004 tax year for zip code 27053, filed in 2005:
Average Adjusted Gross Income (AGI) in 2004: $35,811 (Individual Income Tax Returns)
Here:
$35,811
State:
$45,376
Salary/wage: $34,455 (reported on 84.7% of returns)
Here:
$34,455
State:
$39,442
(% of AGI for various income ranges: 80.4% for AGIs below $10k, 76.5% for AGIs $10k-25k, 76.5% for AGIs $25k-50k, 89.1% for AGIs $50k-75k, 84.7% for AGIs $75k-100k, 78.5% for AGIs over 100k)
Taxable interest for individuals: $910 (reported on 42.3% of returns)
This zip code:
$910
North Carolina:
$1,515
(% of AGI for various income ranges: 4.8% for AGIs below $10k, 2.0% for AGIs $10k-25k, 1.2% for AGIs $25k-50k, 0.8% for AGIs $50k-75k, 0.5% for AGIs $75k-100k, 0.5% for AGIs over 100k)
Taxable dividends: $1,378 (reported on 18.1% of returns)
Here:
$1,378
State:
$4,016
(% of AGI for various income ranges: 2.7% for AGIs below $10k, 1.0% for AGIs $10k-25k, 1.0% for AGIs $25k-50k, 0.4% for AGIs $50k-75k, 0.4% for AGIs $75k-100k, 0.3% for AGIs over 100k)
Net capital gain/loss: +$4,245 (reported on 12.3% of returns)
Here:
+$4,245
State:
+$11,152
(% of AGI for various income ranges: 0.6% for AGIs below $10k, 1.4% for AGIs $10k-25k, 0.6% for AGIs $25k-50k, 0.6% for AGIs $50k-75k, 0.8% for AGIs $75k-100k, 5.4% for AGIs over 100k)
Profit/loss from business: +$4,965 (reported on 15.4% of returns)
Here:
+$4,965
State:
+$9,490
(% of AGI for various income ranges: 11.0% for AGIs below $10k, 3.1% for AGIs $10k-25k, 3.7% for AGIs $25k-50k, 1.7% for AGIs $50k-75k, -0.1% for AGIs $75k-100k)
IRA payment deduction: $2,632 (reported on 1.5% of returns)
27053:
$2,632
North Carolina:
$2,967
Total itemized deductions: $15,030 (24% of AGI, reported on 26.2% of returns)
Here:
$15,030
State:
$19,464
Here:
23.5% of AGI
State:
22.7% of AGI
(% of AGI for various income ranges: 6.6% for AGIs $10k-25k, 10.9% for AGIs $25k-50k, 12.8% for AGIs $50k-75k, 12.3% for AGIs $75k-100k, 12.4% for AGIs over 100k)
Charity contributions deductions: $2,477 (4% of AGI, reported on 22.3% of returns)
Here:
$2,477
State:
$4,035
Here:
3.7% of AGI
State:
4.5% of AGI
(% of AGI for various income ranges: 0.5% for AGIs $10k-25k, 1.4% for AGIs $25k-50k, 2.1% for AGIs $50k-75k, 1.7% for AGIs $75k-100k, 1.7% for AGIs over 100k)
Total tax: $4,157 (reported on 72.5% of returns)
27053:
$4,157
State:
$7,257
(% of AGI for various income ranges: 3.3% for AGIs below $10k, 3.7% for AGIs $10k-25k, 6.2% for AGIs $25k-50k, 7.9% for AGIs $50k-75k, 10.0% for AGIs $75k-100k, 17.0% for AGIs over 100k)
Earned income credit: $1,733 (reported on 20.0% of returns)
Here:
$1,733
State:
$1,851
Percentage of individuals using paid preparers for their 2004 taxes: 70.3%
Here:
70%
State:
62%
(% for various income ranges: 63.9% for AGIs below $10k, 71.1% for AGIs $10k-25k, 73.4% for AGIs $25k-50k, 73.0% for AGIs $50k-75k, 67.1% for AGIs $75k-100k, 69.6% for AGIs over 100k)
Household received Food Stamps/SNAP in the past 12 months: 235 Household did not receive Food Stamps/SNAP in the past 12 months: 1,272
Women who did not have a birth in the past 12 months: 459 (262 now married, 198 unmarried)
Housing units in zip code 27053 with a mortgage: 544 (73 second mortgage, 77 both second mortgage and home equity loan) Median monthly owner costs for units with a mortgage: $1,308 Median monthly owner costs for units without a mortgage: $339
Residents with income below the poverty level in 2022:
This zip code:
12.5%
Whole state:
12.8%
Residents with income below 50% of the poverty level in 2022:
This zip code:
6.4%
Whole state:
6.8%
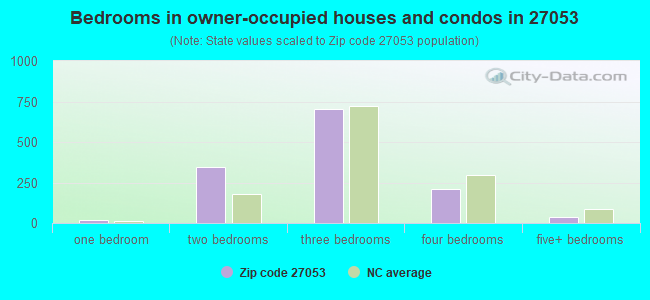
Median number of rooms in houses and condos:
Here:
5.8
State:
6.4
Median number of rooms in apartments:
Here:
4.2
State:
4.4
Notable locations in this zip code not listed on our city pages
Churches in zip code 27053 include: Kings Mountain View Church (A), Asbury Church (B), Trinity Church (C), Locust Grove Church (D), Big Creek Primitive Baptist Church (E), Francisco Presbyterian Church (F), Brown Mountain Missionary Baptist Church (G), Westfield Baptist Church (H), Collinstown Presbyterian Church (I). Display/hide their locations on the map
Cemeteries: Tucker Cemetery (1), Beasley Cemetery (2), Vaden Cemetery (3), Durham Cemetery (4), Bondurant Cemetery (5), Martin Cemetery (6), Forest Cemetery (7). Display/hide their locations on the map
Streams, rivers, and creeks: Elk Creek (A), Cascade Creek (B), Big Creek (C), Beaverdam Creek (D), Vade Mecum Creek (E), South Double Creek (F), Rocky Branch (G), Pinch Gut Creek (H), North Double Creek (I). Display/hide their locations on the map
In group quarters: 10 (-1 institutionalized population)
Size of family households: 387 2-persons, 362 3-persons, 59 4-persons, 67 6-persons
Size of nonfamily households: 524 1-person, 101 2-persons, 5 3-persons
365 married couples with children.
0 single-parent households ().
99.8% of residents of 27053 zip code speak English at home.
0.2% of residents speak Spanish at home (40% not well, 60% not at all).
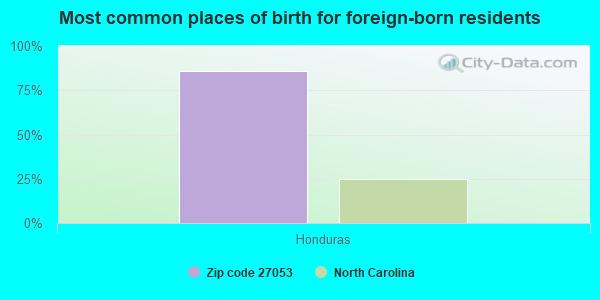
Foreign born population: 7 (0.2%) (0.0% of them are naturalized citizens)
:
0.2%
Whole state:
8.6%
86%Honduras
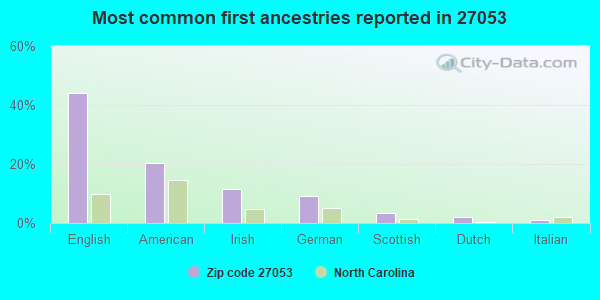
44%English
20%American
12%Irish
9%German
3%Scottish
2%Dutch
1%Italian
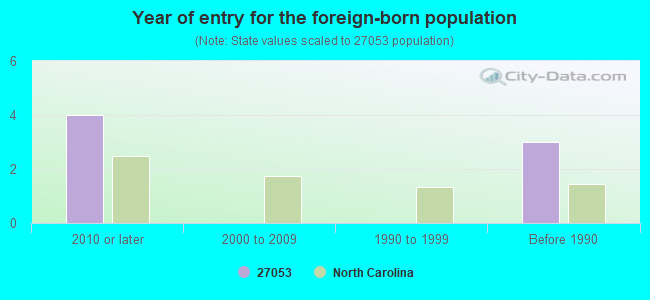
Year of entry for the foreign-born population
42010 or later
02000 to 2009
01990 to 1999
3Before 1990
Facilities with environmental interests located in this zip code:
BROWN, JOSEPH P. - RESIDENCE (NC HIGHWAY 704 in W FIELD, NC)
STATE MASTER (North Carolina facility info) - -115DA4YG00M69W84AY3WREP2GR, WASTEWATER FACILITY National Pollutant Discharge Elimination System NON-MAJOR (Tracking pollutant discharge elimination systems) - permit Business SIC classification: SEWERAGE SYSTEMS
CAROLINA ROSE QUARRY (1093 TOM E RD in WESTFIELD, NC)
National Pollutant Discharge Elimination System NON-MAJOR (Tracking pollutant discharge elimination systems) - permit Business SIC classification: DIMENSION STONE Alternative names: APPALACHIAN STONE CO INC CAR R
Housing units lacking complete plumbing facilities: 4.6% Housing units lacking complete kitchen facilities: 2.0%
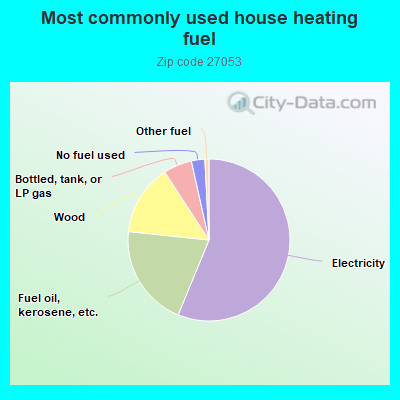
56.4%Electricity
20.5%Fuel oil, kerosene, etc.
14.2%Wood
5.7%Bottled, tank, or LP gas
2.7%No fuel used
0.8%Other fuel
Population in 1990: 3,500.
Place of birth for U.S.-born residents:
This state: 2,253
Northeast: 256
Midwest: 133
South: 403
West: 3
76% of the 27053 zip code residents lived in the same house 5 years ago. Out of people who lived in different houses, 27% lived in this county. Out of people who lived in different counties, 50% lived in North Carolina.
100% of the 27053 zip code residents lived in the same house 1 year ago. Out of people who lived in different houses, 1000% moved from this county. Out of people who lived in different houses, 50% moved from abroad.
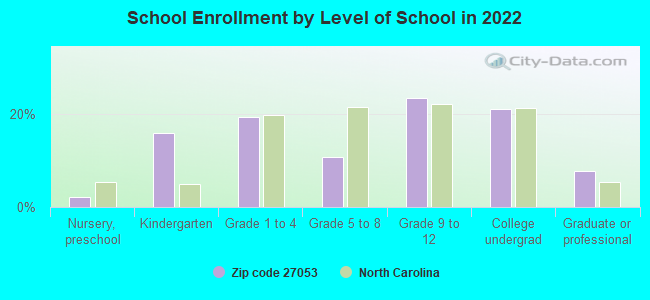
Private vs. public school enrollment:
Students in private schools in grades 1 to 8 (elementary and middle school): 65
Here:
41.0%
North Carolina:
13.8%
Students in private schools in grades 9 to 12 (high school): 4
Here:
3.8%
North Carolina:
11.9%
Students in private undergraduate colleges:
Here:
0.0%
North Carolina:
19.3%
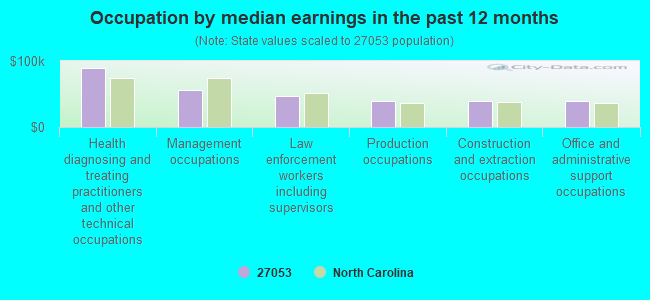
Occupation by median earnings in the past 12 months ($)
89,632Health diagnosing and treating practitioners and other technical occupations
55,914Management occupations
47,455Law enforcement workers including supervisors
40,044Production occupations
39,438Construction and extraction occupations
38,780Office and administrative support occupations
Top industries in this zip code by the number of employees in 2005:
Health Care and Social Assistance: Homes for the Elderly (20-49 employees: 1 establishment)
Construction: Other Building Equipment Contractors (20-49: 1)
Accommodation and Food Services: Full-Service Restaurants (10-19: 1)
Other Services (except Public Administration): Religious Organizations (1-4: 2)
Wholesale Trade: Wholesale Trade Agents and Brokers (1-4: 2)
Health Care and Social Assistance: Offices of All Other Miscellaneous Health Practitioners (1-4: 1)
Real Estate and Rental and Leasing: Offices of Real Estate Agents and Brokers (1-4: 1)
People in group quarters in 2010:
3 people in workers' group living quarters and job corps centers
Fatal accident statistics in 2013:
Fatal accident count: 2
Vehicles involved in fatal accidents: 2
Fatal accidents caused by drunken drivers: 0
Fatalities: 2
Persons involved in fatal accidents: 4
Pedestrians involved in fatal accidents: 0
Fatal accident statistics in 2012:
Fatal accident count: 1
Vehicles involved in fatal accidents: 1
Fatal accidents caused by drunken drivers: 1
Fatalities: 1
Persons involved in fatal accidents: 1
Pedestrians involved in fatal accidents: 0
Home Mortgage Disclosure Act Aggregated Statistics For Year 2009 (Based on 2 partial tracts)
A) FHA, FSA/RHS & VA Home Purchase Loans
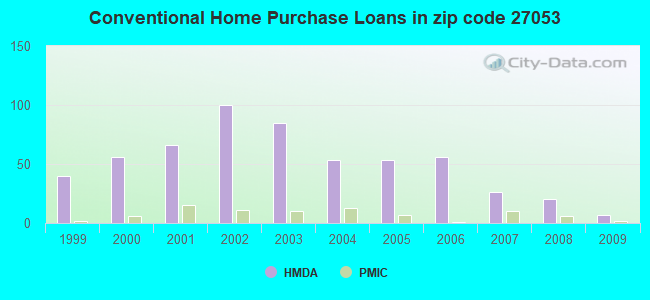
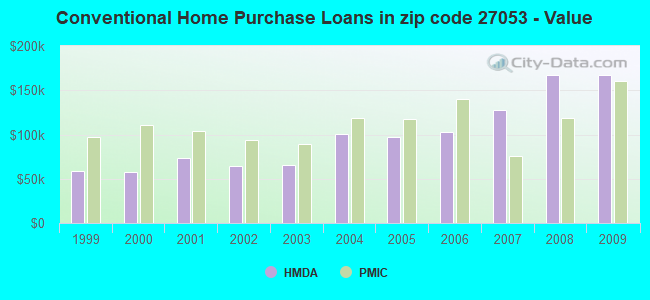
B) Conventional Home Purchase Loans
C) Refinancings
D) Home Improvement Loans
F) Non-occupant Loans on < 5 Family Dwellings (A B C & D)
G) Loans On Manufactured Home Dwelling (A B C & D)
Number
Average Value
Number
Average Value
Number
Average Value
Number
Average Value
Number
Average Value
Number
Average Value
LOANS ORIGINATED
11
$75,825
7
$167,479
64
$147,918
5
$43,964
6
$214,117
12
$78,971
APPLICATIONS APPROVED, NOT ACCEPTED
0
$0
2
$131,890
12
$142,168
0
$0
1
$487,260
2
$51,900
APPLICATIONS DENIED
10
$99,528
5
$148,254
55
$120,721
5
$39,322
4
$180,738
18
$68,727
APPLICATIONS WITHDRAWN
2
$117,235
4
$94,338
20
$142,270
2
$39,690
0
$0
4
$72,968
FILES CLOSED FOR INCOMPLETENESS
0
$0
2
$176,465
4
$131,280
0
$0
0
$0
1
$140,440
Aggregated Statistics For Year 2008 (Based on 2 partial tracts)
A) FHA, FSA/RHS & VA Home Purchase Loans
B) Conventional Home Purchase Loans
C) Refinancings
D) Home Improvement Loans
F) Non-occupant Loans on < 5 Family Dwellings (A B C & D)
G) Loans On Manufactured Home Dwelling (A B C & D)
Number
Average Value
Number
Average Value
Number
Average Value
Number
Average Value
Number
Average Value
Number
Average Value
LOANS ORIGINATED
16
$98,994
20
$166,694
62
$126,965
6
$56,990
10
$200,643
16
$71,669
APPLICATIONS APPROVED, NOT ACCEPTED
1
$69,610
1
$238,130
11
$176,075
2
$12,825
1
$488,480
1
$117,240
APPLICATIONS DENIED
5
$90,858
11
$96,919
54
$132,772
6
$74,087
4
$130,058
17
$86,634
APPLICATIONS WITHDRAWN
4
$60,450
1
$75,710
21
$178,935
0
$0
1
$75,710
1
$72,050
FILES CLOSED FOR INCOMPLETENESS
1
$106,240
1
$79,380
7
$85,659
1
$6,110
0
$0
1
$140,440
Aggregated Statistics For Year 2007 (Based on 2 partial tracts)
A) FHA, FSA/RHS & VA Home Purchase Loans
B) Conventional Home Purchase Loans
C) Refinancings
D) Home Improvement Loans
F) Non-occupant Loans on < 5 Family Dwellings (A B C & D)
G) Loans On Manufactured Home Dwelling (A B C & D)
Number
Average Value
Number
Average Value
Number
Average Value
Number
Average Value
Number
Average Value
Number
Average Value
LOANS ORIGINATED
4
$81,515
26
$127,568
62
$107,544
15
$36,473
7
$134,681
27
$77,931
APPLICATIONS APPROVED, NOT ACCEPTED
1
$111,130
5
$146,300
18
$140,845
1
$19,540
1
$267,440
2
$70,830
APPLICATIONS DENIED
6
$96,475
13
$86,329
85
$110,669
16
$54,725
0
$0
34
$79,522
APPLICATIONS WITHDRAWN
2
$134,945
2
$172,800
27
$123,206
4
$57,090
0
$0
2
$161,200
FILES CLOSED FOR INCOMPLETENESS
0
$0
1
$244,240
1
$87,930
2
$91,590
0
$0
0
$0
Aggregated Statistics For Year 2006 (Based on 2 partial tracts)
A) FHA, FSA/RHS & VA Home Purchase Loans
B) Conventional Home Purchase Loans
C) Refinancings
D) Home Improvement Loans
F) Non-occupant Loans on < 5 Family Dwellings (A B C & D)
G) Loans On Manufactured Home Dwelling (A B C & D)
Number
Average Value
Number
Average Value
Number
Average Value
Number
Average Value
Number
Average Value
Number
Average Value
LOANS ORIGINATED
6
$105,837
56
$102,712
89
$101,346
13
$53,733
17
$119,893
31
$78,669
APPLICATIONS APPROVED, NOT ACCEPTED
2
$89,760
11
$98,362
18
$110,518
1
$21,980
0
$0
10
$69,608
APPLICATIONS DENIED
1
$108,690
24
$97,594
83
$97,725
16
$30,988
4
$116,320
23
$72,157
APPLICATIONS WITHDRAWN
4
$98,918
6
$110,722
21
$96,708
2
$69,610
2
$117,235
5
$100,138
FILES CLOSED FOR INCOMPLETENESS
0
$0
0
$0
12
$187,149
0
$0
0
$0
0
$0
Aggregated Statistics For Year 2005 (Based on 2 partial tracts)
A) FHA, FSA/RHS & VA Home Purchase Loans
B) Conventional Home Purchase Loans
C) Refinancings
D) Home Improvement Loans
F) Non-occupant Loans on < 5 Family Dwellings (A B C & D)
G) Loans On Manufactured Home Dwelling (A B C & D)
Number
Average Value
Number
Average Value
Number
Average Value
Number
Average Value
Number
Average Value
Number
Average Value
LOANS ORIGINATED
4
$84,872
53
$97,373
88
$103,871
7
$46,231
11
$105,800
39
$66,884
APPLICATIONS APPROVED, NOT ACCEPTED
4
$92,200
18
$67,641
22
$106,078
1
$36,640
2
$141,050
15
$59,025
APPLICATIONS DENIED
4
$65,335
28
$66,512
96
$91,959
13
$58,336
4
$49,765
45
$73,435
APPLICATIONS WITHDRAWN
1
$188,060
10
$71,562
32
$100,863
1
$34,190
4
$62,892
16
$77,164
FILES CLOSED FOR INCOMPLETENESS
1
$75,710
4
$98,002
10
$127,371
0
$0
0
$0
2
$74,495
Aggregated Statistics For Year 2004 (Based on 2 partial tracts)
A) FHA, FSA/RHS & VA Home Purchase Loans
B) Conventional Home Purchase Loans
C) Refinancings
D) Home Improvement Loans
F) Non-occupant Loans on < 5 Family Dwellings (A B C & D)
G) Loans On Manufactured Home Dwelling (A B C & D)
Number
Average Value
Number
Average Value
Number
Average Value
Number
Average Value
Number
Average Value
Number
Average Value
LOANS ORIGINATED
11
$93,922
53
$100,346
90
$89,568
12
$30,937
10
$52,145
33
$62,503
APPLICATIONS APPROVED, NOT ACCEPTED
1
$42,740
13
$63,972
24
$65,385
2
$18,320
1
$116,010
12
$40,402
APPLICATIONS DENIED
0
$0
20
$58,190
96
$92,989
4
$27,478
2
$276,600
34
$64,903
APPLICATIONS WITHDRAWN
0
$0
6
$77,953
27
$114,295
0
$0
1
$52,510
6
$80,600
FILES CLOSED FOR INCOMPLETENESS
1
$119,680
0
$0
15
$92,404
0
$0
0
$0
4
$78,768
Aggregated Statistics For Year 2003 (Based on 2 partial tracts)
A) FHA, FSA/RHS & VA Home Purchase Loans
B) Conventional Home Purchase Loans
C) Refinancings
D) Home Improvement Loans
F) Non-occupant Loans on < 5 Family Dwellings (A B C & D)
Number
Average Value
Number
Average Value
Number
Average Value
Number
Average Value
Number
Average Value
LOANS ORIGINATED
7
$72,749
85
$65,241
158
$100,795
7
$31,227
17
$80,025
APPLICATIONS APPROVED, NOT ACCEPTED
0
$0
73
$54,770
29
$81,273
2
$14,045
2
$70,830
APPLICATIONS DENIED
9
$74,900
176
$51,811
93
$82,280
6
$48,442
13
$50,633
APPLICATIONS WITHDRAWN
0
$0
9
$170,561
28
$99,092
2
$33,585
5
$250,834
FILES CLOSED FOR INCOMPLETENESS
1
$53,730
2
$120,290
5
$89,392
0
$0
1
$83,040
Aggregated Statistics For Year 2002 (Based on 2 partial tracts)
A) FHA, FSA/RHS & VA Home Purchase Loans
B) Conventional Home Purchase Loans
C) Refinancings
D) Home Improvement Loans
F) Non-occupant Loans on < 5 Family Dwellings (A B C & D)
Number
Average Value
Number
Average Value
Number
Average Value
Number
Average Value
Number
Average Value
LOANS ORIGINATED
5
$103,802
100
$64,357
117
$91,841
6
$9,363
15
$67,655
APPLICATIONS APPROVED, NOT ACCEPTED
4
$26,255
48
$41,801
40
$70,494
2
$44,575
2
$161,200
APPLICATIONS DENIED
6
$32,565
160
$44,032
65
$67,786
10
$24,912
5
$61,304
APPLICATIONS WITHDRAWN
0
$0
9
$94,711
28
$91,764
2
$33,585
0
$0
FILES CLOSED FOR INCOMPLETENESS
0
$0
1
$183,180
4
$93,422
0
$0
0
$0
Aggregated Statistics For Year 2001 (Based on 2 partial tracts)
A) FHA, FSA/RHS & VA Home Purchase Loans
B) Conventional Home Purchase Loans
C) Refinancings
D) Home Improvement Loans
F) Non-occupant Loans on < 5 Family Dwellings (A B C & D)
Number
Average Value
Number
Average Value
Number
Average Value
Number
Average Value
Number
Average Value
LOANS ORIGINATED
12
$97,391
66
$73,513
103
$89,871
9
$24,152
10
$75,470
APPLICATIONS APPROVED, NOT ACCEPTED
0
$0
29
$60,428
22
$95,642
2
$15,875
1
$109,910
APPLICATIONS DENIED
0
$0
45
$50,829
60
$77,180
11
$5,218
5
$53,978
APPLICATIONS WITHDRAWN
1
$124,560
9
$67,844
18
$79,514
2
$29,920
0
$0
FILES CLOSED FOR INCOMPLETENESS
0
$0
2
$92,810
6
$105,430
0
$0
1
$39,080
Aggregated Statistics For Year 2000 (Based on 2 partial tracts)
A) FHA, FSA/RHS & VA Home Purchase Loans
B) Conventional Home Purchase Loans
C) Refinancings
D) Home Improvement Loans
F) Non-occupant Loans on < 5 Family Dwellings (A B C & D)
Number
Average Value
Number
Average Value
Number
Average Value
Number
Average Value
Number
Average Value
LOANS ORIGINATED
9
$82,770
56
$57,266
43
$73,727
17
$10,560
7
$35,066
APPLICATIONS APPROVED, NOT ACCEPTED
5
$40,056
23
$49,963
12
$47,830
1
$6,110
2
$38,470
APPLICATIONS DENIED
6
$47,017
59
$49,034
54
$90,663
5
$21,982
5
$48,360
APPLICATIONS WITHDRAWN
4
$57,398
4
$81,210
17
$63,574
2
$18,320
2
$87,925
FILES CLOSED FOR INCOMPLETENESS
0
$0
5
$78,402
5
$62,036
0
$0
0
$0
Aggregated Statistics For Year 1999 (Based on 1 partial tract)
A) FHA, FSA/RHS & VA Home Purchase Loans
B) Conventional Home Purchase Loans
C) Refinancings
D) Home Improvement Loans
F) Non-occupant Loans on < 5 Family Dwellings (A B C & D)
Detailed PMIC statistics for the following Tracts:0703.00
2002 - 2018 National Fire Incident Reporting System (NFIRS) incidents
According to the data from the years 2002 - 2018 the average number of fires per year is 36. The highest number of reported fires - 53 took place in 2010, and the least - 16 in 2012. The data has a declining trend.
When looking into fire subcategories, the most reports belonged to: Structure Fires (44.9%), and Outside Fires (35.8%).
Fire incident types reported to NFIRS in Zip Code 27053


 Nearest zip codes: 27016, 27022, 27041, 24076, 27021, 27043.


 According to the data from the years 2002 - 2018 the average number of fires per year is 36. The highest number of reported fires - 53 took place in 2010, and the least - 16 in 2012. The data has a declining trend.
 When looking into fire subcategories, the most reports belonged to: Structure Fires (44.9%), and Outside Fires (35.8%).