Estimated zip code population in 2022: 21,286 Zip code population in 2010: 18,901 Zip code population in 2000: 19,708
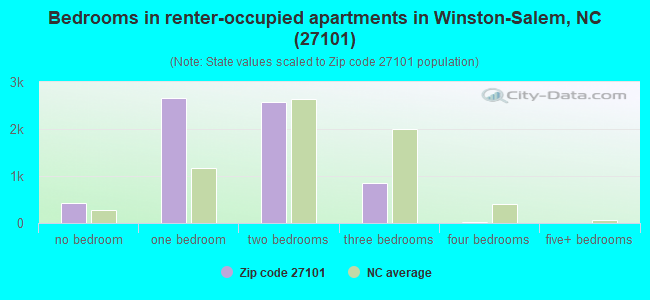
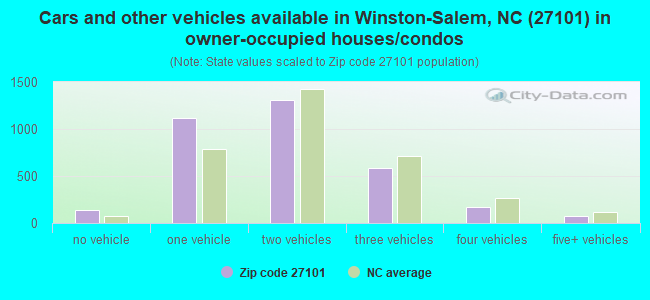
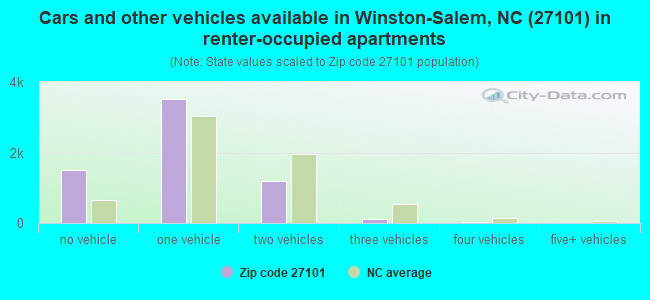
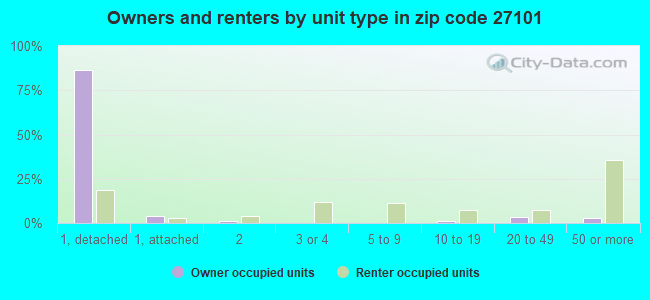
Houses and condos: 11,798 Renter-occupied apartments: 6,509
% of renters here:
66%
State:
33%
March 2022 cost of living index in zip code 27101: 89.6 (less than average, U.S. average is 100)
Land area: 12.8 sq. mi. Water area: 0.3 sq. mi.
Population density: 1,668 people per square mile
(low).
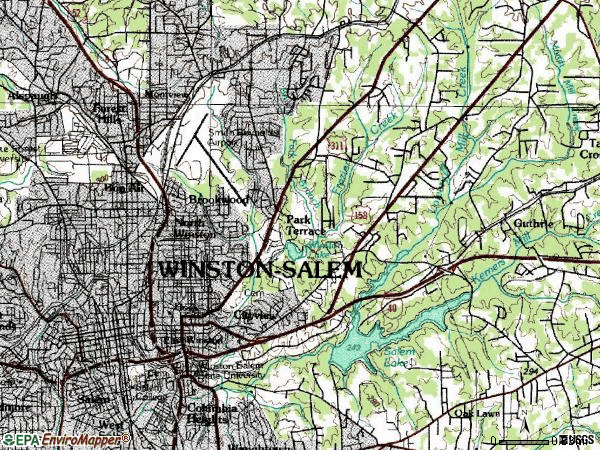
OSM Map
General Map
Google Map
MSN Map
OSM Map
General Map
Google Map
MSN Map
OSM Map
General Map
Google Map
MSN Map
OSM Map
General Map
Google Map
MSN Map
Please wait while loading the map...
Real estate property taxes paid for housing units in 2022:
This zip code:
0.7% ($1,589)
North Carolina:
0.6% ($1,769)
Median real estate property taxes paid for housing units with mortgages in 2022: $1,753 (0.7%) Median real estate property taxes paid for housing units with no mortgage in 2022: $1,357 (0.6%)
Averages for the 2020 tax year for zip code 27101, filed in 2021:
Average Adjusted Gross Income (AGI) in 2020: $54,440 (Individual Income Tax Returns)
Here:
$54,440
State:
$70,020
Salary/wage: $44,982 (reported on 86.5% of returns)
Here:
$44,982
State:
$58,387
(% of AGI for various income ranges: 1190.8% for AGIs below $25k, 3804.5% for AGIs $25k-50k, 7275.4% for AGIs $50k-75k, 10916.6% for AGIs $75k-100k, 19400.5% for AGIs $100k-200k, 93596.2% for AGIs over 200k)
Taxable interest for individuals: $1,412 (reported on 20.4% of returns)
This zip code:
$1,412
North Carolina:
$1,479
(% of AGI for various income ranges: 4.2% for AGIs below $25k, 6.3% for AGIs $25k-50k, 26.6% for AGIs $50k-75k, 74.9% for AGIs $75k-100k, 176.7% for AGIs $100k-200k, 1565.0% for AGIs over 200k)
Ordinary dividends: $9,013 (reported on 14.0% of returns)
Here:
$9,013
State:
$7,888
(% of AGI for various income ranges: 9.1% for AGIs below $25k, 31.5% for AGIs $25k-50k, 92.2% for AGIs $50k-75k, 235.7% for AGIs $75k-100k, 527.7% for AGIs $100k-200k, 9052.5% for AGIs over 200k)
Net capital gain/loss in AGI: +$31,489 (reported on 13.2% of returns)
Here:
+$31,489
State:
+$23,652
(% of AGI for various income ranges: 4.3% for AGIs below $25k, 30.7% for AGIs $25k-50k, 136.5% for AGIs $50k-75k, 182.3% for AGIs $75k-100k, 853.8% for AGIs $100k-200k, 41110.0% for AGIs over 200k)
Profit/loss from business: +$10,495 (reported on 15.6% of returns)
Here:
+$10,495
State:
+$11,710
(% of AGI for various income ranges: 120.3% for AGIs below $25k, 124.5% for AGIs $25k-50k, 166.6% for AGIs $50k-75k, 237.1% for AGIs $75k-100k, 789.7% for AGIs $100k-200k, 4647.5% for AGIs over 200k)
Taxable individual retirement arrangement distribution: $21,579 (reported on 5.0% of returns)
27101:
$21,579
North Carolina:
$20,247
(% of AGI for various income ranges: 18.4% for AGIs below $25k, 49.1% for AGIs $25k-50k, 132.0% for AGIs $50k-75k, 336.6% for AGIs $75k-100k, 588.7% for AGIs $100k-200k, 5015.0% for AGIs over 200k)
Self-employed (Keogh) retirement plans: $27,300 (reported on 0.3% of returns)
27101:
$27,300
North Carolina:
$26,749
(% of AGI for various income ranges: 1023.8% for AGIs over 200k)
Total itemized deductions: $53,038 (reported on 6.2% of returns)
Here:
$53,038
State:
$34,549
(% of AGI for various income ranges: 23.6% for AGIs below $25k, 69.8% for AGIs $25k-50k, 251.2% for AGIs $50k-75k, 699.4% for AGIs $75k-100k, 1302.8% for AGIs $100k-200k, 23768.8% for AGIs over 200k)
Charity contributions: $23,971 (reported on 5.5% of returns)
Here:
$23,971
State:
$13,360
(% of AGI for various income ranges: 2.5% for AGIs below $25k, 15.2% for AGIs $25k-50k, 55.0% for AGIs $50k-75k, 206.6% for AGIs $75k-100k, 388.2% for AGIs $100k-200k, 11438.8% for AGIs over 200k)
Taxes paid: $7,321 (reported on 6.1% of returns)
27101:
$7,321
State:
$7,586
(% of AGI for various income ranges: 2.4% for AGIs below $25k, 11.7% for AGIs $25k-50k, 60.1% for AGIs $50k-75k, 141.7% for AGIs $75k-100k, 363.8% for AGIs $100k-200k, 1813.8% for AGIs over 200k)
Earned income credit: $2,266 (reported on 25.9% of returns)
Here:
$2,266
State:
$2,337
(% of AGI for various income ranges: 131.1% for AGIs below $25k, 65.7% for AGIs $25k-50k)
Percentage of individuals using paid preparers for their 2020 taxes: 93.5%
Here:
93%
State:
93%
(% for various income ranges: 92.9% for AGIs below $25k, 93.8% for AGIs $25k-50k, 92.5% for AGIs $50k-75k, 94.6% for AGIs $75k-100k, 94.6% for AGIs $100k-200k, 96.7% for AGIs over 200k)
Averages for the 2012 tax year for zip code 27101, filed in 2013:
Average Adjusted Gross Income (AGI) in 2012: $43,310 (Individual Income Tax Returns)
Here:
$43,310
State:
$54,937
Salary/wage: $36,111 (reported on 86.0% of returns)
Here:
$36,111
State:
$46,336
(% of AGI for various income ranges: 78.8% for AGIs below $25k, 84.2% for AGIs $25k-50k, 78.3% for AGIs $50k-75k, 78.3% for AGIs $75k-100k, 72.9% for AGIs $100k-200k, 48.1% for AGIs over 200k)
Taxable interest for individuals: $1,298 (reported on 22.4% of returns)
This zip code:
$1,298
North Carolina:
$1,298
(% of AGI for various income ranges: 0.5% for AGIs below $25k, 0.4% for AGIs $25k-50k, 0.4% for AGIs $50k-75k, 0.7% for AGIs $75k-100k, 0.5% for AGIs $100k-200k, 1.3% for AGIs over 200k)
Ordinary dividends: $10,319 (reported on 13.5% of returns)
Here:
$10,319
State:
$6,213
(% of AGI for various income ranges: 0.9% for AGIs below $25k, 0.8% for AGIs $25k-50k, 1.5% for AGIs $50k-75k, 1.1% for AGIs $75k-100k, 3.4% for AGIs $100k-200k, 8.7% for AGIs over 200k)
Net capital gain/loss in AGI: +$17,990 (reported on 10.4% of returns)
Here:
+$17,990
State:
+$12,740
(% of AGI for various income ranges: 0.1% for AGIs $25k-50k, 0.2% for AGIs $50k-75k, 1.0% for AGIs $75k-100k, 2.4% for AGIs $100k-200k, 16.3% for AGIs over 200k)
Profit/loss from business: +$11,778 (reported on 15.1% of returns)
Here:
+$11,778
State:
+$10,311
(% of AGI for various income ranges: 7.2% for AGIs below $25k, 1.7% for AGIs $25k-50k, 1.5% for AGIs $50k-75k, 1.9% for AGIs $75k-100k, 3.4% for AGIs $100k-200k, 7.4% for AGIs over 200k)
Taxable individual retirement arrangement distribution: $13,908 (reported on 6.2% of returns)
27101:
$13,908
North Carolina:
$15,575
(% of AGI for various income ranges: 1.1% for AGIs below $25k, 1.7% for AGIs $25k-50k, 2.5% for AGIs $50k-75k, 2.2% for AGIs $75k-100k, 3.2% for AGIs $100k-200k, 1.5% for AGIs over 200k)
Self-employment retirement plans: $22,933 (reported on 0.4% of returns)
27101:
$22,933
North Carolina:
$21,078
Total itemized deductions: $23,370 (23% of AGI, reported on 25.4% of returns)
Here:
$23,370
State:
$23,438
Here:
23.2% of AGI
State:
21.5% of AGI
(% of AGI for various income ranges: 6.6% for AGIs below $25k, 10.4% for AGIs $25k-50k, 14.2% for AGIs $50k-75k, 16.4% for AGIs $75k-100k, 17.2% for AGIs $100k-200k, 17.3% for AGIs over 200k)
Charity contributions: $5,470 (reported on 21.4% of returns)
Here:
$5,470
State:
$4,687
(% of AGI for various income ranges: 0.8% for AGIs below $25k, 1.7% for AGIs $25k-50k, 2.8% for AGIs $50k-75k, 3.6% for AGIs $75k-100k, 3.1% for AGIs $100k-200k, 4.1% for AGIs over 200k)
Taxes paid: $7,983 (reported on 25.2% of returns)
27101:
$7,983
State:
$8,823
(% of AGI for various income ranges: 0.9% for AGIs below $25k, 2.3% for AGIs $25k-50k, 4.0% for AGIs $50k-75k, 5.7% for AGIs $75k-100k, 7.1% for AGIs $100k-200k, 7.2% for AGIs over 200k)
Earned income credit: $2,297 (reported on 30.1% of returns)
Here:
$2,297
State:
$2,376
(% of AGI for various income ranges: 9.1% for AGIs below $25k, 1.1% for AGIs $25k-50k)
Percentage of individuals using paid preparers for their 2012 taxes: 47.2%
Here:
47%
State:
53%
(% for various income ranges: 45.0% for AGIs below $25k, 44.1% for AGIs $25k-50k, 51.3% for AGIs $50k-75k, 52.3% for AGIs $75k-100k, 57.1% for AGIs $100k-200k, 77.8% for AGIs over 200k)
Averages for the 2004 tax year for zip code 27101, filed in 2005:
Average Adjusted Gross Income (AGI) in 2004: $41,106 (Individual Income Tax Returns)
Here:
$41,106
State:
$45,376
Salary/wage: $29,430 (reported on 80.1% of returns)
Here:
$29,430
State:
$39,442
(% of AGI for various income ranges: 89.0% for AGIs below $10k, 80.8% for AGIs $10k-25k, 80.0% for AGIs $25k-50k, 67.8% for AGIs $50k-75k, 67.3% for AGIs $75k-100k, 31.5% for AGIs over 100k)
Taxable interest for individuals: $2,577 (reported on 32.5% of returns)
This zip code:
$2,577
North Carolina:
$1,515
(% of AGI for various income ranges: 2.6% for AGIs below $10k, 1.7% for AGIs $10k-25k, 1.6% for AGIs $25k-50k, 2.1% for AGIs $50k-75k, 2.5% for AGIs $75k-100k, 2.2% for AGIs over 100k)
Taxable dividends: $14,304 (reported on 22.4% of returns)
Here:
$14,304
State:
$4,016
(% of AGI for various income ranges: 11.5% for AGIs below $10k, 3.8% for AGIs $10k-25k, 3.3% for AGIs $25k-50k, 5.9% for AGIs $50k-75k, 6.0% for AGIs $75k-100k, 11.9% for AGIs over 100k)
Net capital gain/loss: +$22,415 (reported on 17.6% of returns)
Here:
+$22,415
State:
+$11,152
(% of AGI for various income ranges: -2.6% for AGIs below $10k, -0.6% for AGIs $10k-25k, 0.8% for AGIs $25k-50k, 3.8% for AGIs $50k-75k, 5.4% for AGIs $75k-100k, 20.6% for AGIs over 100k)
Profit/loss from business: +$10,789 (reported on 10.4% of returns)
Here:
+$10,789
State:
+$9,490
(% of AGI for various income ranges: 2.4% for AGIs below $10k, 2.3% for AGIs $10k-25k, 1.7% for AGIs $25k-50k, 1.9% for AGIs $50k-75k, 1.0% for AGIs $75k-100k, 4.0% for AGIs over 100k)
IRA payment deduction: $2,581 (reported on 1.2% of returns)
27101:
$2,581
North Carolina:
$2,967
(% of AGI for various income ranges: 0.0% for AGIs $10k-25k, 0.2% for AGIs $25k-50k, 0.1% for AGIs $50k-75k, 0.1% for AGIs $75k-100k, 0.0% for AGIs over 100k)
Self-employed pension: $17,094 (reported on 0.4% of returns)
Here:
$17,094
North Carolina:
$14,754
Total itemized deductions: $26,508 (30% of AGI, reported on 31.8% of returns)
Here:
$26,508
State:
$19,464
Here:
29.6% of AGI
State:
22.7% of AGI
(% of AGI for various income ranges: 41.4% for AGIs below $10k, 13.2% for AGIs $10k-25k, 18.3% for AGIs $25k-50k, 22.4% for AGIs $50k-75k, 25.2% for AGIs $75k-100k, 20.8% for AGIs over 100k)
Charity contributions deductions: $7,870 (8% of AGI, reported on 25.2% of returns)
Here:
$7,870
State:
$4,035
Here:
7.7% of AGI
State:
4.5% of AGI
(% of AGI for various income ranges: 0.8% for AGIs below $10k, 1.3% for AGIs $10k-25k, 2.7% for AGIs $25k-50k, 4.2% for AGIs $50k-75k, 4.8% for AGIs $75k-100k, 7.5% for AGIs over 100k)
Total tax: $7,424 (reported on 62.6% of returns)
27101:
$7,424
State:
$7,257
(% of AGI for various income ranges: 2.6% for AGIs below $10k, 3.4% for AGIs $10k-25k, 6.6% for AGIs $25k-50k, 8.9% for AGIs $50k-75k, 10.2% for AGIs $75k-100k, 17.7% for AGIs over 100k)
Earned income credit: $1,796 (reported on 28.4% of returns)
Here:
$1,796
State:
$1,851
Percentage of individuals using paid preparers for their 2004 taxes: 64.6%
Here:
65%
State:
62%
(% for various income ranges: 62.7% for AGIs below $10k, 66.1% for AGIs $10k-25k, 60.4% for AGIs $25k-50k, 65.8% for AGIs $50k-75k, 67.0% for AGIs $75k-100k, 78.0% for AGIs over 100k)
Likely homosexual households (counted as self-reported same-sex unmarried-partner households)
Lesbian couples: 0.0% of all households
Gay men: 0.2% of all households
Household received Food Stamps/SNAP in the past 12 months: 2,083 Household did not receive Food Stamps/SNAP in the past 12 months: 7,957
Women who had a birth in the past 12 months: 271 (52 now married, 208 unmarried) Women who did not have a birth in the past 12 months: 5,309 (1,141 now married, 4,144 unmarried)
Housing units in zip code 27101 with a mortgage: 2,138 (265 second mortgage, 249 both second mortgage and home equity loan) Houses without a mortgage: 91
Median monthly owner costs for units with a mortgage: $1,330 Median monthly owner costs for units without a mortgage: $431
Residents with income below the poverty level in 2022:
This zip code:
22.1%
Whole state:
12.8%
Residents with income below 50% of the poverty level in 2022:
This zip code:
12.3%
Whole state:
6.8%
Median number of rooms in houses and condos:
Here:
6.2
State:
6.4
Median number of rooms in apartments:
Here:
3.6
State:
4.4
Notable locations in this zip code not listed on our city pages
Notable locations in zip code 27101: East Winston Center (A), Old Salem (B), BB&T Ballpark (C), Miksch Tobacco Shop (D), Shultz Shoemaker Shop (E), Vierling House (F), Single Brothers House (G), Winkler Bakery (H), Market-Fire House (I), John Vogler House (J), Salem Tavern (K), Museum of Early Southern Decorative Arts (L), Benton Convention Center (M), Hiram H Ward Federal Building (N), Winston-Salem City Hall (O), Forsyth County Courthouse (P), YMCA (Q). Display/hide their locations on the map
Tourist attractions (not listed on the city page) : Children's Museum of Winston-Salem (301 South Liberty Street) (1), J Blum Printer & Merchant (Museums; 724 South Main Street) (2), Bethabara Historic (Historical Places & Services; Bethabara Road) (3), L & M Game Room (231 South Glenn Avenue) (4), Brads RV's (3041 Fleet Street) (5), City-County Government - Information & Referral- Forsyth County- Information-Human Serv (660 West 5th Street) (6), Always Tours Inc (3978 Old Greensboro Rd) (7). Display/hide their approximate locations on the map
1,684 married couples with children.
1,538 single-parent households (463 men, 1,075 women).
84.5% of residents of 27101 zip code speak English at home.
11.5% of residents speak Spanish at home (64% very well, 15% well, 6% not well, 15% not at all).
2.4% of residents speak other Indo-European language at home (82% very well, 7% well, 11% not well).
0.9% of residents speak Asian or Pacific Island language at home (72% very well, 28% well).
0.2% of residents speak other language at home (80% very well, 20% well).
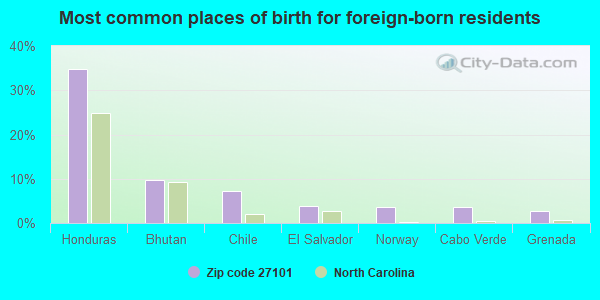
Foreign born population: 1,516 (7.1%) (30.8% of them are naturalized citizens)
This zip code:
7.1%
Whole state:
8.6%
35%Honduras
10%Bhutan
7%Chile
4%El Salvador
4%Norway
4%Cabo Verde
3%Grenada
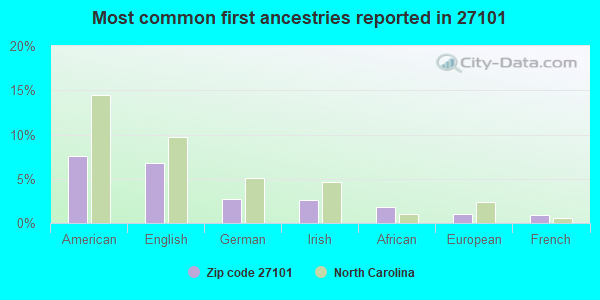
8%American
7%English
3%German
3%Irish
2%African
1%European
1%French
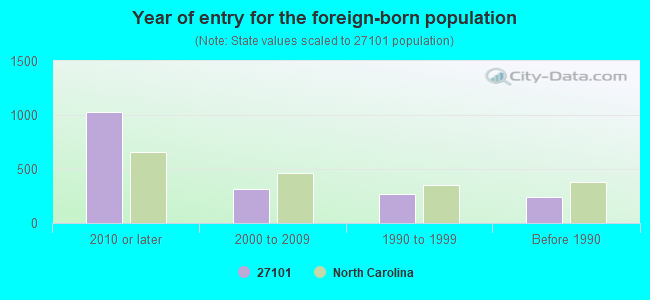
Year of entry for the foreign-born population
1,0292010 or later
3112000 to 2009
2731990 to 1999
241Before 1990
Major facilities with environmental interests located in this zip code:
ATKINS MIDDLE SCHOOL-ANNEX (1215 NORTH CAMERON AVENUE in WINSTON-SALEM, NC)
STATE MASTER (North Carolina facility info) - UNDERGROUND STORAGE TANK PROGRAM (National Center for Education Statistics) - STATE ID-312 Business SIC classification: NONCLASSIFIABLE ESTABLISHMENTS Organizations: FORSYTH COUNTY SCHOOLS (SCHOOL DISTRICT)
BUSINESS TELECOM, INC. (BTI) (301 N. MAIN STREET, SUITE G-100 in WINSTON-SALEM, NC)
ENFORCEMENT/COMPLIANCE ACTIVITY (Integrated Compliance Information System) - ICIS-04-2003-9973, FORMAL ENFORCEMENT ACTION (Integrated Compliance Information System) - ICIS-04-2003-9973, FORMAL ENFORCEMENT ACTION
CAMEL CITY CLEANERS (501 E THIRD ST in WINSTON SALEM, NC)
STATE MASTER (North Carolina facility info) - BROWNFIELDS SITE (Resource Conservation and Recovery Act (tracking hazardous waste)) Business SIC classification: NONCLASSIFIABLE ESTABLISHMENTS Organizations: AMERICLEAN NATIONAL CORPORATION (CONTACT/OWNER)
BILL JACKSON TOYOTA (550 PETERS CREEK PKWY in WINSTON SALEM, NC)
STATE MASTER (North Carolina facility info) - UNDERGROUND STORAGE TANK PROGRAM Conditionally Exempt Small Quantity Generators, less than 100 kg/month of hazardous waste (Resource Conservation and Recovery Act (tracking hazardous waste)) - notification Business SIC classification: NONCLASSIFIABLE ESTABLISHMENTS
CAMEL CITY CLEANERS (2808 REYNOLDA RD in WINSTON SALEM, NC)
STATE MASTER (North Carolina facility info) - UNDERGROUND STORAGE TANK PROGRAM Small Quantity Generators, between 100 kg and 1000 kg of hazardous waste/month (Resource Conservation and Recovery Act (tracking hazardous waste)) - notification Business SIC classification: NONCLASSIFIABLE ESTABLISHMENTS Organizations: AMERICLEAN NATIONAL CORPORATION (CONTACT/OWNER)
Alternative names: CAMEL CITY LAUNDRY COMPANY
CAROLINA NARROW FABRIC CO (1100 PATTERSON AVE in WINSTON SALEM, NC)
STATE MASTER (North Carolina facility info) - UNDERGROUND STORAGE TANK PROGRAM Conditionally Exempt Small Quantity Generators, less than 100 kg/month of hazardous waste (Resource Conservation and Recovery Act (tracking hazardous waste)) - notification Business SIC classification: NONCLASSIFIABLE ESTABLISHMENTS Organizations: HORACE L FREEMAN (CONTACT/OWNER)
ARTS BASED ELEMENTARY (1215 CAMERON DRIVE in WINSTON-SALEM, NC)
(National Center for Education Statistics) - STATE ID-0
DOWNTOWN MIDDLE (280 S LIBERTY ST in WINSTON-SALEM, NC)
(National Center for Education Statistics) - STATE ID-0
A-1 AUTO SALVAGE (6571 OLD LEXINGTON RD in WINSTON SALEM, NC)
ENFORCEMENT/COMPLIANCE ACTIVITY (Integrated Compliance Information System) National Pollutant Discharge Elimination System NON-MAJOR (Tracking pollutant discharge elimination systems) - permit Business SIC classification: MOTOR VEHICLE PARTS, USED
ADELE KNITS INC (800 CHATHAM RD in WINSTON SALEM, NC)
(Resource Conservation and Recovery Act (tracking hazardous waste)) Organizations: ADELE KNITS INC. (CONTACT/OWNER)
ARMY RESERVE XVIII AIRBORNE CORPS (932 BROOKSTOWN AVE in WINSTON SALEM, NC) . Federal Facility. U.S. ARMY
(Resource Conservation and Recovery Act (tracking hazardous waste)) Organizations: DEPT. OF ARMY (CONTACT/OWNER)
AUTO PAINT & EQUIPMENT CO (30 WEST SALEM AVE in WINSTON SALEM, NC)
(Resource Conservation and Recovery Act (tracking hazardous waste)) Organizations: CHARLES A. KEY (CONTACT/OWNER)
B & R AUTOMOTIVE (858 NORTHWEST BLVD in WINSTON SALEM, NC)
(Resource Conservation and Recovery Act (tracking hazardous waste)) Organizations: KEN BINGHAM (CONTACT/OWNER)
Housing units lacking complete plumbing facilities: 1.3% Housing units lacking complete kitchen facilities: 2.6%
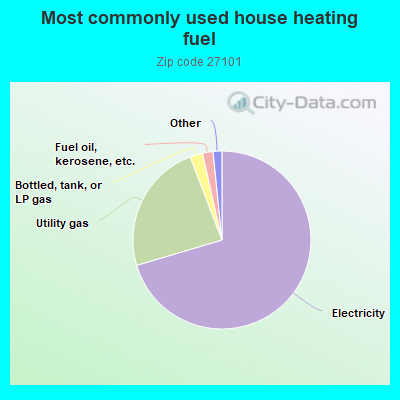
70.4%Electricity
23.8%Utility gas
2.3%Bottled, tank, or LP gas
1.9%Fuel oil, kerosene, etc.
0.8%No fuel used
0.6%Other fuel
Population in 1990: 19,333. Population change in the 1990s: +375 (+1.9%).
Place of birth for U.S.-born residents:
This state: 12,669
Northeast: 2,499
Midwest: 739
South: 3,041
West: 488
52% of the 27101 zip code residents lived in the same house 5 years ago. Out of people who lived in different houses, 53% lived in this county. Out of people who lived in different counties, 50% lived in North Carolina.
84% of the 27101 zip code residents lived in the same house 1 year ago. Out of people who lived in different houses, 48% moved from this county. Out of people who lived in different houses, 22% moved from different county within same state. Out of people who lived in different houses, 22% moved from different state. Out of people who lived in different houses, 3% moved from abroad.
Private vs. public school enrollment:
Students in private schools in grades 1 to 8 (elementary and middle school): 101
Here:
5.5%
North Carolina:
13.8%
Students in private schools in grades 9 to 12 (high school): 78
Here:
13.2%
North Carolina:
11.9%
Students in private undergraduate colleges: 381
Here:
28.3%
North Carolina:
19.3%
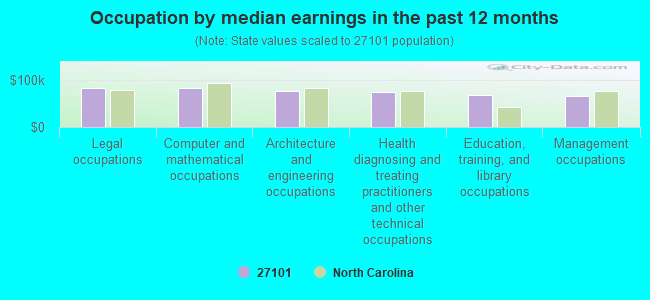
Occupation by median earnings in the past 12 months ($)
84,479Legal occupations
83,267Computer and mathematical occupations
78,093Architecture and engineering occupations
74,928Health diagnosing and treating practitioners and other technical occupations
67,887Education, training, and library occupations
65,408Management occupations
Companies with federal contracts located in this zip code:
JDL-DURHAM LLC (260 GREYHOUD CT STE A in WINSTON SALEM, NC; small business) 2 employees, $300000 revenue. : $1,290,538 in 38 contractsfrom 2003 to 2006
Contracts for Lease or Rental of Facilities -- Office Buildings by Public Buildings Service Signed by year:2000: $0; 2001: $0; 2002: $0; 2003: $483,254; 2004: $96,651; 2005: $419,393; 2006: $291,240.
Biggest contracts:
$96,650 with Public Buildings Service for Lease or Rental of Facilities -- Office Buildings. Signed on 2003-09-15. Completion date: 2003-09-15.
$32,360, same as above.Signed on 2006-07-01. Completion date: 2006-09-30.
$32,360, same as above.Signed on 2006-07-01. Completion date: 2006-09-30.
$32,360, same as above.Signed on 2006-01-01. Completion date: 2006-09-30.
LONG COMMUNICATIONS GROUP (961 BURKE STREET in WINSTON-SALEM, NC; small business) : $90,469 in 3 contractsfrom 1999 to 2003
$32,645 with Navy for Video Recording and Reproducing Equipment. Signed on 2003-01-23. Completion date: 2003-02-05.
$31,911 with Navy for Radio and Television Communication Equipment, Except Airborne. Signed on 1999-11-16. Completion date: 1999-12-13.
$25,913 with Navy for ADPE System Configuration. Signed on 2003-03-10. Completion date: 2003-04-04.
ADAMS MARK HOTELS & RESORTS (425 NORTH CHERRY ST in WINSTON SALEM, NC)
$48,070 with Defense Logistics Agency for Purchase of Structures and Facilities -- Conference Space and Facilities. Taking place in MA. Signed on 2001-05-23. Completion date: 2001-06-15.
MARKETWISE PROMOTIONS,INC. (1001 SOUTH MARSHALL STREET in WINSTON-SALEM, NC; small business)
$38,028 with Army for Signs, Advertising Displays, and Identification Plates. Signed on 2000-09-22. Completion date: 2001-02-28.
GUTEKUNST,DAVID (1416 GLADE ST APT# 1 in WINSTON SALEM, NC; small business)
$12,118 with Army for Technical Assistance. Signed on 2004-08-17. Completion date: 2005-02-25.
CREATIVE DIVERSITY,LLC (411 W 4TH ST in WINSTON SALEM, NC; small business) : $6,360 in 2 contractsin 2005
$3,644 with Air Force for Games, Toys and Wheeled Goods. Taking place in CA. Signed on 2005-07-30. Completion date: 2005-08-31.
$2,716 with Army for Other Education and Training Services. Signed on 2005-07-26. Completion date: 2005-08-15.
SILKROAD TECHNOLOGY, INC (111 NORTH CHESTNUT ST in WINSTON SALEM, NC; small business) : $3,547 in 2 contractsin 2004
$2,069 with Army for ADP Software. Signed on 2004-02-20. Completion date: 2004-09-30.
$1,478, same as above.Signed on 2004-05-10. Completion date: 2004-09-30.
Top industries in this zip code by the number of employees in 2005:
2002 - 2018 National Fire Incident Reporting System (NFIRS) incidents
Based on the data from the years 2002 - 2018 the average number of fire incidents per year is 117. The highest number of reported fires - 241 took place in 2007, and the least - 23 in 2002. The data has a growing trend.
When looking into fire subcategories, the most reports belonged to: Outside Fires (38.0%), and Structure Fires (38.0%).
Fire incident types reported to NFIRS in Zip Code 27101


 Nearest zip codes: 27110, 27105, 27109, 27051, 27107, 27127.


 Based on the data from the years 2002 - 2018 the average number of fire incidents per year is 117. The highest number of reported fires - 241 took place in 2007, and the least - 23 in 2002. The data has a growing trend.
 When looking into fire subcategories, the most reports belonged to: Outside Fires (38.0%), and Structure Fires (38.0%).