Estimated zip code population in 2022: 40,910 Zip code population in 2010: 36,954 Zip code population in 2000: 34,264
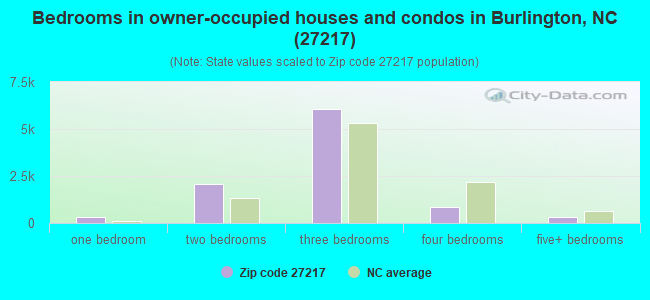
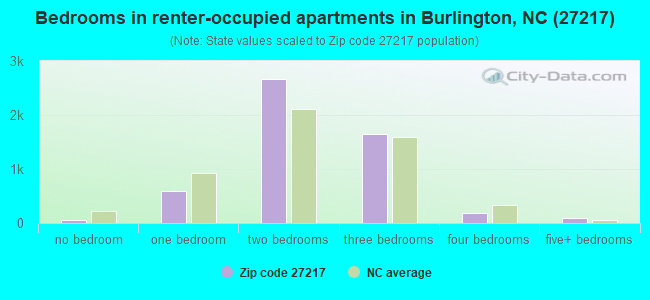
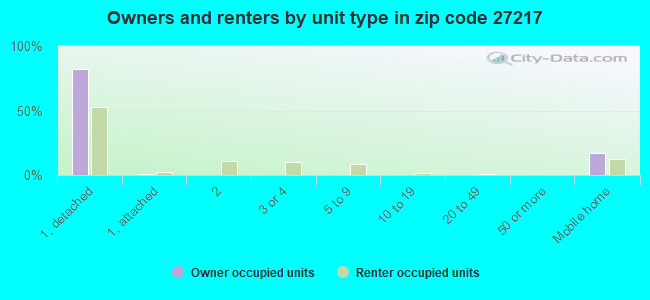
Houses and condos: 16,847 Renter-occupied apartments: 5,272
% of renters here:
35%
State:
33%
March 2022 cost of living index in zip code 27217: 90.6 (less than average, U.S. average is 100)
Land area: 123.2 sq. mi. Water area: 3.6 sq. mi.
Population density: 332 people per square mile
(very low).
OSM Map
General Map
Google Map
MSN Map
OSM Map
General Map
Google Map
MSN Map
OSM Map
General Map
Google Map
MSN Map
OSM Map
General Map
Google Map
MSN Map
Please wait while loading the map...
Real estate property taxes paid for housing units in 2022:
This zip code:
0.6% ($1,033)
North Carolina:
0.6% ($1,769)
Median real estate property taxes paid for housing units with mortgages in 2022: $1,116 (0.6%) Median real estate property taxes paid for housing units with no mortgage in 2022: $922 (0.7%)
Averages for the 2020 tax year for zip code 27217, filed in 2021:
Average Adjusted Gross Income (AGI) in 2020: $40,556 (Individual Income Tax Returns)
Here:
$40,556
State:
$70,020
Salary/wage: $36,846 (reported on 87.5% of returns)
Here:
$36,846
State:
$58,387
(% of AGI for various income ranges: 1229.5% for AGIs below $25k, 3913.3% for AGIs $25k-50k, 7123.5% for AGIs $50k-75k, 10811.4% for AGIs $75k-100k, 19094.1% for AGIs $100k-200k, 77312.5% for AGIs over 200k)
Taxable interest for individuals: $744 (reported on 16.0% of returns)
This zip code:
$744
North Carolina:
$1,479
(% of AGI for various income ranges: 6.5% for AGIs below $25k, 6.2% for AGIs $25k-50k, 21.5% for AGIs $50k-75k, 25.3% for AGIs $75k-100k, 87.9% for AGIs $100k-200k, 1142.5% for AGIs over 200k)
Ordinary dividends: $4,371 (reported on 7.0% of returns)
Here:
$4,371
State:
$7,888
(% of AGI for various income ranges: 8.4% for AGIs below $25k, 9.6% for AGIs $25k-50k, 38.1% for AGIs $50k-75k, 55.0% for AGIs $75k-100k, 307.3% for AGIs $100k-200k, 4577.5% for AGIs over 200k)
Net capital gain/loss in AGI: +$10,611 (reported on 6.4% of returns)
Here:
+$10,611
State:
+$23,652
(% of AGI for various income ranges: 4.9% for AGIs below $25k, 11.9% for AGIs $25k-50k, 41.9% for AGIs $50k-75k, 144.0% for AGIs $75k-100k, 522.1% for AGIs $100k-200k, 16960.0% for AGIs over 200k)
Profit/loss from business: +$8,651 (reported on 14.6% of returns)
Here:
+$8,651
State:
+$11,710
(% of AGI for various income ranges: 125.3% for AGIs below $25k, 96.8% for AGIs $25k-50k, 155.0% for AGIs $50k-75k, 157.7% for AGIs $75k-100k, 549.1% for AGIs $100k-200k, 10180.0% for AGIs over 200k)
Taxable individual retirement arrangement distribution: $12,864 (reported on 5.5% of returns)
27217:
$12,864
North Carolina:
$20,247
(% of AGI for various income ranges: 38.2% for AGIs below $25k, 53.0% for AGIs $25k-50k, 129.2% for AGIs $50k-75k, 271.4% for AGIs $75k-100k, 577.1% for AGIs $100k-200k, 1960.0% for AGIs over 200k)
Total itemized deductions: $30,910 (reported on 2.8% of returns)
Here:
$30,910
State:
$34,549
(% of AGI for various income ranges: 17.4% for AGIs below $25k, 47.1% for AGIs $25k-50k, 156.6% for AGIs $50k-75k, 252.1% for AGIs $75k-100k, 737.9% for AGIs $100k-200k, 9852.5% for AGIs over 200k)
Charity contributions: $12,173 (reported on 2.3% of returns)
Here:
$12,173
State:
$13,360
(% of AGI for various income ranges: 1.8% for AGIs below $25k, 9.5% for AGIs $25k-50k, 43.9% for AGIs $50k-75k, 64.3% for AGIs $75k-100k, 209.8% for AGIs $100k-200k, 5350.0% for AGIs over 200k)
Taxes paid: $5,750 (reported on 2.8% of returns)
27217:
$5,750
State:
$7,586
(% of AGI for various income ranges: 2.5% for AGIs below $25k, 5.8% for AGIs $25k-50k, 29.3% for AGIs $50k-75k, 51.6% for AGIs $75k-100k, 189.5% for AGIs $100k-200k, 1467.5% for AGIs over 200k)
Earned income credit: $2,542 (reported on 27.8% of returns)
Here:
$2,542
State:
$2,337
(% of AGI for various income ranges: 138.4% for AGIs below $25k, 96.6% for AGIs $25k-50k, 2.0% for AGIs $50k-75k)
Percentage of individuals using paid preparers for their 2020 taxes: 88.8%
Here:
89%
State:
93%
(% for various income ranges: 88.7% for AGIs below $25k, 88.3% for AGIs $25k-50k, 88.8% for AGIs $50k-75k, 89.9% for AGIs $75k-100k, 91.5% for AGIs $100k-200k, 93.8% for AGIs over 200k)
Averages for the 2012 tax year for zip code 27217, filed in 2013:
Average Adjusted Gross Income (AGI) in 2012: $33,153 (Individual Income Tax Returns)
Here:
$33,153
State:
$54,937
Salary/wage: $30,648 (reported on 88.2% of returns)
Here:
$30,648
State:
$46,336
(% of AGI for various income ranges: 81.2% for AGIs below $25k, 87.0% for AGIs $25k-50k, 81.8% for AGIs $50k-75k, 80.8% for AGIs $75k-100k, 76.3% for AGIs $100k-200k, 64.2% for AGIs over 200k)
Taxable interest for individuals: $957 (reported on 19.2% of returns)
This zip code:
$957
North Carolina:
$1,298
(% of AGI for various income ranges: 0.6% for AGIs below $25k, 0.3% for AGIs $25k-50k, 0.5% for AGIs $50k-75k, 0.4% for AGIs $75k-100k, 0.6% for AGIs $100k-200k, 2.7% for AGIs over 200k)
Ordinary dividends: $2,889 (reported on 8.6% of returns)
Here:
$2,889
State:
$6,213
(% of AGI for various income ranges: 0.7% for AGIs below $25k, 0.4% for AGIs $25k-50k, 0.6% for AGIs $50k-75k, 0.8% for AGIs $75k-100k, 0.9% for AGIs $100k-200k, 3.0% for AGIs over 200k)
Net capital gain/loss in AGI: +$2,729 (reported on 6.6% of returns)
Here:
+$2,729
State:
+$12,740
(% of AGI for various income ranges: 0.2% for AGIs $25k-50k, 0.3% for AGIs $50k-75k, 0.4% for AGIs $75k-100k, 1.2% for AGIs $100k-200k, 5.2% for AGIs over 200k)
Profit/loss from business: +$7,390 (reported on 12.8% of returns)
Here:
+$7,390
State:
+$10,311
(% of AGI for various income ranges: 6.5% for AGIs below $25k, 1.5% for AGIs $25k-50k, 1.3% for AGIs $50k-75k, 1.1% for AGIs $75k-100k, 4.2% for AGIs $100k-200k)
Taxable individual retirement arrangement distribution: $9,829 (reported on 7.3% of returns)
27217:
$9,829
North Carolina:
$15,575
(% of AGI for various income ranges: 2.1% for AGIs below $25k, 1.5% for AGIs $25k-50k, 1.9% for AGIs $50k-75k, 2.7% for AGIs $75k-100k, 4.0% for AGIs $100k-200k)
Total itemized deductions: $17,486 (26% of AGI, reported on 20.4% of returns)
Here:
$17,486
State:
$23,438
Here:
26.2% of AGI
State:
21.5% of AGI
(% of AGI for various income ranges: 5.1% for AGIs below $25k, 8.8% for AGIs $25k-50k, 12.9% for AGIs $50k-75k, 14.0% for AGIs $75k-100k, 15.0% for AGIs $100k-200k, 20.6% for AGIs over 200k)
Charity contributions: $3,877 (reported on 16.7% of returns)
Here:
$3,877
State:
$4,687
(% of AGI for various income ranges: 0.6% for AGIs below $25k, 1.5% for AGIs $25k-50k, 2.4% for AGIs $50k-75k, 2.7% for AGIs $75k-100k, 2.8% for AGIs $100k-200k, 5.5% for AGIs over 200k)
Taxes paid: $5,104 (reported on 20.3% of returns)
27217:
$5,104
State:
$8,823
(% of AGI for various income ranges: 0.8% for AGIs below $25k, 1.8% for AGIs $25k-50k, 3.6% for AGIs $50k-75k, 4.7% for AGIs $75k-100k, 6.1% for AGIs $100k-200k, 7.6% for AGIs over 200k)
Earned income credit: $2,552 (reported on 32.8% of returns)
Here:
$2,552
State:
$2,376
(% of AGI for various income ranges: 9.5% for AGIs below $25k, 1.6% for AGIs $25k-50k)
Percentage of individuals using paid preparers for their 2012 taxes: 52.3%
Here:
52%
State:
53%
(% for various income ranges: 51.7% for AGIs below $25k, 50.9% for AGIs $25k-50k, 53.6% for AGIs $50k-75k, 55.4% for AGIs $75k-100k, 60.7% for AGIs $100k-200k, 83.3% for AGIs over 200k)
Averages for the 2004 tax year for zip code 27217, filed in 2005:
Average Adjusted Gross Income (AGI) in 2004: $30,105 (Individual Income Tax Returns)
Here:
$30,105
State:
$45,376
Salary/wage: $28,123 (reported on 89.0% of returns)
Here:
$28,123
State:
$39,442
(% of AGI for various income ranges: 96.3% for AGIs below $10k, 86.2% for AGIs $10k-25k, 86.5% for AGIs $25k-50k, 86.2% for AGIs $50k-75k, 81.3% for AGIs $75k-100k, 62.1% for AGIs over 100k)
Taxable interest for individuals: $1,114 (reported on 25.9% of returns)
This zip code:
$1,114
North Carolina:
$1,515
(% of AGI for various income ranges: 2.2% for AGIs below $10k, 0.9% for AGIs $10k-25k, 0.7% for AGIs $25k-50k, 0.8% for AGIs $50k-75k, 1.2% for AGIs $75k-100k, 1.5% for AGIs over 100k)
Taxable dividends: $1,795 (reported on 11.5% of returns)
Here:
$1,795
State:
$4,016
(% of AGI for various income ranges: 1.2% for AGIs below $10k, 0.5% for AGIs $10k-25k, 0.5% for AGIs $25k-50k, 0.4% for AGIs $50k-75k, 0.9% for AGIs $75k-100k, 1.7% for AGIs over 100k)
Net capital gain/loss: +$6,358 (reported on 8.5% of returns)
Here:
+$6,358
State:
+$11,152
(% of AGI for various income ranges: -0.6% for AGIs below $10k, 0.2% for AGIs $10k-25k, 0.3% for AGIs $25k-50k, 0.4% for AGIs $50k-75k, 1.6% for AGIs $75k-100k, 11.8% for AGIs over 100k)
Profit/loss from business: +$4,850 (reported on 11.6% of returns)
Here:
+$4,850
State:
+$9,490
(% of AGI for various income ranges: 4.0% for AGIs below $10k, 2.7% for AGIs $10k-25k, 1.7% for AGIs $25k-50k, 1.3% for AGIs $50k-75k, 1.5% for AGIs $75k-100k, 1.7% for AGIs over 100k)
IRA payment deduction: $2,526 (reported on 1.4% of returns)
27217:
$2,526
North Carolina:
$2,967
(% of AGI for various income ranges: 0.1% for AGIs $10k-25k, 0.1% for AGIs $25k-50k, 0.1% for AGIs $50k-75k, 0.1% for AGIs $75k-100k, 0.1% for AGIs over 100k)
Self-employed pension: $3,105 (reported on 0.1% of returns)
Here:
$3,105
North Carolina:
$14,754
Total itemized deductions: $15,243 (27% of AGI, reported on 25.7% of returns)
Here:
$15,243
State:
$19,464
Here:
27.1% of AGI
State:
22.7% of AGI
(% of AGI for various income ranges: 8.8% for AGIs below $10k, 7.0% for AGIs $10k-25k, 13.4% for AGIs $25k-50k, 15.5% for AGIs $50k-75k, 16.8% for AGIs $75k-100k, 15.2% for AGIs over 100k)
Charity contributions deductions: $3,150 (5% of AGI, reported on 22.0% of returns)
Here:
$3,150
State:
$4,035
Here:
5.4% of AGI
State:
4.5% of AGI
(% of AGI for various income ranges: 0.8% for AGIs below $10k, 1.0% for AGIs $10k-25k, 2.0% for AGIs $25k-50k, 2.8% for AGIs $50k-75k, 3.4% for AGIs $75k-100k, 3.6% for AGIs over 100k)
Total tax: $3,532 (reported on 61.6% of returns)
27217:
$3,532
State:
$7,257
(% of AGI for various income ranges: 2.1% for AGIs below $10k, 2.7% for AGIs $10k-25k, 5.7% for AGIs $25k-50k, 8.1% for AGIs $50k-75k, 9.9% for AGIs $75k-100k, 15.9% for AGIs over 100k)
Earned income credit: $1,912 (reported on 29.3% of returns)
Here:
$1,912
State:
$1,851
Percentage of individuals using paid preparers for their 2004 taxes: 59.4%
Here:
59%
State:
62%
(% for various income ranges: 53.2% for AGIs below $10k, 63.6% for AGIs $10k-25k, 57.4% for AGIs $25k-50k, 59.0% for AGIs $50k-75k, 63.0% for AGIs $75k-100k, 68.3% for AGIs over 100k)
Likely homosexual households (counted as self-reported same-sex unmarried-partner households)
Lesbian couples: 0.0% of all households
Gay men: 0.6% of all households
Household received Food Stamps/SNAP in the past 12 months: 3,469 Household did not receive Food Stamps/SNAP in the past 12 months: 11,678
Women who had a birth in the past 12 months: 526 (208 now married, 306 unmarried) Women who did not have a birth in the past 12 months: 9,343 (3,257 now married, 6,069 unmarried)
Housing units in zip code 27217 with a mortgage: 5,691 (449 second mortgage, 11 home equity loan, 421 both second mortgage and home equity loan) Houses without a mortgage: 205
Median monthly owner costs for units with a mortgage: $1,085 Median monthly owner costs for units without a mortgage: $379
Residents with income below the poverty level in 2022:
This zip code:
17.8%
Whole state:
12.8%
Residents with income below 50% of the poverty level in 2022:
This zip code:
11.9%
Whole state:
6.8%
Median number of rooms in houses and condos:
Here:
5.6
State:
6.4
Median number of rooms in apartments:
Here:
4.7
State:
4.4
Notable locations in this zip code not listed on our city pages
Churches in zip code 27217 include: Hopedale Church (A), Jeffries Cross Church (B), Grace Church (C), Allred Memorial Tabernacle (D), Archs Grove Church (E), Baynes Church (F), Living Home Church (G), Longs Chapel (H), Bethel Church (I). Display/hide their locations on the map
Reservoirs: Stony Creek Reservoir (A), Vinsons Lake (B), Lake Burlington Sediment Pool Number Two (C), Lake Burlington Sediment Pool (D), McCauley Lake (E), Lake Burlington (F), Lake Cammack (G), Lake View Estates Pond (H). Display/hide their locations on the map
Creeks: Deep Creek (A), Byrds Creek (B), Buttermilk Creek (C), Boyds Creek (D), Travis Creek (E), Toms Creek (F), Stony Creek (G), Staley Creek (H), Service Creek (I). Display/hide their locations on the map
Parks in zip code 27217 include: Sellars Memorial Park (1), Oakdale Town and Country Park (2), Fairchild Park (3), North Park (4). Display/hide their locations on the map
4,781 married couples with children.
4,521 single-parent households (846 men, 3,675 women).
77.8% of residents of 27217 zip code speak English at home.
20.9% of residents speak Spanish at home (51% very well, 20% well, 13% not well, 16% not at all).
0.3% of residents speak other Indo-European language at home (100% very well).
0.6% of residents speak Asian or Pacific Island language at home (65% very well, 35% well).
0.2% of residents speak other language at home (53% very well, 32% well, 15% not well).
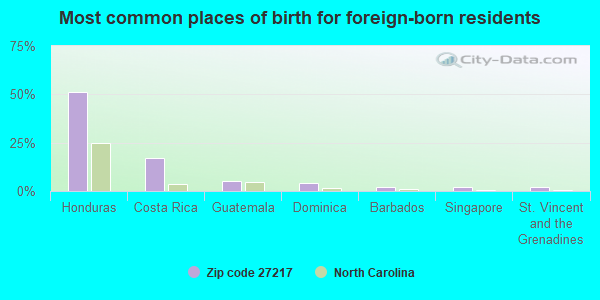
Foreign born population: 5,248 (12.8%) (33.3% of them are naturalized citizens)
This zip code:
12.8%
Whole state:
8.6%
51%Honduras
17%Costa Rica
5%Guatemala
4%Dominica
2%Barbados
2%Singapore
2%St. Vincent and the Grenadines
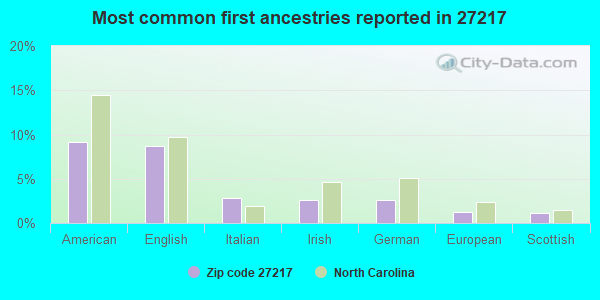
9%American
9%English
3%Italian
3%Irish
3%German
1%European
1%Scottish
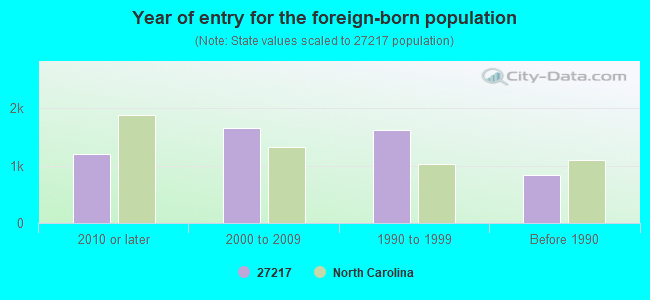
Year of entry for the foreign-born population
1,2002010 or later
1,6642000 to 2009
1,6271990 to 1999
832Before 1990
Facilities with environmental interests located in this zip code:
CITY OF BURLINGTON - EAST BURLINGTON WWTP (225 STONE QUARRY ROAD in BURLINGTON, NC)
AIR SYNTHETIC MINOR (AIRS/AFS) STATE MASTER (North Carolina facility info) - -115DA4YG00M69W84AY3W842N8N, WASTEWATER FACILITY, -3684, AIR PROGRAM, -0-024032, UNDERGROUND STORAGE TANK PROGRAM CRITERIA AND HAZARDOUS AIR POLLUTANT INVENTORY (Inventory of air pollution sources) National Pollutant Discharge Elimination System MAJOR (Tracking pollutant discharge elimination systems) - permit National Pollutant Discharge Elimination System NON-MAJOR (Tracking pollutant discharge elimination systems) - permit Business SIC classification: SEWERAGE SYSTEMS; NONCLASSIFIABLE ESTABLISHMENTS Organizations: BURLINGTON, CITY OF (CONTACT/OWNER)
Alternative names: BURLINGTON E BURLINGTON WWTP, BURLINGTON - EASTSIDE WWTP, EAST BURLINGTON WASTEWATER TREATMENT PLANT
BROADVIEW MIDDLE (2229 BROADVIEW DRIVE in BURLINGTON, NC)
(National Center for Education Statistics) - STATE ID-310 Organizations: ALAMANCE-BURLINGTON SCHOOLS (SCHOOL DISTRICT)
CLOVER GARDEN (2454 ALTAMHAW UNION RIDGE ROAD in BURLINGTON, NC)
(National Center for Education Statistics) - STATE ID-0
ALAMANCE OIL COMPANY INCORPORATED PROPANE FACI (1525 WEST WEBB AVE. in BURLINGTON, NC)
(Integrated Compliance Information System) - ICIS-04-2004-5036, FORMAL ENFORCEMENT ACTION
CAROLINA ENVIRONMENTAL ASSOC (236 N MEBANE ST STE 131 in BURLINGTON, NC)
(Resource Conservation and Recovery Act (tracking hazardous waste)) Organizations: WILLIAM A HAWKS (CONTACT/OWNER)
CAROLINA ENVIRONMENTAL ASSOCIATES INC (1317 RAILROAD ST in BURLINGTON, NC)
(Resource Conservation and Recovery Act (tracking hazardous waste)) Organizations: ELIZABETH P MOORE (CONTACT/OWNER)
CENTRAL CAROLINA PRODUCTS (250 W. OLD GLENCOE RD in BURLINGTON, NC)
(Resource Conservation and Recovery Act (tracking hazardous waste)) Organizations: CARLOS I DIAZ (CONTACT/OWNER)
ALAMANCE-BURLINGTON SCHOOL SYSTEM (1712 VAUGHN RD in BURLINGTON, NC)
COMPLIANCE ACTIVITY (Tracking inspections of insecticide, fungicide, and rodenticide, and toxic substances) Conditionally Exempt Small Quantity Generators, less than 100 kg/month of hazardous waste (Resource Conservation and Recovery Act (tracking hazardous waste)) - notification Organizations: ALAMANCE BURLINGTON BORD OF ED (CONTACT/OWNER)
Alternative names: ALAMANCE-BURLINGTON SCHOOL DISTRICT
AAA SIGNS OF BURLINGTON INC (151 MCARTHUR LN in BURLINGTON, NC)
Conditionally Exempt Small Quantity Generators, less than 100 kg/month of hazardous waste (Resource Conservation and Recovery Act (tracking hazardous waste)) - notification Organizations: JOSEPH F. MATKINS (CONTACT/OWNER)
ALAMANCE STARTER & ALTERNATOR (521 E WEBB AVE in BURLINGTON, NC)
Small Quantity Generators, between 100 kg and 1000 kg of hazardous waste/month (Resource Conservation and Recovery Act (tracking hazardous waste)) - notification Organizations: DELBERT DOUGLAS GREESON (CONTACT/OWNER)
DIESEL ENGINE & HEAVY EQUIPMENT REPAIR (1547 GRAHAM-HOPEDALE RD in BURLINGTON, NC)
Small Quantity Generators, between 100 kg and 1000 kg of hazardous waste/month (Resource Conservation and Recovery Act (tracking hazardous waste)) - notification Organizations: DALE PHILLIPS (CONTACT/OWNER)
Housing units lacking complete plumbing facilities: 2.2% Housing units lacking complete kitchen facilities: 2.5%
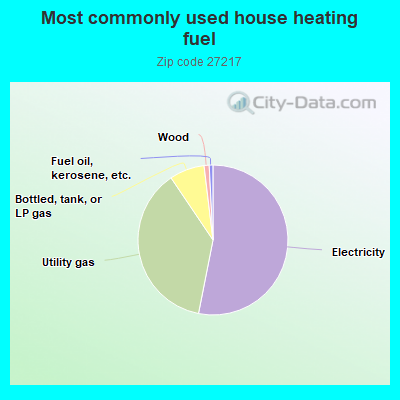
52.9%Electricity
37.3%Utility gas
7.5%Bottled, tank, or LP gas
1.1%Wood
0.8%Fuel oil, kerosene, etc.
Population in 1990: 30,651. Population change in the 1990s: +3,613 (+11.8%).
Place of birth for U.S.-born residents:
This state: 28,578
Northeast: 2,273
Midwest: 748
South: 2,810
West: 695
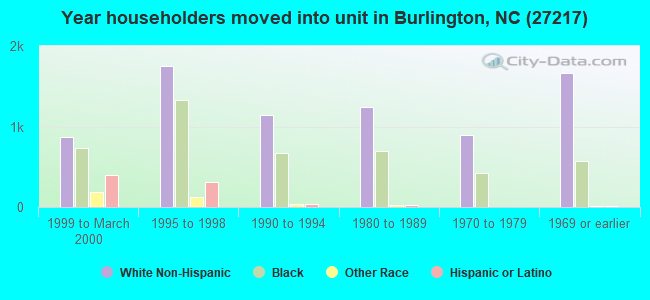
60% of the 27217 zip code residents lived in the same house 5 years ago. Out of people who lived in different houses, 66% lived in this county. Out of people who lived in different counties, 50% lived in North Carolina.
90% of the 27217 zip code residents lived in the same house 1 year ago. Out of people who lived in different houses, 38% moved from this county. Out of people who lived in different houses, 50% moved from different county within same state. Out of people who lived in different houses, 9% moved from different state. Out of people who lived in different houses, 4% moved from abroad.
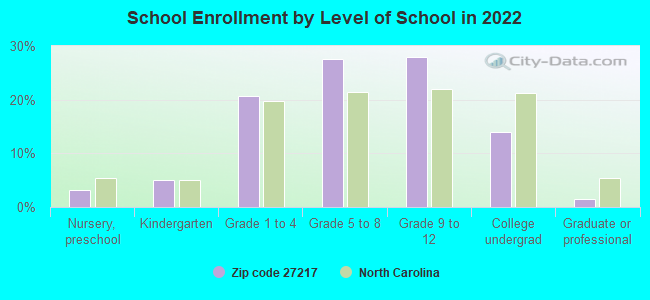
Private vs. public school enrollment:
Students in private schools in grades 1 to 8 (elementary and middle school): 419
Here:
8.6%
North Carolina:
13.8%
Students in private schools in grades 9 to 12 (high school): 624
Here:
21.8%
North Carolina:
11.9%
Students in private undergraduate colleges: 177
Here:
12.7%
North Carolina:
19.3%
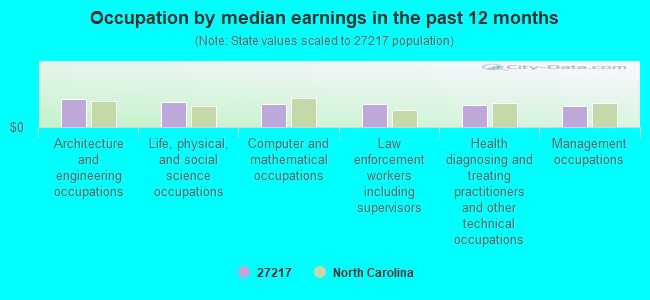
Occupation by median earnings in the past 12 months ($)
76,297Architecture and engineering occupations
67,964Life, physical, and social science occupations
62,475Computer and mathematical occupations
61,496Law enforcement workers including supervisors
59,327Health diagnosing and treating practitioners and other technical occupations
58,236Management occupations
Companies with federal contracts located in this zip code (BURLINGTON, NC):
SPECIAL T HOSIERY MILLS INC (1102 N ANTHONY ST; small business) : $32,801,570 in 147 contractsfrom 1999 to 2006
Contracts for Hosiery, Handwear, and Clothing Accessories, Men's, Clothing, Special Purpose, Hose, Pipe, Tube, Lubrication, and Railing Fittings, Hospital Furniture, Equipment, Utensils, and Supplies by Defense Logistics Agency Signed by year:2000: $3,915,294; 2001: $9,304,067; 2002: $3,740,189; 2003: $1,889,910; 2004: $5,250,491; 2005: $5,731,941; 2006: $2,480,172.
Biggest contracts:
$3,600,000 with Defense Logistics Agency for Hosiery, Handwear, and Clothing Accessories, Men's. Signed on 2001-10-30. Completion date: 2002-11-02.
$2,880,000, same as above.Signed on 2002-09-17. Completion date: 2003-04-01.
$1,667,110, same as above.Signed on 2003-10-21. Completion date: 2004-04-04.
$1,477,532, same as above.Signed on 2006-01-09. Completion date: 2006-06-01.
PICKETT HOSIERY MILLS, INC (741 EAST WEBB AVENUE; small business) : $9,643,208 in 30 contractsfrom 2002 to 2006
Contracts for Hosiery, Handwear, and Clothing Accessories, Men's, Footwear, Men's by Army, Defense Logistics Agency Signed by year:2000: $0; 2001: $0; 2002: $44,976; 2003: $450,672; 2004: $6,364,306; 2005: $2,086,608; 2006: $696,646.
Biggest contracts:
$2,285,170 with Army for Hosiery, Handwear, and Clothing Accessories, Men's. Signed on 2004-10-20. Completion date: 2005-10-31.
$2,057,969 with Defense Logistics Agency for Hosiery, Handwear, and Clothing Accessories, Men's. Signed on 2006-01-11. Completion date: 2006-06-01.
$1,681,336, same as above.Signed on 2004-01-08. Completion date: 2004-10-01.
$1,411,200 with Army for Hosiery, Handwear, and Clothing Accessories, Men's. Signed on 2004-06-18. Completion date: 2006-06-17.
ELDER HOSIERY MILLS, INC (139 HOMEWOOD AVENUE; small business) : $4,912,335 in 40 contractsfrom 2000 to 2006
Contracts for Hosiery, Handwear, and Clothing Accessories, Men's, Clothing, Special Purpose by Defense Logistics Agency Signed by year:2000: $935,000; 2001: $1,125,000; 2002: $109,495; 2003: $119,925; 2004: $1,102,526; 2005: $1,288,715; 2006: $231,674.
Biggest contracts:
$750,000 with Defense Logistics Agency for Hosiery, Handwear, and Clothing Accessories, Men's. Signed on 2001-11-05. Completion date: 2003-02-03.
$750,000, same as above.Signed on 2000-12-11. Completion date: 2001-12-05.
$560,000, same as above.Signed on 2005-01-18. Completion date: 2005-12-14.
$528,786, same as above.Signed on 2004-03-08. Completion date: 2004-07-03.
THE MOLDING COMPANY INC (3222 N HWY 49; small business) : $375,200 in 2 contractsfrom 2002 to 2003
$311,000 with Department of Veterans Affairs for Plastics Fabricated Materials. Signed on 2002-07-15. Completion date: 2002-08-15.
$64,200 with Navy for Invalid code: 1927. Signed on 2003-09-25. Completion date: 2003-10-31.
WRIGHTENBERRY HOSIERY MILLS, I (910 CLEVELAND AVE; small business)
$95,625 with Army for Footwear, Men's. Taking place in LA. Signed on 2002-02-07. Completion date: 2002-04-09.
KELLY TATE PLUMBING, INC (857 INDIAN VALLEY DR; small business)
$4,800 with Army for Surveillance Services. Taking place in GA. Signed on 2003-09-28. Completion date: 2003-09-30.
Top industries in this zip code by the number of employees in 2005:
2002 - 2018 National Fire Incident Reporting System (NFIRS) incidents
Based on the data from the years 2002 - 2018 the average number of fires per year is 171. The highest number of reported fires - 265 took place in 2007, and the least - 86 in 2002. The data has a growing trend.
When looking into fire subcategories, the most reports belonged to: Structure Fires (41.1%), and Outside Fires (37.2%).
Fire incident types reported to NFIRS in Zip Code 27217


 Nearest zip codes: 27244, 27302, 27201, 27379, 27215, 27258.


 Based on the data from the years 2002 - 2018 the average number of fires per year is 171. The highest number of reported fires - 265 took place in 2007, and the least - 86 in 2002. The data has a growing trend.
 When looking into fire subcategories, the most reports belonged to: Structure Fires (41.1%), and Outside Fires (37.2%).