Estimated zip code population in 2022: 3,342 Zip code population in 2010: 3,100 Zip code population in 2000: 2,651
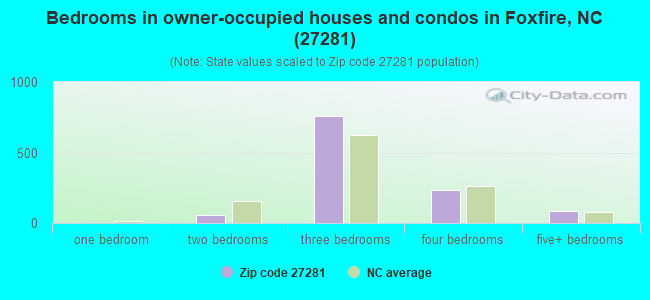
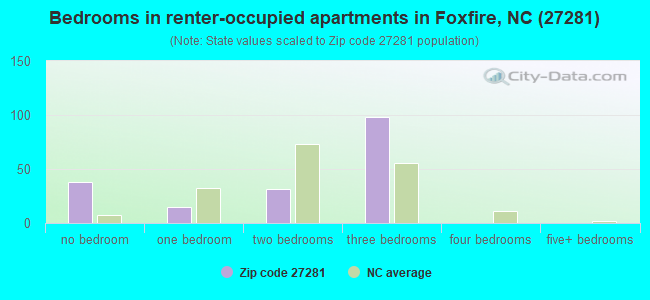
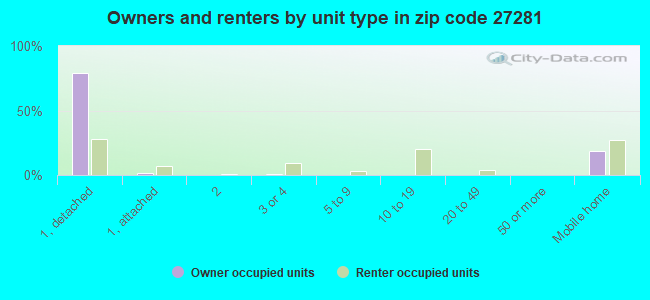
Houses and condos: 1,536 Renter-occupied apartments: 181
% of renters here:
14%
State:
33%
March 2022 cost of living index in zip code 27281: 81.5 (low, U.S. average is 100)
Land area: 52.1 sq. mi. Water area: 0.1 sq. mi.
Population density: 64 people per square mile
(very low).
OSM Map
General Map
Google Map
MSN Map
OSM Map
General Map
Google Map
MSN Map
OSM Map
General Map
Google Map
MSN Map
OSM Map
General Map
Google Map
MSN Map
Please wait while loading the map...
Real estate property taxes paid for housing units in 2022:
This zip code:
0.5% ($1,668)
North Carolina:
0.6% ($1,769)
Median real estate property taxes paid for housing units with mortgages in 2022: $1,820 (0.5%) Median real estate property taxes paid for housing units with no mortgage in 2022: $1,310 (0.5%)
Business Search- 14 Million verified businesses
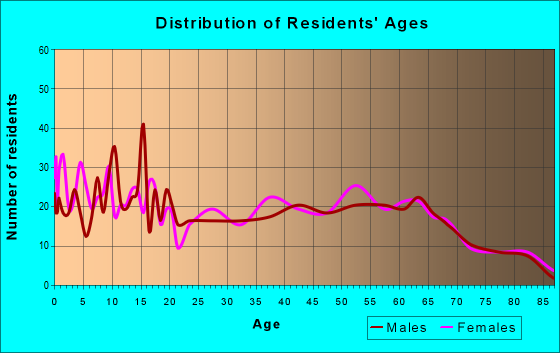
Males: 1,565
(46.8%)
Females: 1,777
(53.2%)
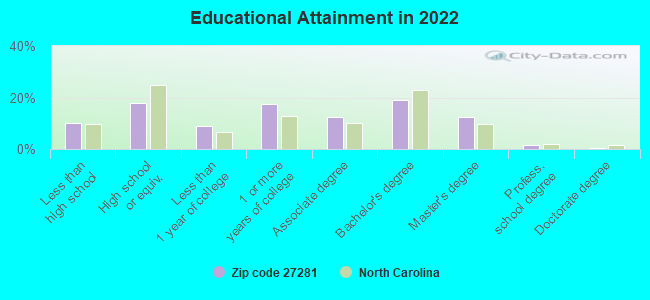
For population 25 years and over in 27281:
High school or higher: 89.5%
Bachelor's degree or higher: 33.0%
Graduate or professional degree: 14.2%
Unemployed: 0.4%
Mean travel time to work (commute): 25.0 minutes
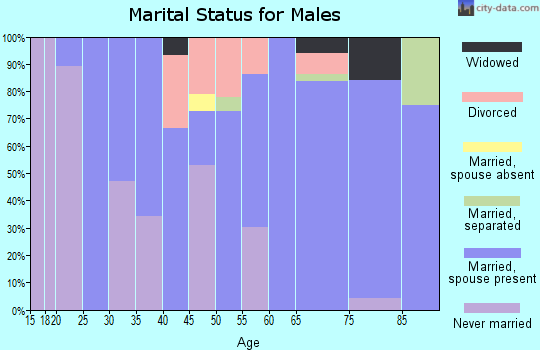
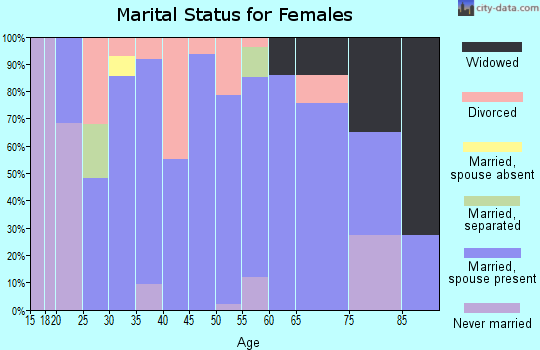
For population 15 years and over in 27281:
Never married: 20.4%
Now married: 61.0%
Separated: 0.8%
Widowed: 8.7%
Divorced: 9.2%
Zip code 27281 compared to state average:
Unemployed percentage significantly below state average.
Median age significantly above state average.
Renting percentage significantly below state average.
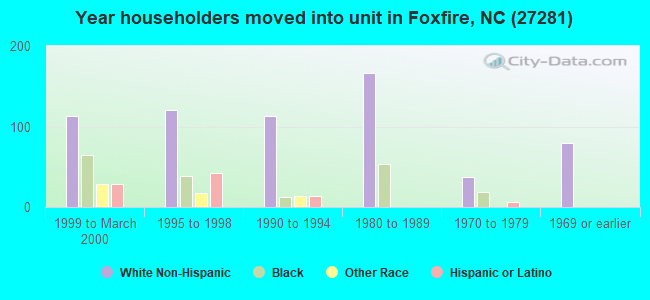
Length of stay since moving in above state average.
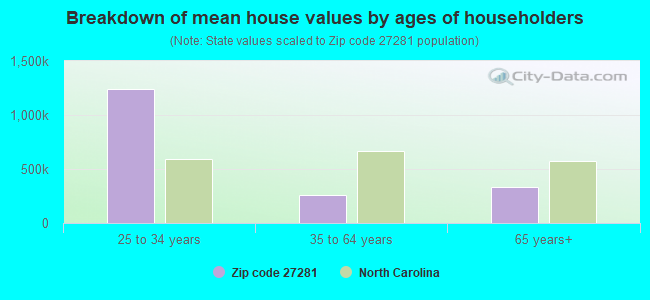
Estimated median house/condo value in 2022: $334,713
27281:
$334,713
North Carolina:
$280,600
According to our research of North Carolina and other state lists, there were 5 registered sex offenders living in 27281 zip code as of April 28, 2024. The ratio of all residents to sex offenders in zip code 27281 is 612 to 1. The ratio of registered sex offenders to all residents in this zip code is near the state average.
Median resident age:
This zip code:
48.6 years
North Carolina median age:
39.2 years
Average household size:
This zip code:
2.5 people
North Carolina:
2.4 people
Averages for the 2020 tax year for zip code 27281, filed in 2021:
Average Adjusted Gross Income (AGI) in 2020: $64,677 (Individual Income Tax Returns)
Here:
$64,677
State:
$70,020
Salary/wage: $54,571 (reported on 75.9% of returns)
Here:
$54,571
State:
$58,387
(% of AGI for various income ranges: 1163.4% for AGIs below $25k, 3344.8% for AGIs $25k-50k, 6045.7% for AGIs $50k-75k, 9807.1% for AGIs $75k-100k, 17092.7% for AGIs $100k-200k)
Taxable interest for individuals: $957 (reported on 35.8% of returns)
This zip code:
$957
North Carolina:
$1,479
(% of AGI for various income ranges: 19.4% for AGIs below $25k, 27.6% for AGIs $25k-50k, 54.3% for AGIs $50k-75k, 47.1% for AGIs $75k-100k, 93.6% for AGIs $100k-200k)
Ordinary dividends: $5,358 (reported on 19.0% of returns)
Here:
$5,358
State:
$7,888
(% of AGI for various income ranges: 51.2% for AGIs below $25k, 26.0% for AGIs $25k-50k, 90.7% for AGIs $50k-75k, 321.4% for AGIs $75k-100k, 384.5% for AGIs $100k-200k)
Net capital gain/loss in AGI: +$7,217 (reported on 17.5% of returns)
Here:
+$7,217
State:
+$23,652
(% of AGI for various income ranges: 12.5% for AGIs below $25k, 38.0% for AGIs $25k-50k, 120.7% for AGIs $50k-75k, 231.4% for AGIs $75k-100k, 634.5% for AGIs $100k-200k)
Profit/loss from business: +$13,665 (reported on 16.8% of returns)
Here:
+$13,665
State:
+$11,710
(% of AGI for various income ranges: 141.6% for AGIs below $25k, 190.0% for AGIs $25k-50k, 405.0% for AGIs $50k-75k, 554.3% for AGIs $75k-100k, 1145.5% for AGIs $100k-200k)
Taxable individual retirement arrangement distribution: $17,341 (reported on 12.4% of returns)
27281:
$17,341
North Carolina:
$20,247
(% of AGI for various income ranges: 72.5% for AGIs below $25k, 139.2% for AGIs $25k-50k, 555.0% for AGIs $50k-75k, 1446.4% for AGIs $100k-200k)
Total itemized deductions: $33,322 (reported on 6.6% of returns)
Here:
$33,322
State:
$34,549
(% of AGI for various income ranges: 723.6% for AGIs $50k-75k, 1002.7% for AGIs $100k-200k)
Charity contributions: $8,575 (reported on 5.8% of returns)
Here:
$8,575
State:
$13,360
(% of AGI for various income ranges: 48.8% for AGIs $25k-50k, 233.6% for AGIs $100k-200k)
Taxes paid: $7,456 (reported on 6.6% of returns)
27281:
$7,456
State:
$7,586
(% of AGI for various income ranges: 124.3% for AGIs $50k-75k, 252.7% for AGIs $100k-200k)
Earned income credit: $2,259 (reported on 16.1% of returns)
Here:
$2,259
State:
$2,337
(% of AGI for various income ranges: 95.9% for AGIs below $25k, 76.0% for AGIs $25k-50k)
Percentage of individuals using paid preparers for their 2020 taxes: 91.2%
Here:
91%
State:
93%
(% for various income ranges: 87.0% for AGIs below $25k, 93.8% for AGIs $25k-50k, 95.2% for AGIs $50k-75k, 91.7% for AGIs $75k-100k, 95.2% for AGIs $100k-200k, 80.0% for AGIs over 200k)
Averages for the 2012 tax year for zip code 27281, filed in 2013:
Average Adjusted Gross Income (AGI) in 2012: $49,743 (Individual Income Tax Returns)
Here:
$49,743
State:
$54,937
Salary/wage: $42,230 (reported on 75.5% of returns)
Here:
$42,230
State:
$46,336
(% of AGI for various income ranges: 70.9% for AGIs below $25k, 67.4% for AGIs $25k-50k, 66.9% for AGIs $50k-75k, 61.2% for AGIs $75k-100k, 60.5% for AGIs $100k-200k)
Taxable interest for individuals: $1,082 (reported on 37.7% of returns)
This zip code:
$1,082
North Carolina:
$1,298
(% of AGI for various income ranges: 1.3% for AGIs below $25k, 0.9% for AGIs $25k-50k, 0.7% for AGIs $50k-75k, 0.6% for AGIs $75k-100k, 0.8% for AGIs $100k-200k)
Ordinary dividends: $5,326 (reported on 21.7% of returns)
Here:
$5,326
State:
$6,213
(% of AGI for various income ranges: 1.9% for AGIs below $25k, 1.5% for AGIs $25k-50k, 1.9% for AGIs $50k-75k, 2.2% for AGIs $75k-100k, 3.0% for AGIs $100k-200k)
Net capital gain/loss in AGI: +$2,317 (reported on 17.0% of returns)
Here:
+$2,317
State:
+$12,740
(% of AGI for various income ranges: 0.5% for AGIs $50k-75k, 0.1% for AGIs $75k-100k, 1.7% for AGIs $100k-200k)
Profit/loss from business: +$10,506 (reported on 16.0% of returns)
Here:
+$10,506
State:
+$10,311
(% of AGI for various income ranges: 10.0% for AGIs below $25k, 2.7% for AGIs $25k-50k, 6.9% for AGIs $50k-75k, 1.5% for AGIs $100k-200k)
Taxable individual retirement arrangement distribution: $14,020 (reported on 14.2% of returns)
27281:
$14,020
North Carolina:
$15,575
(% of AGI for various income ranges: 4.1% for AGIs below $25k, 4.4% for AGIs $25k-50k, 8.1% for AGIs $50k-75k, 3.3% for AGIs $100k-200k)
Total itemized deductions: $21,989 (25% of AGI, reported on 34.0% of returns)
Here:
$21,989
State:
$23,438
Here:
25.0% of AGI
State:
21.5% of AGI
(% of AGI for various income ranges: 10.1% for AGIs below $25k, 13.3% for AGIs $25k-50k, 13.1% for AGIs $50k-75k, 18.4% for AGIs $75k-100k, 16.8% for AGIs $100k-200k)
Charity contributions: $3,519 (reported on 29.2% of returns)
Here:
$3,519
State:
$4,687
(% of AGI for various income ranges: 1.0% for AGIs below $25k, 1.7% for AGIs $25k-50k, 2.2% for AGIs $50k-75k, 2.7% for AGIs $75k-100k, 2.2% for AGIs $100k-200k)
Taxes paid: $7,464 (reported on 34.0% of returns)
27281:
$7,464
State:
$8,823
(% of AGI for various income ranges: 1.9% for AGIs below $25k, 2.7% for AGIs $25k-50k, 3.3% for AGIs $50k-75k, 5.4% for AGIs $75k-100k, 7.7% for AGIs $100k-200k)
Earned income credit: $2,355 (reported on 18.9% of returns)
Here:
$2,355
State:
$2,376
(% of AGI for various income ranges: 7.3% for AGIs below $25k, 0.7% for AGIs $25k-50k)
Percentage of individuals using paid preparers for their 2012 taxes: 59.4%
Here:
59%
State:
53%
(% for various income ranges: 60.5% for AGIs below $25k, 56.0% for AGIs $25k-50k, 62.5% for AGIs $50k-75k, 55.6% for AGIs $75k-100k, 61.5% for AGIs $100k-200k)
Averages for the 2004 tax year for zip code 27281, filed in 2005:
Average Adjusted Gross Income (AGI) in 2004: $37,022 (Individual Income Tax Returns)
Here:
$37,022
State:
$45,376
Salary/wage: $30,091 (reported on 77.9% of returns)
Here:
$30,091
State:
$39,442
(% of AGI for various income ranges: 87.2% for AGIs below $10k, 77.3% for AGIs $10k-25k, 71.8% for AGIs $25k-50k, 63.3% for AGIs $50k-75k, 62.4% for AGIs $75k-100k, 44.5% for AGIs over 100k)
Taxable interest for individuals: $1,767 (reported on 42.2% of returns)
This zip code:
$1,767
North Carolina:
$1,515
(% of AGI for various income ranges: 5.4% for AGIs below $10k, 2.7% for AGIs $10k-25k, 0.9% for AGIs $25k-50k, 1.8% for AGIs $50k-75k, 2.5% for AGIs $75k-100k, 2.3% for AGIs over 100k)
Taxable dividends: $4,880 (reported on 24.3% of returns)
Here:
$4,880
State:
$4,016
(% of AGI for various income ranges: 3.0% for AGIs below $10k, 1.8% for AGIs $10k-25k, 1.6% for AGIs $25k-50k, 3.3% for AGIs $50k-75k, 1.8% for AGIs $75k-100k, 6.5% for AGIs over 100k)
Net capital gain/loss: +$7,633 (reported on 18.5% of returns)
Here:
+$7,633
State:
+$11,152
(% of AGI for various income ranges: -2.6% for AGIs below $10k, 0.0% for AGIs $10k-25k, -0.3% for AGIs $25k-50k, 2.2% for AGIs $50k-75k, 3.7% for AGIs $75k-100k, 12.6% for AGIs over 100k)
Profit/loss from business: +$5,201 (reported on 16.8% of returns)
Here:
+$5,201
State:
+$9,490
(% of AGI for various income ranges: 4.3% for AGIs below $10k, 4.3% for AGIs $10k-25k, 5.0% for AGIs $25k-50k, 1.1% for AGIs $50k-75k, 1.5% for AGIs $75k-100k)
Profit/loss from farming: +$118 (reported on 2.0% of returns)
Here:
+$118
State:
-$3,231
IRA payment deduction: $2,158 (reported on 2.2% of returns)
27281:
$2,158
North Carolina:
$2,967
Total itemized deductions: $18,023 (27% of AGI, reported on 29.9% of returns)
Here:
$18,023
State:
$19,464
Here:
26.6% of AGI
State:
22.7% of AGI
(% of AGI for various income ranges: 14.3% for AGIs $10k-25k, 11.2% for AGIs $25k-50k, 15.1% for AGIs $50k-75k, 16.5% for AGIs $75k-100k, 17.9% for AGIs over 100k)
Charity contributions deductions: $3,338 (5% of AGI, reported on 26.6% of returns)
Here:
$3,338
State:
$4,035
Here:
4.7% of AGI
State:
4.5% of AGI
(% of AGI for various income ranges: 2.0% for AGIs $10k-25k, 1.7% for AGIs $25k-50k, 2.8% for AGIs $50k-75k, 2.5% for AGIs $75k-100k, 3.2% for AGIs over 100k)
Total tax: $4,483 (reported on 70.7% of returns)
27281:
$4,483
State:
$7,257
(% of AGI for various income ranges: 3.1% for AGIs below $10k, 3.5% for AGIs $10k-25k, 6.3% for AGIs $25k-50k, 8.2% for AGIs $50k-75k, 9.7% for AGIs $75k-100k, 14.0% for AGIs over 100k)
Earned income credit: $1,964 (reported on 22.8% of returns)
Here:
$1,964
State:
$1,851
Percentage of individuals using paid preparers for their 2004 taxes: 69.3%
Here:
69%
State:
62%
(% for various income ranges: 65.7% for AGIs below $10k, 65.7% for AGIs $10k-25k, 72.0% for AGIs $25k-50k, 73.5% for AGIs $50k-75k, 76.7% for AGIs $75k-100k, 69.4% for AGIs over 100k)
Household received Food Stamps/SNAP in the past 12 months: 97 Household did not receive Food Stamps/SNAP in the past 12 months: 1,204
Women who had a birth in the past 12 months: 8 (8 now married, 0 unmarried) Women who did not have a birth in the past 12 months: 624 (328 now married, 297 unmarried)
Housing units in zip code 27281 with a mortgage: 690 (13 second mortgage, 10 both second mortgage and home equity loan) Houses without a mortgage: 38
Median monthly owner costs for units with a mortgage: $1,691 Median monthly owner costs for units without a mortgage: $403
Residents with income below the poverty level in 2022:
This zip code:
3.5%
Whole state:
12.8%
Residents with income below 50% of the poverty level in 2022:
This zip code:
3.3%
Whole state:
6.8%
Median number of rooms in houses and condos:
Here:
6.7
State:
6.4
Median number of rooms in apartments:
Here:
4.0
State:
4.4
Notable locations in this zip code not listed on our city pages
Churches in zip code 27281 include: Taylor Memorial Church (A), Belford Church (B), Marcus Grove Church (C), Marshel Chapel (D), Jackson Springs Presbyterian Church (E), Center Church (F), New Bethel Church (G), Antioch Church (H), Pleasant Hill Methodist Church (I). Display/hide their locations on the map
Cemeteries: Taylor Memorial Cemetery (1), Providence Cemetery (2), Jackson Springs Cemetery (3), Pleasant Hill Cemetery (4), Marcus Grove Cemetery (5), Belford Cemetery (6). Display/hide their locations on the map
Reservoirs: Chappell Pond (A), North State Orchard Pond Number One (B), Ewing Lake (C), Cunningham Lake (D), Candor City Reservoir (E), Pools Pond (F), Currys Pond (G), Curries Pond (H). Display/hide their locations on the map
In group quarters: 8 (-1 institutionalized population)
Size of family households: 483 2-persons, 167 3-persons, 135 4-persons, 117 5-persons, 25 6-persons, 10 7-or-more-persons
Size of nonfamily households: 325 1-person, 27 2-persons, 16 3-persons
535 married couples with children.
122 single-parent households (122 women).
92.7% of residents of 27281 zip code speak English at home.
6.7% of residents speak Spanish at home (92% very well, 5% not well, 3% not at all).
0.2% of residents speak other Indo-European language at home (100% very well).
0.7% of residents speak Asian or Pacific Island language at home (100% very well).
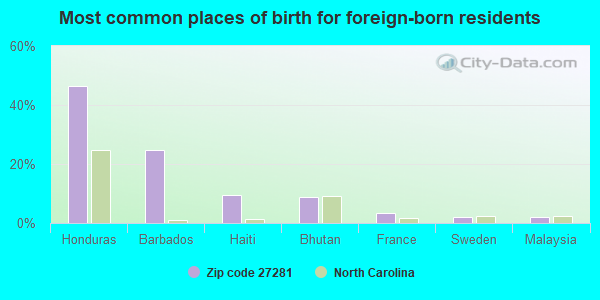
Foreign born population: 232 (7.0%) (33.6% of them are naturalized citizens)
This zip code:
7.0%
Whole state:
8.6%
47%Honduras
25%Barbados
9%Haiti
9%Bhutan
3%France
2%Sweden
2%Malaysia
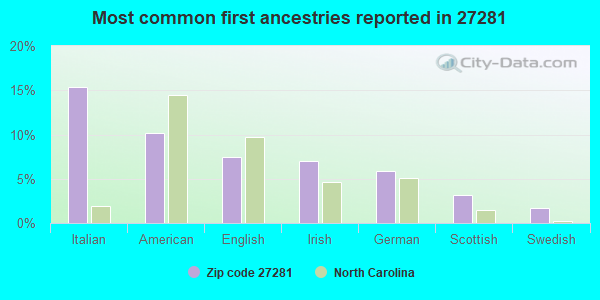
15%Italian
10%American
8%English
7%Irish
6%German
3%Scottish
2%Swedish
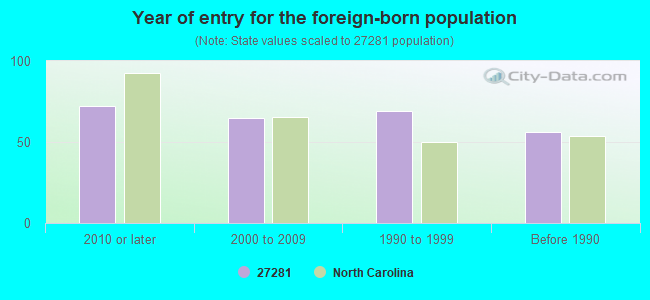
Year of entry for the foreign-born population
722010 or later
652000 to 2009
691990 to 1999
56Before 1990
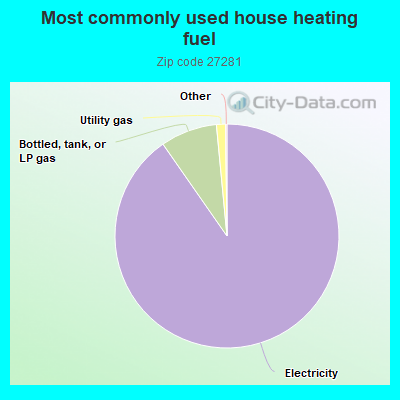
90.5%Electricity
8.2%Bottled, tank, or LP gas
1.3%Utility gas
Population in 1990: 2,167. Population change in the 1990s: +484 (+22.3%).
Place of birth for U.S.-born residents:
This state: 1,652
Northeast: 675
Midwest: 210
South: 441
West: 98
55% of the 27281 zip code residents lived in the same house 5 years ago. Out of people who lived in different houses, 57% lived in this county. Out of people who lived in different counties, 50% lived in North Carolina.
94% of the 27281 zip code residents lived in the same house 1 year ago. Out of people who lived in different houses, 35% moved from this county. Out of people who lived in different houses, 41% moved from different county within same state. Out of people who lived in different houses, 28% moved from different state. Out of people who lived in different houses, 2% moved from abroad.
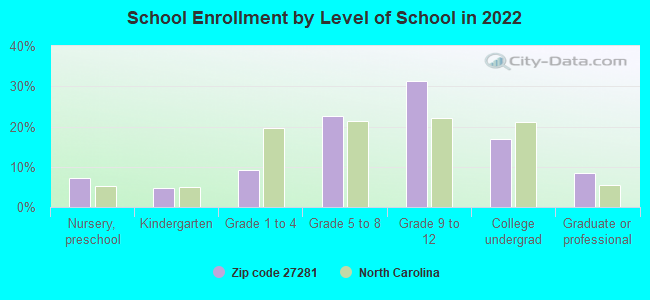
Private vs. public school enrollment:
Students in private schools in grades 1 to 8 (elementary and middle school): 20
Here:
7.9%
North Carolina:
13.8%
Students in private schools in grades 9 to 12 (high school): 22
Here:
8.9%
North Carolina:
11.9%
Students in private undergraduate colleges: 7
Here:
5.7%
North Carolina:
19.3%
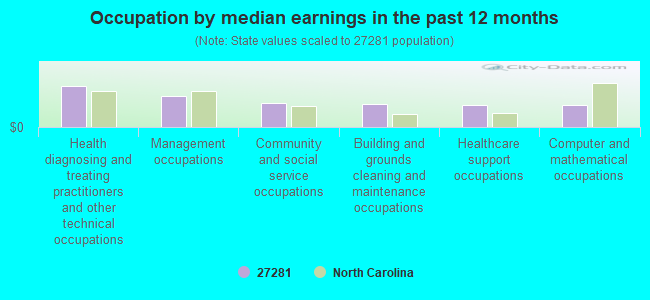
Occupation by median earnings in the past 12 months ($)
102,989Health diagnosing and treating practitioners and other technical occupations
77,750Management occupations
59,114Community and social service occupations
56,860Building and grounds cleaning and maintenance occupations
55,524Healthcare support occupations
55,410Computer and mathematical occupations
Companies with federal contracts located in this zip code:
SANDHILLS DOOR & HARDWARE INC (4911 HOFFMAN RD in JACKSON SPRING, NC; small business)
$21,864 with Army for Maintenance, Repair or Alteration of Real Property -- Other Non-Building Facilities. Signed on 2005-09-02. Completion date: 2005-10-01.
Top industries in this zip code by the number of employees in 2005:
Accommodation and Food Services: RV (Recreational Vehicle) Parks and Campgrounds (100-249 employees: 1 establishment)
Administrative and Support and Waste Management and Remediation Services: Janitorial Services (10-19: 1)
Construction: Commercial and Institutional Building Construction (10-19: 1)
Construction: Framing Contractors (5-9: 2)
Construction: Plumbing, Heating, and Air-Conditioning Contractors (5-9: 1, 1-4: 2)
Wholesale Trade: Industrial Machinery and Equipment Merchant Wholesalers (5-9: 1)
Other Services (except Public Administration): Religious Organizations (1-4: 1)
Construction: Siding Contractors (1-4: 1)
Administrative and Support and Waste Management and Remediation Services: Landscaping Services (1-4: 1)
Construction: Masonry Contractors (1-4: 1)
Fatal accident statistics in 2011:
Fatal accident count: 1
Vehicles involved in fatal accidents: 1
Fatal accidents caused by drunken drivers: 0
Fatalities: 1
Persons involved in fatal accidents: 1
Pedestrians involved in fatal accidents: 1
Fatal accident statistics in 2010:
Fatal accident count: 4
Vehicles involved in fatal accidents: 7
Fatal accidents caused by drunken drivers: 2
Fatalities: 4
Persons involved in fatal accidents: 10
Pedestrians involved in fatal accidents: 0
2004 - 2018 National Fire Incident Reporting System (NFIRS) incidents
Based on the data from the years 2004 - 2018 the average number of fires per year is 14. The highest number of fire incidents - 38 took place in 2011, and the least - 3 in 2004. The data has a growing trend.
When looking into fire subcategories, the most incidents belonged to: Outside Fires (51.9%), and Structure Fires (40.2%).
Fire incident types reported to NFIRS in Zip Code 27281


+$118
-$3,231
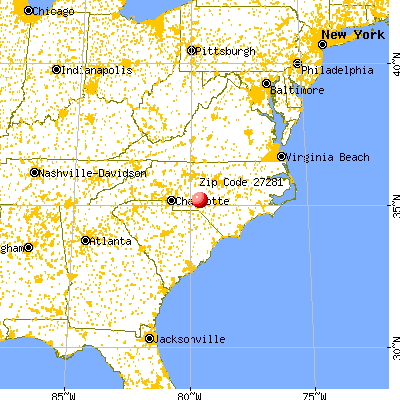
 Nearest zip codes: 28367, 27376, 28347, 27242, 28338, 28374.


 Based on the data from the years 2004 - 2018 the average number of fires per year is 14. The highest number of fire incidents - 38 took place in 2011, and the least - 3 in 2004. The data has a growing trend.
 When looking into fire subcategories, the most incidents belonged to: Outside Fires (51.9%), and Structure Fires (40.2%).