Estimated zip code population in 2022: 61,804 Zip code population in 2010: 41,937 Zip code population in 2000: 31,682
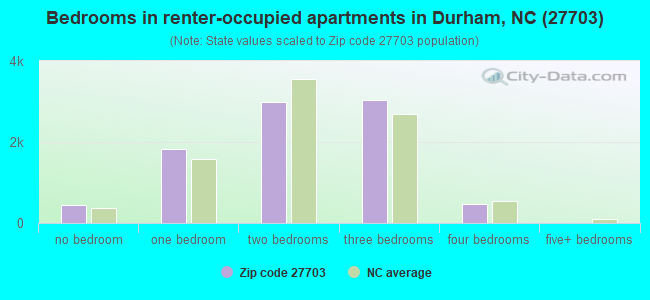
Houses and condos: 26,932 Renter-occupied apartments: 8,793
% of renters here:
34%
State:
33%
March 2022 cost of living index in zip code 27703: 93.9 (less than average, U.S. average is 100)
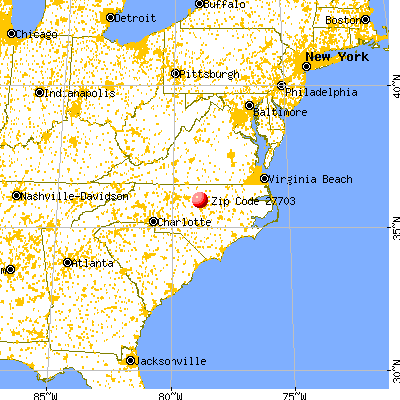
Land area: 54.6 sq. mi. Water area: 3.2 sq. mi.
Population density: 1,131 people per square mile
(low).
OSM Map
General Map
Google Map
MSN Map
OSM Map
General Map
Google Map
MSN Map
OSM Map
General Map
Google Map
MSN Map
OSM Map
General Map
Google Map
MSN Map
Please wait while loading the map...
Real estate property taxes paid for housing units in 2022:
This zip code:
0.8% ($2,756)
North Carolina:
0.6% ($1,769)
Median real estate property taxes paid for housing units with mortgages in 2022: $2,787 (0.8%) Median real estate property taxes paid for housing units with no mortgage in 2022: $2,501 (0.7%)
Averages for the 2020 tax year for zip code 27703, filed in 2021:
Average Adjusted Gross Income (AGI) in 2020: $63,714 (Individual Income Tax Returns)
Here:
$63,714
State:
$70,020
Salary/wage: $59,405 (reported on 84.3% of returns)
Here:
$59,405
State:
$58,387
(% of AGI for various income ranges: 1221.1% for AGIs below $25k, 4035.6% for AGIs $25k-50k, 7215.8% for AGIs $50k-75k, 10207.7% for AGIs $75k-100k, 18869.3% for AGIs $100k-200k, 63397.7% for AGIs over 200k)
Taxable interest for individuals: $914 (reported on 27.4% of returns)
This zip code:
$914
North Carolina:
$1,479
(% of AGI for various income ranges: 7.1% for AGIs below $25k, 11.3% for AGIs $25k-50k, 23.4% for AGIs $50k-75k, 45.0% for AGIs $75k-100k, 92.3% for AGIs $100k-200k, 603.8% for AGIs over 200k)
Ordinary dividends: $4,431 (reported on 17.3% of returns)
Here:
$4,431
State:
$7,888
(% of AGI for various income ranges: 12.8% for AGIs below $25k, 26.0% for AGIs $25k-50k, 64.7% for AGIs $50k-75k, 101.9% for AGIs $75k-100k, 272.7% for AGIs $100k-200k, 2503.3% for AGIs over 200k)
Net capital gain/loss in AGI: +$9,659 (reported on 16.2% of returns)
Here:
+$9,659
State:
+$23,652
(% of AGI for various income ranges: 4.8% for AGIs below $25k, 18.0% for AGIs $25k-50k, 57.2% for AGIs $50k-75k, 153.5% for AGIs $75k-100k, 430.4% for AGIs $100k-200k, 8004.9% for AGIs over 200k)
Profit/loss from business: +$8,727 (reported on 19.2% of returns)
Here:
+$8,727
State:
+$11,710
(% of AGI for various income ranges: 180.0% for AGIs below $25k, 157.6% for AGIs $25k-50k, 173.5% for AGIs $50k-75k, 152.2% for AGIs $75k-100k, 337.5% for AGIs $100k-200k, 3111.0% for AGIs over 200k)
Taxable individual retirement arrangement distribution: $22,753 (reported on 6.9% of returns)
27703:
$22,753
North Carolina:
$20,247
(% of AGI for various income ranges: 35.0% for AGIs below $25k, 66.0% for AGIs $25k-50k, 159.4% for AGIs $50k-75k, 311.7% for AGIs $75k-100k, 683.1% for AGIs $100k-200k, 3003.8% for AGIs over 200k)
Self-employed (Keogh) retirement plans: $22,691 (reported on 0.3% of returns)
27703:
$22,691
North Carolina:
$26,749
(% of AGI for various income ranges: 8.4% for AGIs $50k-75k, 27.3% for AGIs $100k-200k, 354.4% for AGIs over 200k)
Total itemized deductions: $26,194 (reported on 12.3% of returns)
Here:
$26,194
State:
$34,549
(% of AGI for various income ranges: 43.5% for AGIs below $25k, 151.1% for AGIs $25k-50k, 449.2% for AGIs $50k-75k, 815.0% for AGIs $75k-100k, 1366.0% for AGIs $100k-200k, 4518.2% for AGIs over 200k)
Charity contributions: $8,208 (reported on 9.8% of returns)
Here:
$8,208
State:
$13,360
(% of AGI for various income ranges: 4.8% for AGIs below $25k, 30.5% for AGIs $25k-50k, 89.4% for AGIs $50k-75k, 166.2% for AGIs $75k-100k, 358.2% for AGIs $100k-200k, 1643.3% for AGIs over 200k)
Taxes paid: $7,396 (reported on 12.3% of returns)
27703:
$7,396
State:
$7,586
(% of AGI for various income ranges: 7.3% for AGIs below $25k, 30.1% for AGIs $25k-50k, 117.7% for AGIs $50k-75k, 246.6% for AGIs $75k-100k, 438.0% for AGIs $100k-200k, 1138.7% for AGIs over 200k)
Earned income credit: $2,373 (reported on 16.4% of returns)
Here:
$2,373
State:
$2,337
(% of AGI for various income ranges: 118.1% for AGIs below $25k, 65.7% for AGIs $25k-50k, 0.6% for AGIs $50k-75k)
Percentage of individuals using paid preparers for their 2020 taxes: 90.5%
Here:
91%
State:
93%
(% for various income ranges: 87.6% for AGIs below $25k, 90.3% for AGIs $25k-50k, 91.3% for AGIs $50k-75k, 92.7% for AGIs $75k-100k, 93.4% for AGIs $100k-200k, 94.8% for AGIs over 200k)
Averages for the 2012 tax year for zip code 27703, filed in 2013:
Average Adjusted Gross Income (AGI) in 2012: $43,688 (Individual Income Tax Returns)
Here:
$43,688
State:
$54,937
Salary/wage: $41,598 (reported on 89.6% of returns)
Here:
$41,598
State:
$46,336
(% of AGI for various income ranges: 81.0% for AGIs below $25k, 89.6% for AGIs $25k-50k, 87.2% for AGIs $50k-75k, 87.0% for AGIs $75k-100k, 86.6% for AGIs $100k-200k, 62.5% for AGIs over 200k)
Taxable interest for individuals: $553 (reported on 22.3% of returns)
This zip code:
$553
North Carolina:
$1,298
(% of AGI for various income ranges: 0.3% for AGIs below $25k, 0.2% for AGIs $25k-50k, 0.3% for AGIs $50k-75k, 0.2% for AGIs $75k-100k, 0.3% for AGIs $100k-200k, 0.2% for AGIs over 200k)
Ordinary dividends: $2,146 (reported on 9.7% of returns)
Here:
$2,146
State:
$6,213
(% of AGI for various income ranges: 0.5% for AGIs below $25k, 0.2% for AGIs $25k-50k, 0.4% for AGIs $50k-75k, 0.4% for AGIs $75k-100k, 0.7% for AGIs $100k-200k, 1.2% for AGIs over 200k)
Net capital gain/loss in AGI: +$3,552 (reported on 7.0% of returns)
Here:
+$3,552
State:
+$12,740
(% of AGI for various income ranges: 0.1% for AGIs $50k-75k, 0.3% for AGIs $75k-100k, 0.9% for AGIs $100k-200k, 4.5% for AGIs over 200k)
Profit/loss from business: +$5,230 (reported on 18.1% of returns)
Here:
+$5,230
State:
+$10,311
(% of AGI for various income ranges: 8.5% for AGIs below $25k, 1.2% for AGIs $25k-50k, 1.1% for AGIs $50k-75k, 1.1% for AGIs $75k-100k, 1.3% for AGIs $100k-200k, 2.7% for AGIs over 200k)
Taxable individual retirement arrangement distribution: $12,542 (reported on 5.2% of returns)
27703:
$12,542
North Carolina:
$15,575
(% of AGI for various income ranges: 1.3% for AGIs below $25k, 1.0% for AGIs $25k-50k, 1.3% for AGIs $50k-75k, 1.7% for AGIs $75k-100k, 1.8% for AGIs $100k-200k, 2.9% for AGIs over 200k)
Self-employment retirement plans: $11,140 (reported on 0.2% of returns)
27703:
$11,140
North Carolina:
$21,078
Total itemized deductions: $19,622 (26% of AGI, reported on 35.2% of returns)
Here:
$19,622
State:
$23,438
Here:
25.9% of AGI
State:
21.5% of AGI
(% of AGI for various income ranges: 7.9% for AGIs below $25k, 13.2% for AGIs $25k-50k, 20.6% for AGIs $50k-75k, 18.7% for AGIs $75k-100k, 17.6% for AGIs $100k-200k, 12.9% for AGIs over 200k)
Charity contributions: $3,782 (reported on 29.2% of returns)
Here:
$3,782
State:
$4,687
(% of AGI for various income ranges: 1.1% for AGIs below $25k, 2.3% for AGIs $25k-50k, 3.0% for AGIs $50k-75k, 3.2% for AGIs $75k-100k, 2.9% for AGIs $100k-200k, 1.8% for AGIs over 200k)
Taxes paid: $6,625 (reported on 35.2% of returns)
27703:
$6,625
State:
$8,823
(% of AGI for various income ranges: 1.3% for AGIs below $25k, 3.4% for AGIs $25k-50k, 5.6% for AGIs $50k-75k, 6.8% for AGIs $75k-100k, 7.7% for AGIs $100k-200k, 7.4% for AGIs over 200k)
Earned income credit: $2,539 (reported on 24.7% of returns)
Here:
$2,539
State:
$2,376
(% of AGI for various income ranges: 9.4% for AGIs below $25k, 1.2% for AGIs $25k-50k)
Percentage of individuals using paid preparers for their 2012 taxes: 44.6%
Here:
45%
State:
53%
(% for various income ranges: 49.3% for AGIs below $25k, 41.0% for AGIs $25k-50k, 40.1% for AGIs $50k-75k, 41.1% for AGIs $75k-100k, 43.3% for AGIs $100k-200k, 63.2% for AGIs over 200k)
Averages for the 2004 tax year for zip code 27703, filed in 2005:
Average Adjusted Gross Income (AGI) in 2004: $39,164 (Individual Income Tax Returns)
Here:
$39,164
State:
$45,376
Salary/wage: $37,503 (reported on 89.6% of returns)
Here:
$37,503
State:
$39,442
(% of AGI for various income ranges: 108.1% for AGIs below $10k, 85.5% for AGIs $10k-25k, 90.7% for AGIs $25k-50k, 89.3% for AGIs $50k-75k, 90.2% for AGIs $75k-100k, 71.2% for AGIs over 100k)
Taxable interest for individuals: $788 (reported on 30.4% of returns)
This zip code:
$788
North Carolina:
$1,515
(% of AGI for various income ranges: 2.1% for AGIs below $10k, 1.0% for AGIs $10k-25k, 0.5% for AGIs $25k-50k, 0.5% for AGIs $50k-75k, 0.4% for AGIs $75k-100k, 0.7% for AGIs over 100k)
Taxable dividends: $1,199 (reported on 12.1% of returns)
Here:
$1,199
State:
$4,016
(% of AGI for various income ranges: 1.0% for AGIs below $10k, 0.4% for AGIs $10k-25k, 0.2% for AGIs $25k-50k, 0.3% for AGIs $50k-75k, 0.4% for AGIs $75k-100k, 0.5% for AGIs over 100k)
Net capital gain/loss: +$4,296 (reported on 9.3% of returns)
Here:
+$4,296
State:
+$11,152
(% of AGI for various income ranges: -0.8% for AGIs below $10k, 0.1% for AGIs $10k-25k, 0.1% for AGIs $25k-50k, 0.4% for AGIs $50k-75k, 0.5% for AGIs $75k-100k, 3.9% for AGIs over 100k)
Profit/loss from business: +$3,603 (reported on 14.8% of returns)
Here:
+$3,603
State:
+$9,490
(% of AGI for various income ranges: 7.2% for AGIs below $10k, 3.1% for AGIs $10k-25k, 1.2% for AGIs $25k-50k, 0.8% for AGIs $50k-75k, 1.0% for AGIs $75k-100k, 1.0% for AGIs over 100k)
IRA payment deduction: $2,385 (reported on 1.4% of returns)
27703:
$2,385
North Carolina:
$2,967
(% of AGI for various income ranges: 0.1% for AGIs $10k-25k, 0.1% for AGIs $25k-50k, 0.1% for AGIs $50k-75k, 0.1% for AGIs $75k-100k, 0.0% for AGIs over 100k)
Self-employed pension: $6,167 (reported on 0.2% of returns)
Here:
$6,167
North Carolina:
$14,754
Total itemized deductions: $17,208 (27% of AGI, reported on 40.8% of returns)
Here:
$17,208
State:
$19,464
Here:
26.6% of AGI
State:
22.7% of AGI
(% of AGI for various income ranges: 13.9% for AGIs below $10k, 10.6% for AGIs $10k-25k, 18.3% for AGIs $25k-50k, 20.7% for AGIs $50k-75k, 20.0% for AGIs $75k-100k, 17.4% for AGIs over 100k)
Charity contributions deductions: $3,362 (5% of AGI, reported on 35.8% of returns)
Here:
$3,362
State:
$4,035
Here:
5.0% of AGI
State:
4.5% of AGI
(% of AGI for various income ranges: 1.3% for AGIs below $10k, 1.7% for AGIs $10k-25k, 3.3% for AGIs $25k-50k, 3.7% for AGIs $50k-75k, 3.7% for AGIs $75k-100k, 2.6% for AGIs over 100k)
Total tax: $5,065 (reported on 67.8% of returns)
27703:
$5,065
State:
$7,257
(% of AGI for various income ranges: 3.1% for AGIs below $10k, 2.9% for AGIs $10k-25k, 5.8% for AGIs $25k-50k, 8.6% for AGIs $50k-75k, 10.0% for AGIs $75k-100k, 15.4% for AGIs over 100k)
Earned income credit: $1,913 (reported on 23.8% of returns)
Here:
$1,913
State:
$1,851
Percentage of individuals using paid preparers for their 2004 taxes: 51.7%
Here:
52%
State:
62%
(% for various income ranges: 47.7% for AGIs below $10k, 60.5% for AGIs $10k-25k, 50.2% for AGIs $25k-50k, 48.6% for AGIs $50k-75k, 47.0% for AGIs $75k-100k, 43.9% for AGIs over 100k)
Likely homosexual households (counted as self-reported same-sex unmarried-partner households)
Lesbian couples: 0.1% of all households
Gay men: 0.1% of all households
Household received Food Stamps/SNAP in the past 12 months: 2,929 Household did not receive Food Stamps/SNAP in the past 12 months: 22,785
Women who had a birth in the past 12 months: 728 (453 now married, 272 unmarried) Women who did not have a birth in the past 12 months: 15,188 (6,385 now married, 8,798 unmarried)
Housing units in zip code 27703 with a mortgage: 12,930 (732 second mortgage, 501 both second mortgage and home equity loan) Houses without a mortgage: 122
Median monthly owner costs for units with a mortgage: $1,552 Median monthly owner costs for units without a mortgage: $515
Residents with income below the poverty level in 2022:
This zip code:
10.3%
Whole state:
12.8%
Residents with income below 50% of the poverty level in 2022:
This zip code:
6.5%
Whole state:
6.8%
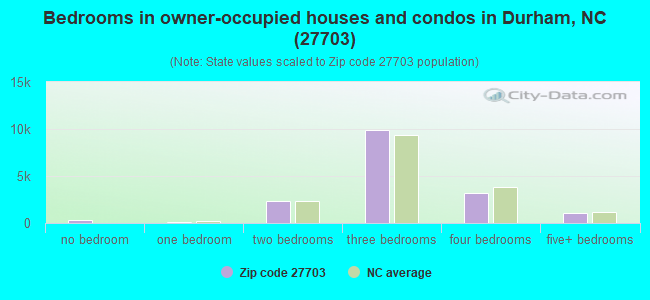
Median number of rooms in houses and condos:
Here:
6.3
State:
6.4
Median number of rooms in apartments:
Here:
4.4
State:
4.4
Notable locations in this zip code not listed on our city pages
6,745 married couples with children.
5,113 single-parent households (1,372 men, 3,741 women).
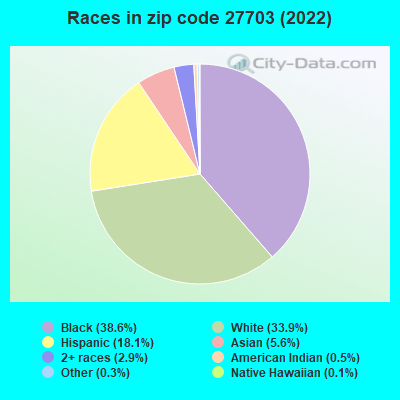
77.0% of residents of 27703 zip code speak English at home.
16.2% of residents speak Spanish at home (51% very well, 9% well, 14% not well, 26% not at all).
2.1% of residents speak other Indo-European language at home (78% very well, 17% well, 1% not well, 4% not at all).
4.4% of residents speak Asian or Pacific Island language at home (49% very well, 18% well, 7% not well, 26% not at all).
1.0% of residents speak other language at home (97% very well, 3% well).
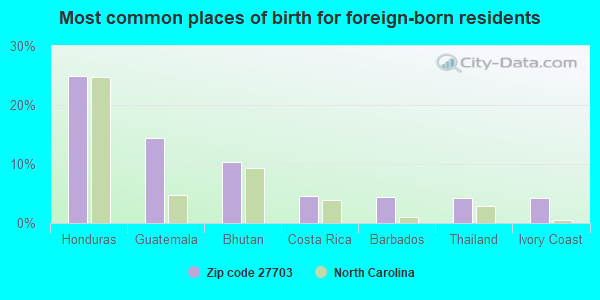
Foreign born population: 10,020 (16.2%) (38.1% of them are naturalized citizens)
Major facilities with environmental interests located in this zip code:
BRENNTAG SOUTHEAST, INCORPORATED (2000 EAST PETTIGREW STREET in DURHAM, NC)
AIR MINOR (AIRS/AFS) STATE MASTER (North Carolina facility info) - -115DA4YG006E6D64FBEQGCQX98, WASTEWATER FACILITY, -2088, AIR PROGRAM, -0-015890, UNDERGROUND STORAGE TANK PROGRAM, -1658, HAZARDOUS WASTE PROGRAM COMPLIANCE ACTIVITY (Tracking inspections of insecticide, fungicide, and rodenticide, and toxic substances) CRITERIA AND HAZARDOUS AIR POLLUTANT INVENTORY (Inventory of air pollution sources) National Pollutant Discharge Elimination System NON-MAJOR (Tracking pollutant discharge elimination systems) - permit HAZARDOUS WASTE BIENNIAL REPORTER (Resource Conservation and Recovery Act (tracking hazardous waste)) Large Quantity Generators, more that 1000 kg of hazardous waste/month (Resource Conservation and Recovery Act (tracking hazardous waste)) - notification TRANSPORTER (Resource Conservation and Recovery Act (tracking hazardous waste)) - notification TRI REPORTER (Tracking of toxic chemicals releasing facilities) Business SIC classification: CHEMICALS AND ALLIED PRODUCTS; NONCLASSIFIABLE ESTABLISHMENTS Organizations: BRENTAG SOUTHEAST (CONTACT/OPERATOR)
, BRENNTAG SOUTHEAST INC (CONTACT/OWNER)
Alternative names: BRENNTAG SE INC BRENNTAG DURHA, SOUTHCHEM INC
CHANDLER CONCRETE COMPANY (DURHAM-ELLIS ROAD PLANT #607 1014 ELLIS ROAD in DURHAM, NC)
AIR MINOR (AIRS/AFS) STATE MASTER (North Carolina facility info) - -115DA4YG00N27W64FBEN840A99, WASTEWATER FACILITY, -2107, AIR PROGRAM STATE MASTER (North Carolina facility info) - AIR PROGRAM Business SIC classification: READY-MIXED CONCRETE Business NAICS classification: ALL OTHER MISCELLANEOUS MANUFACTURING. Alternative names: CHANDLER CONCRETE COMPANY INCORPORATED
BUSINESS TELECOM, INC. (BTI) (CREEKSTONE CROSSING SVC CTR, 5400 S. MIAMI BLVD. in DURHAM, NC)
ENFORCEMENT/COMPLIANCE ACTIVITY (Integrated Compliance Information System) - ICIS-04-2003-9973, FORMAL ENFORCEMENT ACTION (Integrated Compliance Information System) - ICIS-04-2003-9973, FORMAL ENFORCEMENT ACTION
BFI WASTE SERVICES LIMITED LIABILITY COMPANY (5111 CHIN PAGE ROAD in DURHAM, NC)
AIR MINOR (AIRS/AFS) STATE MASTER (North Carolina facility info) - -115DA4YG00M69W84AY3WR0CYSR, WASTEWATER FACILITY, -2741, AIR PROGRAM National Pollutant Discharge Elimination System NON-MAJOR (Tracking pollutant discharge elimination systems) - permit Business SIC classification: LOCAL TRUCKING WITHOUT STORAGE Alternative names: BFI CENTRAL CAROLINA DISTRICT OFFICE **I, BFI WASTE SERVICES LLC, BROWNING FERRIS INDUSTRIES
BLUE CIRCLE CEMENT COMPANY (610 SOUTH HOOVER ROAD in DURHAM, NC)
AIR MINOR (AIRS/AFS) STATE MASTER (North Carolina facility info) - AIR PROGRAM CRITERIA AND HAZARDOUS AIR POLLUTANT INVENTORY (Inventory of air pollution sources) Business SIC classification: CEMENT, HYDRAULIC
BRINKLEY, RUBY P. - RESIDENCE (1114 MOCKINGBIRD LANE in DURHAM, NC)
STATE MASTER (North Carolina facility info) - -115DA4YG00M69W84AY3WG60VSC, WASTEWATER FACILITY National Pollutant Discharge Elimination System NON-MAJOR (Tracking pollutant discharge elimination systems) - permit Business SIC classification: SEWERAGE SYSTEMS Alternative names: BRINKLEY RUBY P SFR
ABF FREIGHT SYSTEM INCORPORATED (208 MULDEE STREET in DURHAM, NC)
STATE MASTER (North Carolina facility info) - UNDERGROUND STORAGE TANK PROGRAM, -115DA4YG00M29W84AX3X090EQ3, WASTEWATER FACILITY National Pollutant Discharge Elimination System NON-MAJOR (Tracking pollutant discharge elimination systems) - permit Business SIC classification: TRUCKING, EXCEPT LOCAL; NONCLASSIFIABLE ESTABLISHMENTS
BUNN BETTY-RESIDENCE (1137 COLEY ROAD in DURHAM, NC)
STATE MASTER (North Carolina facility info) - -115DA4YG00M69W84AY3W0266H9, WASTEWATER FACILITY National Pollutant Discharge Elimination System NON-MAJOR (Tracking pollutant discharge elimination systems) - permit Business SIC classification: SEWERAGE SYSTEMS Alternative names: BUNN, BETTY
CARY OIL COMPANY, INCORPORATED (5801 NORTH ROXBORO ROAD in DURHAM, NC)
STATE MASTER (North Carolina facility info) - -115DA4YG00M69W84AY3YR0GN8Q, WASTEWATER FACILITY National Pollutant Discharge Elimination System NON-MAJOR (Tracking pollutant discharge elimination systems) - permit Business SIC classification: NATURAL GAS TRANSMISSION; GASOLINE SERVICE STATIONS
CITY AUTO SALVAGE (1301 S. MIAMI BLVD. in DURHAM, NC)
STATE MASTER (North Carolina facility info) - -115DA4YG00PTXW64FBEQG9JC98, WASTEWATER FACILITY National Pollutant Discharge Elimination System NON-MAJOR (Tracking pollutant discharge elimination systems) - permit Business SIC classification: MOTOR VEHICLE PARTS, USED
DONALD, MIKA (1524 STALLINGS ROAD in DURHAM, NC)
STATE MASTER (North Carolina facility info) - -115DA4YG00TT7W64FBEP84TB19, WASTEWATER FACILITY National Pollutant Discharge Elimination System NON-MAJOR (Tracking pollutant discharge elimination systems) - permit Business SIC classification: SEWERAGE SYSTEMS
BAKERY FEEDS INCORPORATED (1017 SOUTH HOOVER ROAD in DURHAM, NC)
AIR SYNTHETIC MINOR (AIRS/AFS) STATE MASTER (North Carolina facility info) - -115DA4YG00M29W84AY3W8AGHRH, WASTEWATER FACILITY, -2128, AIR PROGRAM Business SIC classification: PREPARED FEEDS AND FEED INGREDIENTS FOR ANIMALS AND FOWLS, EXCEPT DOGS AND CATS; BREAD AND OTHER BAKERY PRODUCTS, EXCEPT COOKIES AND CRACKERS Business NAICS classification: ALL OTHER MISCELLANEOUS MANUFACTURING.
CHEROKEE SANFORD GRP DURHAM P (SOUTH HOOVER ROAD in DURHAM, NC)
AIR MAJOR (AIRS/AFS) STATE MASTER (North Carolina facility info) - UNDERGROUND STORAGE TANK PROGRAM Business SIC classification: BRICK AND STRUCTURAL CLAY TILE; NONCLASSIFIABLE ESTABLISHMENTS
Housing units lacking complete plumbing facilities: 0.7% Housing units lacking complete kitchen facilities: 0.5%
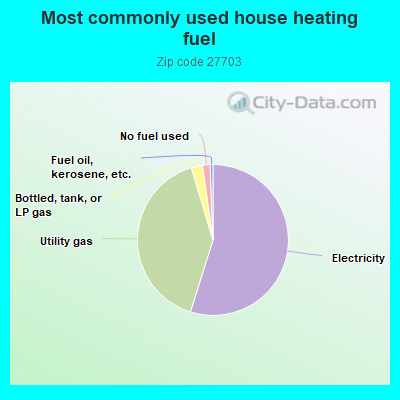
54.7%Electricity
40.4%Utility gas
2.4%Bottled, tank, or LP gas
1.6%No fuel used
0.6%Fuel oil, kerosene, etc.
Population in 1990: 24,362. Population change in the 1990s: +7,320 (+30.0%).
Place of birth for U.S.-born residents:
This state: 27,867
Northeast: 9,098
Midwest: 3,910
South: 7,937
West: 2,259
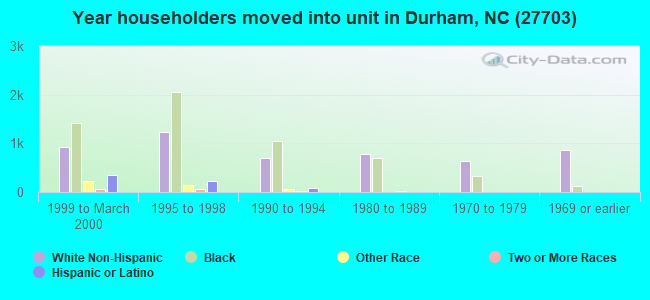
52% of the 27703 zip code residents lived in the same house 5 years ago. Out of people who lived in different houses, 60% lived in this county. Out of people who lived in different counties, 50% lived in North Carolina.
88% of the 27703 zip code residents lived in the same house 1 year ago. Out of people who lived in different houses, 22% moved from this county. Out of people who lived in different houses, 40% moved from different county within same state. Out of people who lived in different houses, 34% moved from different state. Out of people who lived in different houses, 9% moved from abroad.
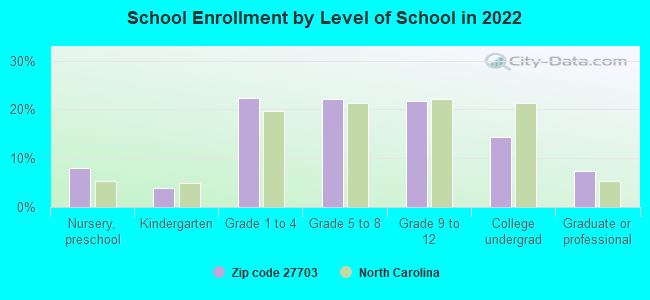
Private vs. public school enrollment:
Students in private schools in grades 1 to 8 (elementary and middle school): 344
Here:
6.1%
North Carolina:
13.8%
Students in private schools in grades 9 to 12 (high school): 260
Here:
9.4%
North Carolina:
11.9%
Students in private undergraduate colleges: 175
Here:
9.6%
North Carolina:
19.3%
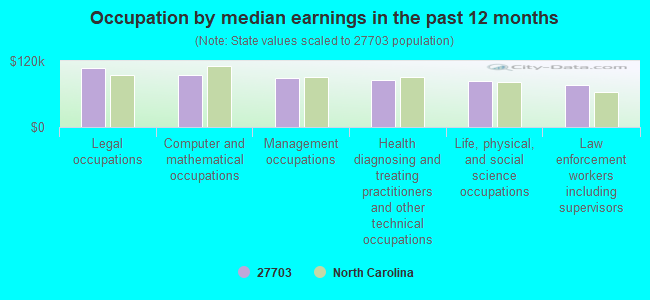
Occupation by median earnings in the past 12 months ($)
107,010Legal occupations
94,011Computer and mathematical occupations
89,053Management occupations
84,728Health diagnosing and treating practitioners and other technical occupations
83,470Life, physical, and social science occupations
75,740Law enforcement workers including supervisors
Companies with biggest federal contracts located in this zip code (DURHAM, NC):
CREE, INC (4600 SILICON DRIVE) : $78,499,092 in 129 contractsfrom 2000 to 2006
Contracts for Other Defense -- Applied Research and Exploratory Development (R&D), Other Defense -- Advanced Development (R&D), Defense Electronics and Communication Equipment -- Applied Research and Exploratory Development (R&D), Other Defense -- Basic Research (R&D), and moreby Navy, Army, Air Force, NASA, and others Signed by year:2000: $5,497,778; 2001: $1,788,358; 2002: $26,201,543; 2003: $17,695,878; 2004: $9,293,984; 2005: $17,651,577; 2006: $369,974.
Biggest contracts:
$6,668,055 with Navy for Other Defense -- Applied Research and Exploratory Development (R&D). Signed on 2005-06-20. Completion date: 2006-11-26.
$5,036,261, same as above.Signed on 2002-06-28. Completion date: 2003-12-27.
$4,000,000 with Army for Other Defense -- Advanced Development (R&D). Signed on 2003-12-19. Completion date: 2004-01-31.
$4,000,000, same as above.Signed on 2002-03-20. Completion date: 2004-01-31.
MITTS NITTS INC (1014 S HOOVER RD; small business) : $14,918,817 in 87 contractsfrom 1999 to 2006
Contracts for Outerwear, Men's, Outerwear, Women's, Clothing, Special Purpose, Yarn and Thread by Defense Logistics Agency, Bureau of Prisoners/Federal Prison System, Army Signed by year:2000: $1,681,742; 2001: $2,808,918; 2002: $2,927,964; 2003: $32,558; 2004: $3,338,143; 2005: $2,281,765; 2006: $1,083,878.
Biggest contracts:
$1,247,234 with Defense Logistics Agency for Outerwear, Men's. Signed on 2002-07-09. Completion date: 2003-06-24.
$959,923, same as above.Signed on 2004-05-27. Completion date: 2005-04-21.
$890,292 with Defense Logistics Agency for Outerwear, Women's. Signed on 2002-07-25. Completion date: 2003-08-07.
$534,888, same as above.Signed on 1999-12-06. Completion date: 2000-08-23.
SIGNAL INNOVATIONS GROUP INC (1009 SLATER RD , STE 200; small business) : $3,180,230 in 19 contractsfrom 2005 to 2006
Contracts for Defense Electronics and Communication Equipment -- Applied Research and Exploratory Development (R&D), Other Defense -- Applied Research and Exploratory Development (R&D), Defense Electronics and Communication Equipment -- Operational Systems Development (R&D), Other Environmental Protection -- Basic Research (R&D), and moreby Air Force, Navy, Army Signed by year:2000: $0; 2001: $0; 2002: $0; 2003: $0; 2004: $0; 2005: $1,181,069; 2006: $1,999,161.
Biggest contracts:
$386,631 with Air Force for Defense Electronics and Communication Equipment -- Applied Research and Exploratory Development (R&D). Signed on 2006-03-27. Completion date: 2007-01-31.
$383,337 with Navy for Other Defense -- Applied Research and Exploratory Development (R&D). Signed on 2005-08-24. Completion date: 2006-08-15.
$350,000 with Air Force for Defense Electronics and Communication Equipment -- Applied Research and Exploratory Development (R&D). Signed on 2005-09-07. Completion date: 2007-01-31.
$324,276 with Air Force for Defense Electronics and Communication Equipment -- Operational Systems Development (R&D). Signed on 2006-04-14. Completion date: 2008-07-01.
SIGMA-K CORPORATION (511 CLAYTON RD; small business) : $722,419 in 6 contractsfrom 2002 to 2005
Contracts for Textiles, Clothing and Equipage -- Advanced Development (R&D), Other Community Services and Development -- Engineering Development (R&D), Other Defense -- Operational Systems Development (R&D), Research and Development Facilities, and moreby Army, Centers for Disease Control and Prevention, Air Force Signed by year:2000: $0; 2001: $0; 2002: $98,000; 2003: $0; 2004: $266,806; 2005: $357,613; 2006: $0.
Biggest contracts:
$327,769 with Army for Textiles, Clothing and Equipage -- Advanced Development (R&D). Signed on 2005-04-22. Completion date: 2007-05-04.
$99,670 with Centers for Disease Control and Prevention for Other Community Services and Development -- Engineering Development (R&D). Signed on 2004-08-03. Completion date: 2004-11-30.
$98,948 with Air Force for Other Defense -- Operational Systems Development (R&D). Signed on 2004-05-24. Completion date: 2006-02-24.
$98,000 with Centers for Disease Control and Prevention for Research and Development Facilities. Signed on 2002-09-15. Completion date: 2002-09-15.
$220,188 with U.S. Army Corps of Engineers - civil program financing only for Telephone and/or Communications Services (includes Telegraph, Telex, and Cablevision Services). Taking place in WV. Signed on 2000-10-01. Completion date: 2001-09-30.
$220,188, same as above.Signed on 2000-04-10. Completion date: 2000-09-30.
$0, same as above.Signed on 2000-10-01. Completion date: 2001-09-30.
-$53,489, same as above.Signed on 2000-09-25. Completion date: 2000-09-30.
SIMULATION TECHNOLOGIES INC (1539 COOPER ST; small business) : $327,825 in 5 contractsfrom 2001 to 2004
Contracts for Hydraulic and Pneumatic Presses, Power Driven, Valves, Nonpowered, Vehicular Brake, Steering, Axle, Wheel, and Track Components by U.S. Army Corps of Engineers - civil program financing only, United States Coast Guard (disused code: now 7008), Defense Logistics Agency, Army, and others Signed by year:2000: $0; 2001: $43,000; 2002: $272,432; 2003: $1,906; 2004: $10,487; 2005: $0; 2006: $0.
Biggest contracts:
$272,432 with U.S. Army Corps of Engineers - civil program financing only for Hydraulic and Pneumatic Presses, Power Driven. Signed on 2002-03-06. Completion date: 2002-12-17.
$43,000 with United States Coast Guard (disused code: now 7008) for Valves, Nonpowered. Signed on 2001-03-15. Completion date: 2001-04-15.
$6,670 with Defense Logistics Agency for Vehicular Brake, Steering, Axle, Wheel, and Track Components. Signed on 2004-12-03. Completion date: 2005-01-03.
$3,817 with Army for Valves, Nonpowered. Signed on 2004-01-12. Completion date: 2003-07-30.
ELUMENS CORPORATION (1301 SOUTH BRIGGS AVENUE,; small business) : $203,383 in 5 contractsfrom 2001 to 2004
Contracts for Photographic Projection Equipment, Training Aids by NASA, ENERGY, Department of, Army, Navy, and others Signed by year:2000: $0; 2001: $134,000; 2002: $27,700; 2003: $0; 2004: $41,683; 2005: $0; 2006: $0.
Biggest contracts:
$76,000 with NASA for Photographic Projection Equipment. Signed on 2001-09-15. Completion date: 2001-10-15.
$58,000 with ENERGY, Department of for Photographic Projection Equipment. Signed on 2001-07-15. Completion date: 2001-08-15.
$41,683 with Army for Photographic Projection Equipment. Taking place in MI. Signed on 2004-03-01. Completion date: 2004-04-30.
$27,700 with Navy for Training Aids. Taking place in MD. Signed on 2002-05-03. Completion date: 2002-05-07.
WILLIAMS SCOTSMAN, INC (905 ELLIS ROAD) : $51,463 in 5 contractsfrom 2002 to 2006
Contracts for Lease or Rental of Facilities -- Miscellaneous Buildings, Lease or Rental of Equipment -- Ground Effect Vehicles, Motor Vehicles, Trailers, and Cycles, Office Furniture by Army Signed by year:2000: $0; 2001: $0; 2002: $9,000; 2003: $722; 2004: $0; 2005: $0; 2006: $41,741.
Biggest contracts:
$41,741 with Army for Lease or Rental of Facilities -- Miscellaneous Buildings. Signed on 2006-04-25. Completion date: 2006-10-31.
$6,000 with Army for Lease or Rental of Equipment -- Ground Effect Vehicles, Motor Vehicles, Trailers, and Cycles. Signed on 2002-07-08. Completion date: 2002-11-07.
$3,000, same as above.Signed on 2002-05-22. Completion date: 2001-12-31.
$722 with Army for Office Furniture. Taking place in CA. Signed on 2003-09-23. Completion date: 2003-08-01.
J&D SERVICES INC (2700 ANGIER AVE; small business) : $30,374 in 2 contractsin 2003
$30,374 with U.S. Special Operations Command for Other Housekeeping Services. Signed on 2003-12-05. Completion date: 2004-09-30.
$0, same as above.Signed on 2003-12-05. Completion date: 2004-09-30.
IMPERIAL HOTEL GROUP INC (4700 IMPERIAL BLVD; small business) : $9,901 in 3 contractsfrom 2003 to 2005
$6,072 with Army for Lodging - Hotel/Motel. Signed on 2004-08-02. Completion date: 2004-07-31.
$3,729, same as above.Signed on 2005-06-06. Completion date: 2005-08-27.
$100 with Federal Technology Service for Lodging - Hotel/Motel. Signed on 2003-05-15. Completion date: 2006-09-15.
Top industries in this zip code by the number of employees in 2005:
Administrative and Support and Waste Management and Remediation Services: Temporary Help Services (500-999 employees: 1 establishment, 100-249 employees: 2 establishments, 50-99 employees: 3 establishments, 20-49 employees: 2 establishments, 10-19 employees: 1 establishment, 5-9 employees: 2 establishments, 1-4 employees: 4 establishments)
Professional, Scientific, and Technical Services: Research and Development in the Physical, Engineering, and Life Sciences (100-249: 1, 50-99: 1, 20-49: 5, 10-19: 1, 5-9: 2, 1-4: 3)
Professional, Scientific, and Technical Services: Research and Development in the Social Sciences and Humanities (250-499: 1, 50-99: 1)
Health Care and Social Assistance: Vocational Rehabilitation Services (250-499: 1)
People in group quarters in 2010:
116 people in nursing facilities/skilled-nursing facilities
43 people in group homes intended for adults
41 people in residential treatment centers for adults
12 people in group homes for juveniles (non-correctional)
11 people in emergency and transitional shelters (with sleeping facilities) for people experiencing homelessness
People in group quarters in 2000:
119 people in other noninstitutional group quarters
43 people in nursing homes
18 people in homes for the mentally retarded
4 people in other nonhousehold living situations
2 people in homes for the mentally ill
Home Mortgage Disclosure Act Aggregated Statistics For Year 2009 (Based on 2 full and 16 partial tracts)
A) FHA, FSA/RHS & VA Home Purchase Loans
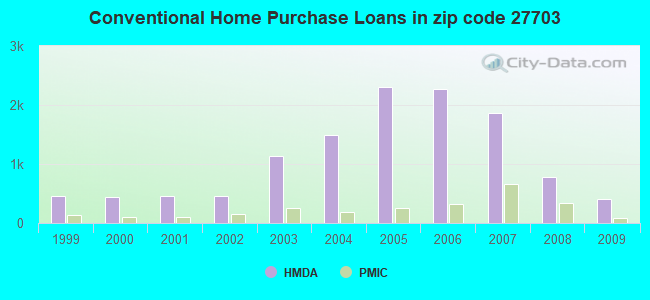
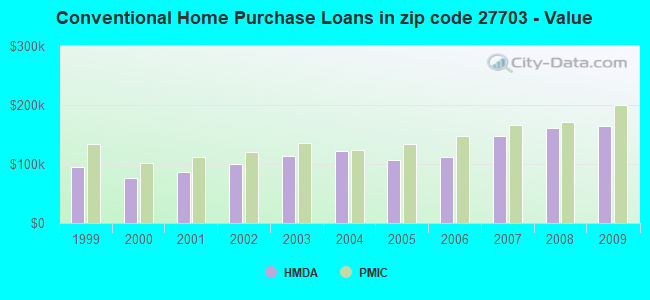
B) Conventional Home Purchase Loans
C) Refinancings
D) Home Improvement Loans
E) Loans on Dwellings For 5+ Families
F) Non-occupant Loans on < 5 Family Dwellings (A B C & D)
G) Loans On Manufactured Home Dwelling (A B C & D)
Number
Average Value
Number
Average Value
Number
Average Value
Number
Average Value
Number
Average Value
Number
Average Value
Number
Average Value
LOANS ORIGINATED
383
$172,484
399
$163,823
1,374
$160,587
52
$36,596
2
$7,162,085
132
$89,699
8
$113,472
APPLICATIONS APPROVED, NOT ACCEPTED
30
$161,569
30
$173,625
110
$150,586
6
$71,168
2
$29,785
12
$65,112
1
$47,770
APPLICATIONS DENIED
70
$130,520
92
$100,316
630
$154,633
57
$41,104
0
$0
77
$87,432
9
$60,143
APPLICATIONS WITHDRAWN
58
$171,610
68
$179,478
334
$159,110
10
$46,820
2
$30,266,390
12
$62,044
3
$71,023
FILES CLOSED FOR INCOMPLETENESS
20
$151,566
8
$154,154
106
$161,964
4
$19,485
0
$0
1
$99,090
0
$0
Aggregated Statistics For Year 2008 (Based on 2 full and 16 partial tracts)
A) FHA, FSA/RHS & VA Home Purchase Loans
B) Conventional Home Purchase Loans
C) Refinancings
D) Home Improvement Loans
E) Loans on Dwellings For 5+ Families
F) Non-occupant Loans on < 5 Family Dwellings (A B C & D)
G) Loans On Manufactured Home Dwelling (A B C & D)
Number
Average Value
Number
Average Value
Number
Average Value
Number
Average Value
Number
Average Value
Number
Average Value
Number
Average Value
LOANS ORIGINATED
337
$172,242
774
$161,525
950
$148,352
60
$36,743
7
$4,518,610
255
$99,625
13
$76,734
APPLICATIONS APPROVED, NOT ACCEPTED
33
$186,598
69
$135,747
179
$128,151
14
$26,090
0
$0
34
$86,891
11
$59,891
APPLICATIONS DENIED
110
$175,083
174
$120,266
900
$140,063
186
$63,919
0
$0
115
$95,142
22
$50,536
APPLICATIONS WITHDRAWN
76
$191,928
161
$153,610
352
$153,782
22
$62,366
0
$0
53
$92,206
4
$37,928
FILES CLOSED FOR INCOMPLETENESS
15
$142,083
29
$146,548
75
$140,490
7
$30,076
0
$0
11
$96,873
0
$0
Aggregated Statistics For Year 2007 (Based on 2 full and 16 partial tracts)
A) FHA, FSA/RHS & VA Home Purchase Loans
B) Conventional Home Purchase Loans
C) Refinancings
D) Home Improvement Loans
E) Loans on Dwellings For 5+ Families
F) Non-occupant Loans on < 5 Family Dwellings (A B C & D)
G) Loans On Manufactured Home Dwelling (A B C & D)
Number
Average Value
Number
Average Value
Number
Average Value
Number
Average Value
Number
Average Value
Number
Average Value
Number
Average Value
LOANS ORIGINATED
176
$172,423
1,860
$147,452
1,057
$124,030
120
$41,690
6
$982,495
417
$100,976
11
$43,844
APPLICATIONS APPROVED, NOT ACCEPTED
12
$169,517
189
$131,519
280
$121,321
32
$36,482
0
$0
39
$77,469
11
$39,857
APPLICATIONS DENIED
68
$186,040
395
$122,355
1,305
$126,840
265
$52,176
0
$0
239
$87,376
30
$51,449
APPLICATIONS WITHDRAWN
36
$170,355
257
$142,386
528
$132,440
41
$68,292
3
$1,516,660
88
$82,281
1
$59,400
FILES CLOSED FOR INCOMPLETENESS
9
$165,831
62
$139,045
94
$144,931
2
$13,140
0
$0
31
$102,662
4
$122,840
Aggregated Statistics For Year 2006 (Based on 2 full and 16 partial tracts)
A) FHA, FSA/RHS & VA Home Purchase Loans
B) Conventional Home Purchase Loans
C) Refinancings
D) Home Improvement Loans
E) Loans on Dwellings For 5+ Families
F) Non-occupant Loans on < 5 Family Dwellings (A B C & D)
G) Loans On Manufactured Home Dwelling (A B C & D)
Number
Average Value
Number
Average Value
Number
Average Value
Number
Average Value
Number
Average Value
Number
Average Value
Number
Average Value
LOANS ORIGINATED
207
$157,183
2,276
$111,063
1,180
$102,128
156
$50,238
2
$2,569,040
640
$80,645
21
$64,299
APPLICATIONS APPROVED, NOT ACCEPTED
11
$156,079
214
$105,075
271
$99,759
26
$29,922
0
$0
62
$62,323
11
$47,597
APPLICATIONS DENIED
37
$149,997
512
$100,899
1,183
$113,294
223
$46,750
0
$0
218
$71,592
42
$54,551
APPLICATIONS WITHDRAWN
23
$156,516
357
$122,550
593
$118,074
67
$102,277
0
$0
106
$95,821
2
$55,455
FILES CLOSED FOR INCOMPLETENESS
7
$121,089
74
$103,418
183
$142,833
10
$81,061
0
$0
22
$85,111
0
$0
Aggregated Statistics For Year 2005 (Based on 2 full and 16 partial tracts)
A) FHA, FSA/RHS & VA Home Purchase Loans
B) Conventional Home Purchase Loans
C) Refinancings
D) Home Improvement Loans
E) Loans on Dwellings For 5+ Families
F) Non-occupant Loans on < 5 Family Dwellings (A B C & D)
G) Loans On Manufactured Home Dwelling (A B C & D)
Number
Average Value
Number
Average Value
Number
Average Value
Number
Average Value
Number
Average Value
Number
Average Value
Number
Average Value
LOANS ORIGINATED
186
$150,037
2,304
$105,934
1,239
$105,570
108
$50,506
4
$3,712,310
565
$83,179
19
$49,163
APPLICATIONS APPROVED, NOT ACCEPTED
21
$128,959
272
$92,708
272
$98,846
26
$49,795
0
$0
63
$77,271
17
$36,130
APPLICATIONS DENIED
28
$146,295
481
$90,969
1,237
$109,827
171
$41,881
0
$0
189
$72,330
68
$61,948
APPLICATIONS WITHDRAWN
34
$152,909
407
$113,289
605
$123,805
51
$85,413
2
$26,280
101
$90,775
6
$105,735
FILES CLOSED FOR INCOMPLETENESS
7
$141,167
59
$97,614
248
$118,496
7
$75,521
0
$0
23
$67,864
0
$0
Aggregated Statistics For Year 2004 (Based on 2 full and 16 partial tracts)
A) FHA, FSA/RHS & VA Home Purchase Loans
B) Conventional Home Purchase Loans
C) Refinancings
D) Home Improvement Loans
E) Loans on Dwellings For 5+ Families
F) Non-occupant Loans on < 5 Family Dwellings (A B C & D)
G) Loans On Manufactured Home Dwelling (A B C & D)
Number
Average Value
Number
Average Value
Number
Average Value
Number
Average Value
Number
Average Value
Number
Average Value
Number
Average Value
LOANS ORIGINATED
315
$138,878
1,494
$121,557
1,301
$108,338
89
$35,172
1
$196,560
447
$84,942
20
$59,908
APPLICATIONS APPROVED, NOT ACCEPTED
17
$121,256
168
$116,714
283
$103,508
30
$35,067
0
$0
56
$78,816
15
$55,720
APPLICATIONS DENIED
35
$124,595
323
$102,069
1,125
$105,978
180
$41,004
0
$0
165
$86,709
40
$67,013
APPLICATIONS WITHDRAWN
29
$127,035
248
$115,400
572
$116,651
35
$53,523
0
$0
63
$89,276
9
$89,030
FILES CLOSED FOR INCOMPLETENESS
6
$126,988
34
$145,948
169
$115,522
3
$32,967
0
$0
8
$99,140
5
$114,276
Aggregated Statistics For Year 2003 (Based on 2 full and 16 partial tracts)
A) FHA, FSA/RHS & VA Home Purchase Loans
B) Conventional Home Purchase Loans
C) Refinancings
D) Home Improvement Loans
E) Loans on Dwellings For 5+ Families
F) Non-occupant Loans on < 5 Family Dwellings (A B C & D)
Number
Average Value
Number
Average Value
Number
Average Value
Number
Average Value
Number
Average Value
Number
Average Value
LOANS ORIGINATED
276
$137,578
1,128
$114,319
2,292
$114,250
72
$26,557
2
$290,905
390
$72,431
APPLICATIONS APPROVED, NOT ACCEPTED
13
$118,057
132
$104,512
339
$104,623
16
$24,072
0
$0
57
$66,343
APPLICATIONS DENIED
37
$137,032
209
$84,123
1,156
$102,541
98
$19,654
0
$0
108
$77,399
APPLICATIONS WITHDRAWN
32
$143,094
143
$113,914
595
$115,306
25
$26,585
0
$0
65
$81,809
FILES CLOSED FOR INCOMPLETENESS
2
$149,570
27
$117,681
85
$103,772
3
$19,773
0
$0
11
$82,026
Aggregated Statistics For Year 2002 (Based on 14 partial tracts)
A) FHA, FSA/RHS & VA Home Purchase Loans
B) Conventional Home Purchase Loans
C) Refinancings
D) Home Improvement Loans
E) Loans on Dwellings For 5+ Families
F) Non-occupant Loans on < 5 Family Dwellings (A B C & D)
Number
Average Value
Number
Average Value
Number
Average Value
Number
Average Value
Number
Average Value
Number
Average Value
LOANS ORIGINATED
159
$123,411
454
$100,685
985
$101,661
83
$35,213
4
$611,448
254
$69,309
APPLICATIONS APPROVED, NOT ACCEPTED
13
$121,488
71
$81,580
209
$92,299
10
$24,232
0
$0
32
$60,663
APPLICATIONS DENIED
24
$114,430
203
$77,465
598
$84,542
108
$18,090
0
$0
75
$56,015
APPLICATIONS WITHDRAWN
10
$130,634
53
$80,613
301
$97,484
24
$23,410
0
$0
36
$59,967
FILES CLOSED FOR INCOMPLETENESS
7
$132,209
11
$99,518
59
$100,931
2
$16,845
0
$0
8
$73,026
Aggregated Statistics For Year 2001 (Based on 14 partial tracts)
A) FHA, FSA/RHS & VA Home Purchase Loans
B) Conventional Home Purchase Loans
C) Refinancings
D) Home Improvement Loans
E) Loans on Dwellings For 5+ Families
F) Non-occupant Loans on < 5 Family Dwellings (A B C & D)
Number
Average Value
Number
Average Value
Number
Average Value
Number
Average Value
Number
Average Value
Number
Average Value
LOANS ORIGINATED
219
$114,061
459
$86,755
879
$94,530
83
$27,683
6
$415,242
235
$64,748
APPLICATIONS APPROVED, NOT ACCEPTED
13
$122,758
81
$60,014
176
$86,724
20
$26,921
0
$0
15
$68,447
APPLICATIONS DENIED
16
$117,046
235
$60,245
571
$79,855
115
$16,413
0
$0
71
$57,005
APPLICATIONS WITHDRAWN
24
$103,494
82
$86,868
326
$91,026
19
$30,094
0
$0
23
$64,106
FILES CLOSED FOR INCOMPLETENESS
2
$142,860
7
$102,467
52
$89,158
1
$25,960
0
$0
5
$58,106
Aggregated Statistics For Year 2000 (Based on 14 partial tracts)
A) FHA, FSA/RHS & VA Home Purchase Loans
B) Conventional Home Purchase Loans
C) Refinancings
D) Home Improvement Loans
E) Loans on Dwellings For 5+ Families
F) Non-occupant Loans on < 5 Family Dwellings (A B C & D)
Number
Average Value
Number
Average Value
Number
Average Value
Number
Average Value
Number
Average Value
Number
Average Value
LOANS ORIGINATED
264
$111,216
438
$75,993
416
$74,741
64
$15,881
2
$197,100
125
$47,066
APPLICATIONS APPROVED, NOT ACCEPTED
27
$66,731
77
$72,986
110
$74,040
24
$15,660
0
$0
15
$62,155
APPLICATIONS DENIED
51
$79,284
311
$54,786
478
$71,675
127
$15,919
0
$0
49
$58,626
APPLICATIONS WITHDRAWN
26
$95,688
74
$73,844
245
$71,916
14
$26,388
0
$0
27
$57,412
FILES CLOSED FOR INCOMPLETENESS
4
$115,028
27
$72,041
39
$67,424
0
$0
0
$0
9
$66,824
Aggregated Statistics For Year 1999 (Based on 1 full and 7 partial tracts)
A) FHA, FSA/RHS & VA Home Purchase Loans
B) Conventional Home Purchase Loans
C) Refinancings
D) Home Improvement Loans
E) Loans on Dwellings For 5+ Families
F) Non-occupant Loans on < 5 Family Dwellings (A B C & D)
2002 - 2018 National Fire Incident Reporting System (NFIRS) incidents
Based on the data from the years 2002 - 2018 the average number of fire incidents per year is 161. The highest number of fire incidents - 328 took place in 2010, and the least - 15 in 2003. The data has an increasing trend.
When looking into fire subcategories, the most reports belonged to: Structure Fires (42.3%), and Outside Fires (34.0%).
Fire incident types reported to NFIRS in Zip Code 27703


 Nearest zip codes: 27709, 27617, 27704, 27701, 27613, 27560.
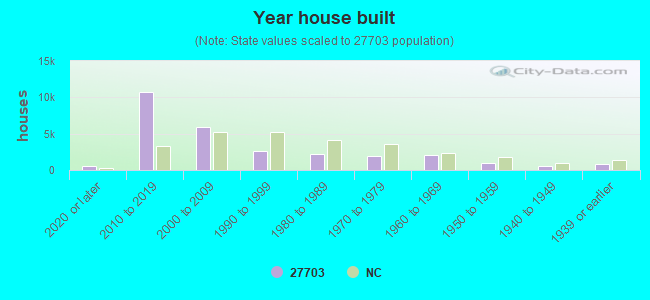


 Based on the data from the years 2002 - 2018 the average number of fire incidents per year is 161. The highest number of fire incidents - 328 took place in 2010, and the least - 15 in 2003. The data has an increasing trend.
 When looking into fire subcategories, the most reports belonged to: Structure Fires (42.3%), and Outside Fires (34.0%).