Estimated zip code population in 2022: 58,405 Zip code population in 2010: 46,660 Zip code population in 2000: 30,903
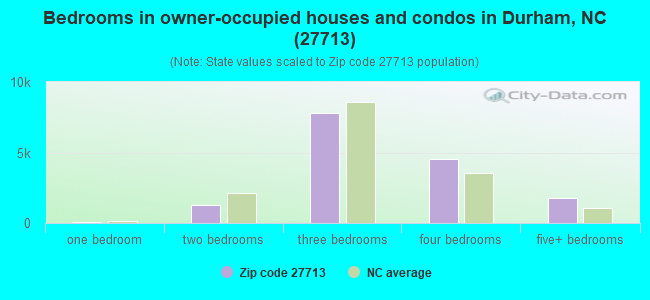
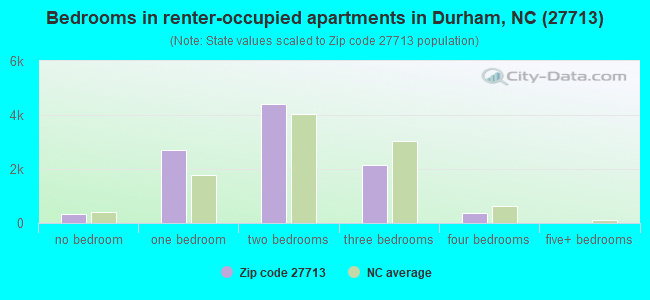
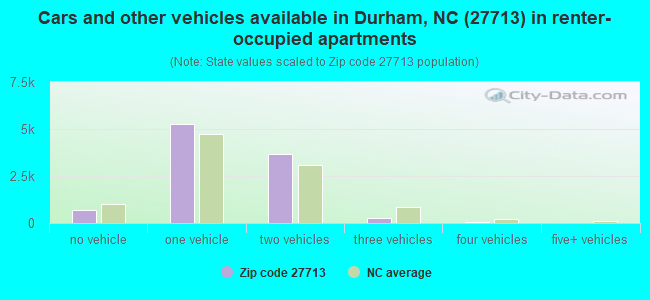
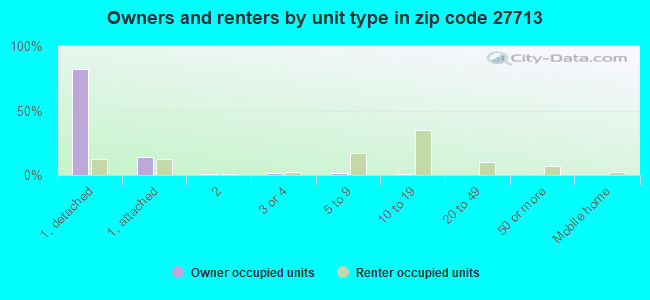
Houses and condos: 26,157 Renter-occupied apartments: 9,980
% of renters here:
39%
State:
33%
March 2022 cost of living index in zip code 27713: 94.2 (less than average, U.S. average is 100)
Land area: 32.6 sq. mi. Water area: 0.4 sq. mi.
Population density: 1,793 people per square mile
(low).
OSM Map
General Map
Google Map
MSN Map
OSM Map
General Map
Google Map
MSN Map
OSM Map
General Map
Google Map
MSN Map
OSM Map
General Map
Google Map
MSN Map
Please wait while loading the map...
Real estate property taxes paid for housing units in 2022:
This zip code:
0.8% ($3,278)
North Carolina:
0.6% ($1,769)
Median real estate property taxes paid for housing units with mortgages in 2022: $3,150 (0.8%) Median real estate property taxes paid for housing units with no mortgage in 2022: $3,524 (0.9%)
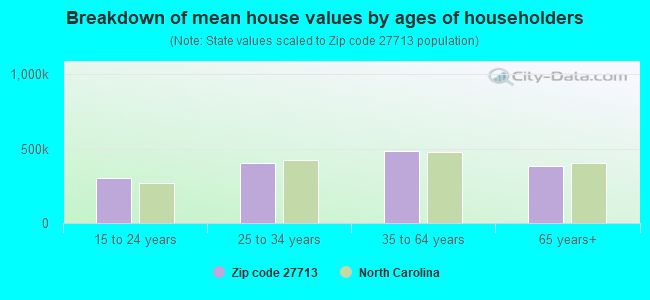
Estimated median house/condo value in 2022: $401,847
27713:
$401,847
North Carolina:
$280,600
According to our research of North Carolina and other state lists, there were 26 registered sex offenders living in 27713 zip code as of April 27, 2024. The ratio of all residents to sex offenders in zip code 27713 is 2,035 to 1. The ratio of registered sex offenders to all residents in this zip code is much lower than the state average.
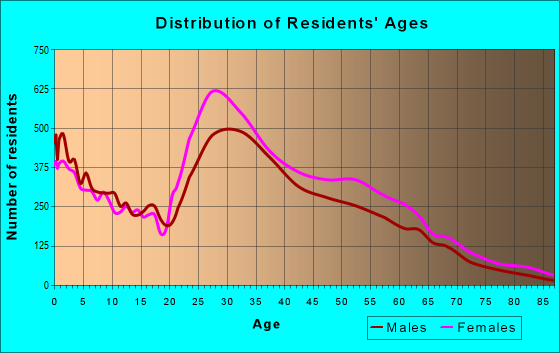
Median resident age:
This zip code:
35.3 years
North Carolina median age:
39.2 years
Average household size:
This zip code:
2.3 people
North Carolina:
2.4 people
Averages for the 2020 tax year for zip code 27713, filed in 2021:
Average Adjusted Gross Income (AGI) in 2020: $84,039 (Individual Income Tax Returns)
Here:
$84,039
State:
$70,020
Salary/wage: $74,520 (reported on 86.3% of returns)
Here:
$74,520
State:
$58,387
(% of AGI for various income ranges: 1220.1% for AGIs below $25k, 3957.2% for AGIs $25k-50k, 7157.0% for AGIs $50k-75k, 10798.9% for AGIs $75k-100k, 20649.0% for AGIs $100k-200k, 87027.7% for AGIs over 200k)
Taxable interest for individuals: $952 (reported on 35.7% of returns)
This zip code:
$952
North Carolina:
$1,479
(% of AGI for various income ranges: 11.5% for AGIs below $25k, 11.8% for AGIs $25k-50k, 28.4% for AGIs $50k-75k, 47.3% for AGIs $75k-100k, 103.1% for AGIs $100k-200k, 599.0% for AGIs over 200k)
Ordinary dividends: $5,095 (reported on 23.8% of returns)
Here:
$5,095
State:
$7,888
(% of AGI for various income ranges: 18.4% for AGIs below $25k, 34.4% for AGIs $25k-50k, 68.1% for AGIs $50k-75k, 143.6% for AGIs $75k-100k, 341.0% for AGIs $100k-200k, 2777.2% for AGIs over 200k)
Net capital gain/loss in AGI: +$17,864 (reported on 21.5% of returns)
Here:
+$17,864
State:
+$23,652
(% of AGI for various income ranges: 8.5% for AGIs below $25k, 33.5% for AGIs $25k-50k, 76.5% for AGIs $50k-75k, 162.1% for AGIs $75k-100k, 505.4% for AGIs $100k-200k, 14205.6% for AGIs over 200k)
Profit/loss from business: +$11,647 (reported on 18.3% of returns)
Here:
+$11,647
State:
+$11,710
(% of AGI for various income ranges: 114.2% for AGIs below $25k, 134.9% for AGIs $25k-50k, 174.8% for AGIs $50k-75k, 349.8% for AGIs $75k-100k, 498.3% for AGIs $100k-200k, 3429.7% for AGIs over 200k)
Taxable individual retirement arrangement distribution: $20,634 (reported on 6.9% of returns)
27713:
$20,634
North Carolina:
$20,247
(% of AGI for various income ranges: 35.8% for AGIs below $25k, 72.9% for AGIs $25k-50k, 144.9% for AGIs $50k-75k, 272.3% for AGIs $75k-100k, 527.0% for AGIs $100k-200k, 1660.2% for AGIs over 200k)
Self-employed (Keogh) retirement plans: $26,494 (reported on 1.1% of returns)
27713:
$26,494
North Carolina:
$26,749
(% of AGI for various income ranges: 2.9% for AGIs $25k-50k, 27.4% for AGIs $75k-100k, 47.0% for AGIs $100k-200k, 1019.0% for AGIs over 200k)
Total itemized deductions: $28,843 (reported on 12.8% of returns)
Here:
$28,843
State:
$34,549
(% of AGI for various income ranges: 65.8% for AGIs below $25k, 142.4% for AGIs $25k-50k, 367.5% for AGIs $50k-75k, 717.5% for AGIs $75k-100k, 1252.4% for AGIs $100k-200k, 5407.7% for AGIs over 200k)
Charity contributions: $10,868 (reported on 10.5% of returns)
Here:
$10,868
State:
$13,360
(% of AGI for various income ranges: 5.7% for AGIs below $25k, 28.1% for AGIs $25k-50k, 72.0% for AGIs $50k-75k, 145.4% for AGIs $75k-100k, 373.6% for AGIs $100k-200k, 2443.9% for AGIs over 200k)
Taxes paid: $7,763 (reported on 12.8% of returns)
27713:
$7,763
State:
$7,586
(% of AGI for various income ranges: 9.8% for AGIs below $25k, 28.1% for AGIs $25k-50k, 99.8% for AGIs $50k-75k, 221.4% for AGIs $75k-100k, 405.9% for AGIs $100k-200k, 1184.3% for AGIs over 200k)
Earned income credit: $2,157 (reported on 12.6% of returns)
Here:
$2,157
State:
$2,337
(% of AGI for various income ranges: 91.7% for AGIs below $25k, 52.6% for AGIs $25k-50k, 0.6% for AGIs $50k-75k)
Percentage of individuals using paid preparers for their 2020 taxes: 91.8%
Here:
92%
State:
93%
(% for various income ranges: 90.2% for AGIs below $25k, 91.9% for AGIs $25k-50k, 92.2% for AGIs $50k-75k, 91.9% for AGIs $75k-100k, 92.9% for AGIs $100k-200k, 93.5% for AGIs over 200k)
Averages for the 2012 tax year for zip code 27713, filed in 2013:
Average Adjusted Gross Income (AGI) in 2012: $64,524 (Individual Income Tax Returns)
Here:
$64,524
State:
$54,937
Salary/wage: $58,103 (reported on 89.3% of returns)
Here:
$58,103
State:
$46,336
(% of AGI for various income ranges: 81.4% for AGIs below $25k, 87.6% for AGIs $25k-50k, 83.2% for AGIs $50k-75k, 83.8% for AGIs $75k-100k, 84.6% for AGIs $100k-200k, 64.2% for AGIs over 200k)
Taxable interest for individuals: $815 (reported on 38.7% of returns)
This zip code:
$815
North Carolina:
$1,298
(% of AGI for various income ranges: 0.5% for AGIs below $25k, 0.3% for AGIs $25k-50k, 0.4% for AGIs $50k-75k, 0.5% for AGIs $75k-100k, 0.4% for AGIs $100k-200k, 0.8% for AGIs over 200k)
Ordinary dividends: $3,670 (reported on 21.7% of returns)
Here:
$3,670
State:
$6,213
(% of AGI for various income ranges: 1.1% for AGIs below $25k, 0.7% for AGIs $25k-50k, 0.8% for AGIs $50k-75k, 0.9% for AGIs $75k-100k, 1.1% for AGIs $100k-200k, 2.4% for AGIs over 200k)
Net capital gain/loss in AGI: +$8,247 (reported on 16.4% of returns)
Here:
+$8,247
State:
+$12,740
(% of AGI for various income ranges: 0.2% for AGIs $25k-50k, 0.3% for AGIs $50k-75k, 0.5% for AGIs $75k-100k, 0.9% for AGIs $100k-200k, 8.3% for AGIs over 200k)
Profit/loss from business: +$11,372 (reported on 17.1% of returns)
Here:
+$11,372
State:
+$10,311
(% of AGI for various income ranges: 6.7% for AGIs below $25k, 2.1% for AGIs $25k-50k, 2.2% for AGIs $50k-75k, 2.7% for AGIs $75k-100k, 2.7% for AGIs $100k-200k, 3.8% for AGIs over 200k)
Taxable individual retirement arrangement distribution: $14,971 (reported on 7.2% of returns)
27713:
$14,971
North Carolina:
$15,575
(% of AGI for various income ranges: 1.8% for AGIs below $25k, 1.4% for AGIs $25k-50k, 1.6% for AGIs $50k-75k, 1.8% for AGIs $75k-100k, 1.7% for AGIs $100k-200k, 1.8% for AGIs over 200k)
Self-employment retirement plans: $19,814 (reported on 1.2% of returns)
27713:
$19,814
North Carolina:
$21,078
(% of AGI for various income ranges: 0.1% for AGIs $25k-50k, 0.1% for AGIs $75k-100k, 0.4% for AGIs $100k-200k, 1.1% for AGIs over 200k)
Total itemized deductions: $21,951 (21% of AGI, reported on 44.9% of returns)
Here:
$21,951
State:
$23,438
Here:
20.8% of AGI
State:
21.5% of AGI
(% of AGI for various income ranges: 10.1% for AGIs below $25k, 12.1% for AGIs $25k-50k, 16.3% for AGIs $50k-75k, 17.5% for AGIs $75k-100k, 17.3% for AGIs $100k-200k, 13.8% for AGIs over 200k)
Charity contributions: $3,869 (reported on 37.8% of returns)
Here:
$3,869
State:
$4,687
(% of AGI for various income ranges: 1.1% for AGIs below $25k, 1.7% for AGIs $25k-50k, 2.4% for AGIs $50k-75k, 2.6% for AGIs $75k-100k, 2.6% for AGIs $100k-200k, 2.1% for AGIs over 200k)
Taxes paid: $9,378 (reported on 44.8% of returns)
27713:
$9,378
State:
$8,823
(% of AGI for various income ranges: 2.7% for AGIs below $25k, 3.3% for AGIs $25k-50k, 5.6% for AGIs $50k-75k, 7.1% for AGIs $75k-100k, 8.0% for AGIs $100k-200k, 7.9% for AGIs over 200k)
Earned income credit: $2,158 (reported on 14.3% of returns)
Here:
$2,158
State:
$2,376
(% of AGI for various income ranges: 6.1% for AGIs below $25k, 0.7% for AGIs $25k-50k)
Percentage of individuals using paid preparers for their 2012 taxes: 38.9%
Here:
39%
State:
53%
(% for various income ranges: 39.7% for AGIs below $25k, 34.3% for AGIs $25k-50k, 38.1% for AGIs $50k-75k, 39.0% for AGIs $75k-100k, 40.7% for AGIs $100k-200k, 61.4% for AGIs over 200k)
Averages for the 2004 tax year for zip code 27713, filed in 2005:
Average Adjusted Gross Income (AGI) in 2004: $52,592 (Individual Income Tax Returns)
Here:
$52,592
State:
$45,376
Salary/wage: $50,014 (reported on 91.4% of returns)
Here:
$50,014
State:
$39,442
(% of AGI for various income ranges: 124.6% for AGIs below $10k, 87.5% for AGIs $10k-25k, 90.2% for AGIs $25k-50k, 88.5% for AGIs $50k-75k, 89.1% for AGIs $75k-100k, 82.7% for AGIs over 100k)
Taxable interest for individuals: $821 (reported on 46.0% of returns)
This zip code:
$821
North Carolina:
$1,515
(% of AGI for various income ranges: 2.5% for AGIs below $10k, 0.8% for AGIs $10k-25k, 0.7% for AGIs $25k-50k, 0.6% for AGIs $50k-75k, 0.6% for AGIs $75k-100k, 0.8% for AGIs over 100k)
Taxable dividends: $1,531 (reported on 25.2% of returns)
Here:
$1,531
State:
$4,016
(% of AGI for various income ranges: 2.7% for AGIs below $10k, 0.6% for AGIs $10k-25k, 0.6% for AGIs $25k-50k, 0.6% for AGIs $50k-75k, 0.6% for AGIs $75k-100k, 0.9% for AGIs over 100k)
Net capital gain/loss: +$5,251 (reported on 19.6% of returns)
Here:
+$5,251
State:
+$11,152
(% of AGI for various income ranges: -0.9% for AGIs below $10k, 0.2% for AGIs $10k-25k, 0.3% for AGIs $25k-50k, 0.6% for AGIs $50k-75k, 0.7% for AGIs $75k-100k, 4.4% for AGIs over 100k)
Profit/loss from business: +$7,222 (reported on 15.3% of returns)
Here:
+$7,222
State:
+$9,490
(% of AGI for various income ranges: -3.5% for AGIs below $10k, 2.8% for AGIs $10k-25k, 1.3% for AGIs $25k-50k, 1.8% for AGIs $50k-75k, 1.7% for AGIs $75k-100k, 2.8% for AGIs over 100k)
IRA payment deduction: $2,758 (reported on 2.4% of returns)
27713:
$2,758
North Carolina:
$2,967
(% of AGI for various income ranges: 0.2% for AGIs below $10k, 0.2% for AGIs $10k-25k, 0.2% for AGIs $25k-50k, 0.1% for AGIs $50k-75k, 0.1% for AGIs $75k-100k, 0.1% for AGIs over 100k)
Self-employed pension: $11,943 (reported on 1.0% of returns)
Here:
$11,943
North Carolina:
$14,754
(% of AGI for various income ranges: 0.1% for AGIs $25k-50k, 0.1% for AGIs $50k-75k, 0.1% for AGIs $75k-100k, 0.5% for AGIs over 100k)
Total itemized deductions: $18,524 (23% of AGI, reported on 50.2% of returns)
Here:
$18,524
State:
$19,464
Here:
23.1% of AGI
State:
22.7% of AGI
(% of AGI for various income ranges: 17.2% for AGIs below $10k, 11.4% for AGIs $10k-25k, 16.2% for AGIs $25k-50k, 20.3% for AGIs $50k-75k, 20.0% for AGIs $75k-100k, 17.2% for AGIs over 100k)
Charity contributions deductions: $3,323 (4% of AGI, reported on 44.4% of returns)
Here:
$3,323
State:
$4,035
Here:
4.0% of AGI
State:
4.5% of AGI
(% of AGI for various income ranges: 1.3% for AGIs below $10k, 1.6% for AGIs $10k-25k, 2.3% for AGIs $25k-50k, 2.8% for AGIs $50k-75k, 2.8% for AGIs $75k-100k, 3.3% for AGIs over 100k)
Total tax: $7,555 (reported on 79.4% of returns)
27713:
$7,555
State:
$7,257
(% of AGI for various income ranges: 3.2% for AGIs below $10k, 3.7% for AGIs $10k-25k, 7.3% for AGIs $25k-50k, 9.6% for AGIs $50k-75k, 10.8% for AGIs $75k-100k, 16.1% for AGIs over 100k)
Earned income credit: $1,793 (reported on 12.7% of returns)
Here:
$1,793
State:
$1,851
Percentage of individuals using paid preparers for their 2004 taxes: 42.7%
Here:
43%
State:
62%
(% for various income ranges: 39.3% for AGIs below $10k, 49.1% for AGIs $10k-25k, 41.0% for AGIs $25k-50k, 41.4% for AGIs $50k-75k, 40.7% for AGIs $75k-100k, 43.8% for AGIs over 100k)
Likely homosexual households (counted as self-reported same-sex unmarried-partner households)
Lesbian couples: 0.6% of all households
Gay men: 0.1% of all households
Household received Food Stamps/SNAP in the past 12 months: 2,147 Household did not receive Food Stamps/SNAP in the past 12 months: 23,134
Women who had a birth in the past 12 months: 750 (660 now married, 102 unmarried) Women who did not have a birth in the past 12 months: 16,125 (6,557 now married, 9,559 unmarried)
Housing units in zip code 27713 with a mortgage: 11,835 (1,118 second mortgage, 36 home equity loan, 968 both second mortgage and home equity loan) Houses without a mortgage: 134
Median monthly owner costs for units with a mortgage: $1,719 Median monthly owner costs for units without a mortgage: $610
Residents with income below the poverty level in 2022:
This zip code:
7.9%
Whole state:
12.8%
Residents with income below 50% of the poverty level in 2022:
This zip code:
3.6%
Whole state:
6.8%
Median number of rooms in houses and condos:
Here:
6.9
State:
6.4
Median number of rooms in apartments:
Here:
4.0
State:
4.4
Notable locations in this zip code not listed on our city pages
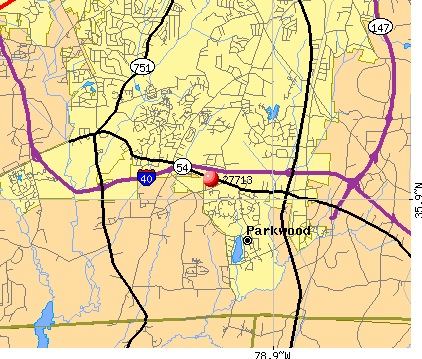
Notable locations in zip code 27713: Parkwood Branch Durham County Public Library (A), Durham Fire Station Number 4 (B), Durham Fire Station Number 12 (C). Display/hide their locations on the map
Churches in zip code 27713 include: World Overcomers Christian Church (A), Trinity Convergence Church (B), The New Shiloh Holiness Church (C), Religious Science Church of the Triangle (D), Reconciliation United Methodist Church (E), Parkwood United Methodist Church (F), Parkwood Baptist Church (G), North East Baptist Church Annex (H), New Metropolitan Baptist Church (I). Display/hide their locations on the map
Reservoirs: Frazier Lake (A), Straford Lake Number Two (B), Straford Lake Number One (C), Lake Elton (D), Roycroft Lake (E), Noname (F), Parkwood Lake (G). Display/hide their locations on the map
Streams, rivers, and creeks: Burdens Creek (A), Buck Branch (B), Third Fork Creek (C), Panther Creek (D), Nancy Branch (E), Morris Branch (F), Little Creek (G), Kit Creek (H). Display/hide their locations on the map
8,089 married couples with children.
3,740 single-parent households (782 men, 2,958 women).
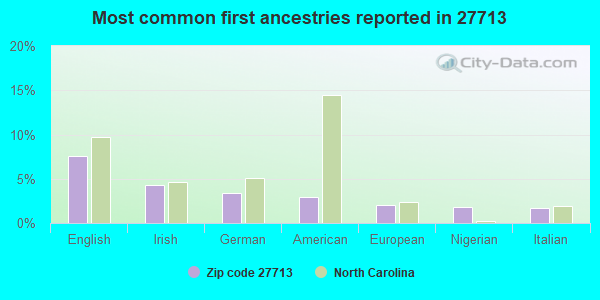
83.3% of residents of 27713 zip code speak English at home.
8.1% of residents speak Spanish at home (65% very well, 14% well, 6% not well, 15% not at all).
3.0% of residents speak other Indo-European language at home (91% very well, 7% well, 2% not well, 1% not at all).
3.7% of residents speak Asian or Pacific Island language at home (62% very well, 24% well, 4% not well, 9% not at all).
1.9% of residents speak other language at home (78% very well, 13% well, 9% not well).
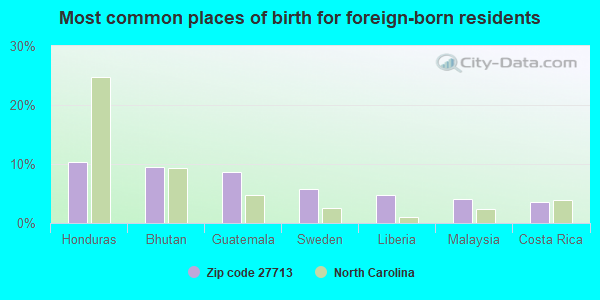
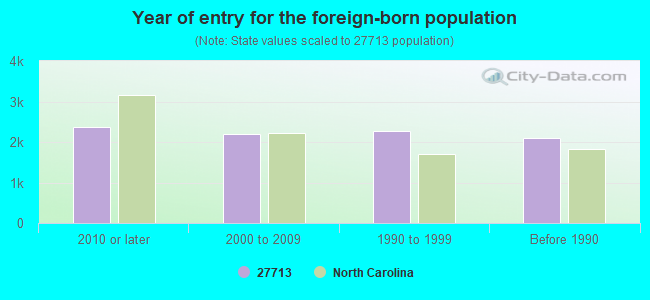
Foreign born population: 8,389 (14.4%) (60.5% of them are naturalized citizens)
Major facilities with environmental interests located in this zip code:
A CLEANER WORLD DURHAM (5700 FAYETTEVILLE ROAD in DURHAM, NC)
AIR MINOR (AIRS/AFS) STATE MASTER (North Carolina facility info) - AIR PROGRAM Small Quantity Generators, between 100 kg and 1000 kg of hazardous waste/month (Resource Conservation and Recovery Act (tracking hazardous waste)) - notification Business SIC classification: DRYCLEANING PLANTS, EXCEPT RUG CLEANING; NONCLASSIFIABLE ESTABLISHMENTS Organizations: A CLEANER WORLD TRIANGLE INC (CONTACT/OWNER)
Alternative names: A CLEANER WORLD - FAYETTEVILLE RD, A CLEANER WORLD NO 203
AIR PRODUCTS AND CHEMICALS INC (4822 INDUSTRY LANE in DURHAM, NC)
STATE MASTER (North Carolina facility info) - UNDERGROUND STORAGE TANK PROGRAM COMPLIANCE ACTIVITY (Tracking inspections of insecticide, fungicide, and rodenticide, and toxic substances) Conditionally Exempt Small Quantity Generators, less than 100 kg/month of hazardous waste (Resource Conservation and Recovery Act (tracking hazardous waste)) - notification Business SIC classification: INDUSTRIAL GASES; CHEMICALS AND ALLIED PRODUCTS; NONCLASSIFIABLE ESTABLISHMENTS
BRYLAWSKI, THOMAS - RES (5111 TUDOR PLACE in DURHAM, NC)
STATE MASTER (North Carolina facility info) - -115DA4YG00M69W84AY3WR7VF8P, WASTEWATER FACILITY National Pollutant Discharge Elimination System NON-MAJOR (Tracking pollutant discharge elimination systems) - permit Business SIC classification: SEWERAGE SYSTEMS
CHEMTEK, INC (4900 PROSPECTUS DRIVE, STE 100 in DURHAM, NC)
(Integrated Compliance Information System) - ICIS-04-1998-0262, FORMAL ENFORCEMENT ACTION COMPLIANCE ACTIVITY (Tracking inspections of insecticide, fungicide, and rodenticide, and toxic substances) Business SIC classification: CHEMICALS AND ALLIED PRODUCTS
CHEMCODES INCORPORATED (2300 ENGLERT DRIVE in DURHAM, NC)
CIRRUS PHARMACEUTICALS INC (627 DAVIS DR in DURHAM, NC)
(Resource Conservation and Recovery Act (tracking hazardous waste)) Organizations: ANTHONY HICKEY (CONTACT/OWNER)
CIVENTICHEMC (631 UNITED DR in DURHAM, NC)
(Resource Conservation and Recovery Act (tracking hazardous waste)) Organizations: SRINIVAS R CHITTINENI (CONTACT/OWNER)
ARE-NC REGION NO. 5, LLC (2525 E HIGHWAY 54 in DURHAM, NC)
AIR MINOR (AIRS/AFS) Business SIC classification: NONCOMMERCIAL RESEARCH ORGANIZATIONS Alternative names: 2525 DURHAM ASSOCIATES, LLC
BERTEK PHARMACEUTICALS INC (530 DAVIS DR in DURHAM, NC)
Conditionally Exempt Small Quantity Generators, less than 100 kg/month of hazardous waste (Resource Conservation and Recovery Act (tracking hazardous waste)) Organizations: BERTEX PHARMACEUTICALS INS (CONTACT/OPERATOR)
BIOANALYTIKA LABORATORIES INCORPORATED (2300 ENGLERT DRIVE in DURHAM, NC)
Conditionally Exempt Small Quantity Generators, less than 100 kg/month of hazardous waste (Resource Conservation and Recovery Act (tracking hazardous waste)) - notification Organizations: MICHAEL & ROSEMARY SUNG (CONTACT/OWNER)
, MICHAEL SUNG (CONTACT/OWNER)
BRADLEY JACK & SHERRY (92 BRADLEY LN in DURHAM, NC)
National Pollutant Discharge Elimination System NON-MAJOR (Tracking pollutant discharge elimination systems) - permit Business SIC classification: SEWERAGE SYSTEMS
CIRRUS PHARMACEUTICALS INC (511 DAVIS DR in DURHAM, NC)
Small Quantity Generators, between 100 kg and 1000 kg of hazardous waste/month (Resource Conservation and Recovery Act (tracking hazardous waste)) Business NAICS classification: MEDICAL LABORATORIES. Organizations: KEYSTONE CORP (CONTACT/OPERATOR)
, TECHNOLOGY II LLC (CONTACT/OWNER)
Housing units lacking complete plumbing facilities: 0.3% Housing units lacking complete kitchen facilities: 0.7%
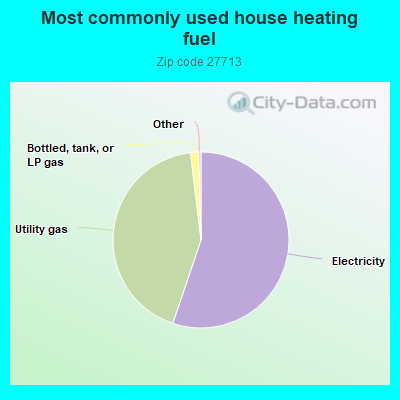
55.2%Electricity
42.9%Utility gas
1.5%Bottled, tank, or LP gas
Population in 1990: 19,493. Population change in the 1990s: +11,410 (+58.5%).
Place of birth for U.S.-born residents:
This state: 25,770
Northeast: 8,268
Midwest: 4,270
South: 8,920
West: 2,384
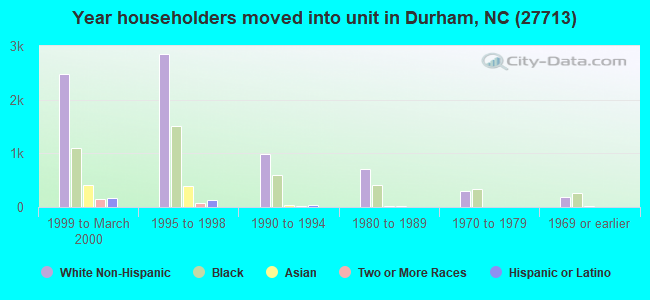
41% of the 27713 zip code residents lived in the same house 5 years ago. Out of people who lived in different houses, 33% lived in this county. Out of people who lived in different counties, 50% lived in North Carolina.
84% of the 27713 zip code residents lived in the same house 1 year ago. Out of people who lived in different houses, 51% moved from this county. Out of people who lived in different houses, 22% moved from different county within same state. Out of people who lived in different houses, 18% moved from different state. Out of people who lived in different houses, 2% moved from abroad.
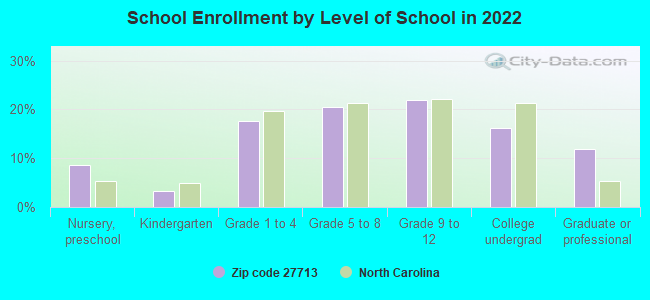
Private vs. public school enrollment:
Students in private schools in grades 1 to 8 (elementary and middle school): 869
Here:
15.9%
North Carolina:
13.8%
Students in private schools in grades 9 to 12 (high school): 507
Here:
16.1%
North Carolina:
11.9%
Students in private undergraduate colleges: 352
Here:
15.4%
North Carolina:
19.3%
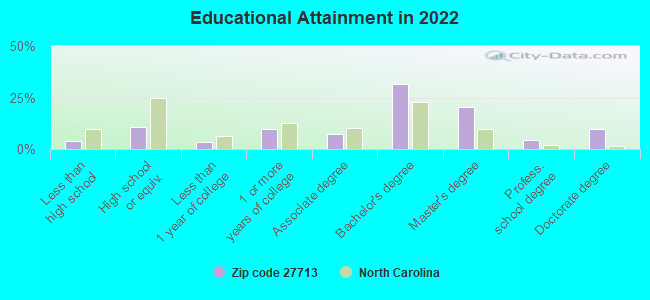
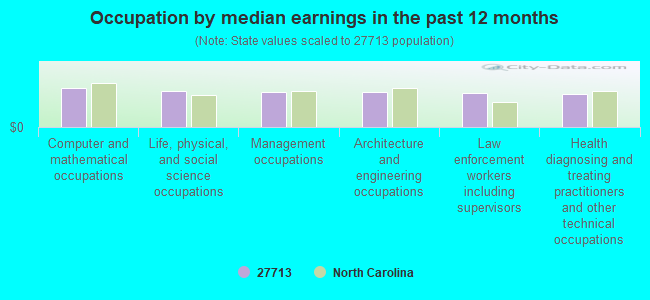
Occupation by median earnings in the past 12 months ($)
94,570Computer and mathematical occupations
88,799Life, physical, and social science occupations
85,791Management occupations
85,619Architecture and engineering occupations
83,060Law enforcement workers including supervisors
80,561Health diagnosing and treating practitioners and other technical occupations
Companies with biggest federal contracts located in this zip code (DURHAM, NC):
NEKTON RESEARCH LLC (4625 INDUSTRY LANE; small business) : $10,025,940 in 59 contractsfrom 2000 to 2006
Contracts for Other Defense -- Applied Research and Exploratory Development (R&D), Other Defense -- Operational Systems Development (R&D), Other Medical -- Operational Systems Development (R&D), Other Defense -- Advanced Development (R&D), and moreby Navy, Army, National Oceanic and Atmospheric Administration/Under Secretary for Oceans and Atmosphere Signed by year:2000: $480,282; 2001: $136,240; 2002: $70,000; 2003: $1,601,836; 2004: $2,735,159; 2005: $2,966,706; 2006: $2,035,717.
Biggest contracts:
$656,122 with Navy for Other Defense -- Applied Research and Exploratory Development (R&D). Signed on 2005-05-13. Completion date: 2006-11-29.
$515,848, same as above.Signed on 2005-12-12. Completion date: 2007-02-28.
$503,542, same as above.Signed on 2006-06-08. Completion date: 2007-02-28.
$489,505, same as above.Signed on 2006-03-31. Completion date: 2008-03-31.
ANDCARE, INC (2810 MERIDIAN PARKWAY SUIT; small business) : $780,000 in 2 contractsin 2000
$415,000 with Army for Other Medical -- Basic Research (R&D). Signed on 2000-04-27. Completion date: 2002-09-30.
$365,000 with Army for Other Medical -- Operational Systems Development (R&D). Signed on 2000-12-29. Completion date: 2002-09-30.
DR DBI C UMESI MD (4105 KETTERING DRIVE; small business) : $499,692 in 9 contractsfrom 2000 to 2005
Contracts for Other Medical Services, General Health Care Services by Army Signed by year:2000: $275,184; 2001: $0; 2002: $290,472; 2003: -$39,500; 2004: $198,116; 2005: -$224,580; 2006: $0.
Biggest contracts:
$290,472 with Army for Other Medical Services. Signed on 2002-10-23. Completion date: 2001-09-30.
$275,184, same as above.Signed on 2000-10-14. Completion date: 2001-09-30.
$238,116, same as above.Signed on 2004-06-10. Completion date: 2001-09-30.
$0, same as above.Signed on 2000-10-14. Completion date: 2001-09-30.
3RDTECH INC (2500 MERIDIAN PKWY; small business) : $311,053 in 10 contractsfrom 2001 to 2006
Contracts for Optical Instruments, Test Equipment, Components and Accessories, Miscellaneous Communication Equipment, Cameras, Motion Picture, ADPE System Configuration, and moreby NASA, Army, American Forces Information Service, Federal Bureau of Investigation, and others Signed by year:2000: $0; 2001: $60,000; 2002: $0; 2003: $0; 2004: $58,090; 2005: $142,853; 2006: $50,110.
Biggest contracts:
$60,000 with NASA for Optical Instruments, Test Equipment, Components and Accessories. Signed on 2001-08-15. Completion date: 2001-10-15.
$50,110 with Army for Miscellaneous Communication Equipment. Signed on 2006-06-20. Completion date: 2006-08-21.
$47,050 with American Forces Information Service for Cameras, Motion Picture. Signed on 2005-01-03. Completion date: 2005-03-04.
$45,950 with Federal Bureau of Investigation for ADPE System Configuration. Signed on 2005-09-06. Completion date: 2005-11-30.
CORTEX SURVEILLANCE AUTOMATION (2530 MERIDIAN PARKWAY; small business) : $301,175 in 8 contractsfrom 2001 to 2004
Contracts for Miscellaneous Alarm, Signal and Security Detection Systems, Communications Security Equipment and Components, Installation of Equipment -- Communication, Detection, and Coherent Radiation Equipment, Maintenance, Repair and Rebuilding of Equipment -- Electrical and Electronic Equipment Components, and moreby Navy, Army Signed by year:2000: $0; 2001: $107,181; 2002: $79,995; 2003: $78,055; 2004: $35,944; 2005: $0; 2006: $0.
Biggest contracts:
$78,546 with Navy for Miscellaneous Alarm, Signal and Security Detection Systems. Signed on 2001-09-07. Completion date: 2001-09-28.
$47,392 with Army for Communications Security Equipment and Components. Signed on 2002-09-05. Completion date: 2002-10-20.
$43,822 with Navy for Installation of Equipment -- Communication, Detection, and Coherent Radiation Equipment. Taking place in CA. Signed on 2003-05-02. Completion date: 2003-06-06.
$35,944 with Navy for Maintenance, Repair and Rebuilding of Equipment -- Electrical and Electronic Equipment Components. Signed on 2004-10-07. Completion date: 2005-09-30.
VIASIC, INC (6015 FAYETTEVILLE RD, SUIT; small business)
$275,000 with Air Force for ADP Software. Signed on 2006-04-19. Completion date: 2006-04-26.
FOARD SYSTEMS DESIGN, INC (1906 HWY 54E; small business) : $169,990 in 3 contractsfrom 2001 to 2006
$69,990 with Navy for Other Defense -- Basic Research (R&D). Signed on 2006-02-23. Completion date: 2006-08-28.
$64,803 with Army for Defense Missile and Space Systems -- Advanced Development (R&D). Signed on 2001-04-06. Completion date: 2001-10-03.
$35,197, same as above.Signed on 2001-11-20. Completion date: 2001-10-03.
TRIANGLE LABORATORIES INC (2445 SOUTH ALSTON AVENUE; small business) : $98,160 in 56 contractsfrom 2001 to 2004
Contracts for Facilities Operations Support Services by Navy Signed by year:2000: $0; 2001: $31,400; 2002: $41,930; 2003: $12,775; 2004: $12,055; 2005: $0; 2006: $0.
Biggest contracts:
$15,000 with Navy for Facilities Operations Support Services. Taking place in CA. Signed on 2002-07-26. Completion date: 2002-09-30.
$15,000, same as above.Signed on 2002-11-27. Completion date: 2003-01-31.
$15,000, same as above.Signed on 2002-05-15. Completion date: 2002-07-31.
$10,000, same as above.Signed on 2003-10-08. Completion date: 2003-10-31.
DELPHI HEALTHCARE PARTNERS, IN (1000 PARK FORTY PLAZA) : $96,980 in 2 contractsin 2002
$61,000 with Navy for Gynecology Services. Signed on 2002-07-03. Completion date: 2002-09-16.
$35,980 with Navy for Dermatology Services. Signed on 2002-10-01. Completion date: 2003-01-16.
NEKTON RESEARCH LLC (4625 INDUSTRY LN; small business)
$69,998 with Navy for Other Defense -- Applied Research and Exploratory Development (R&D). Signed on 2002-06-17. Completion date: 2003-03-17.
Top industries in this zip code by the number of employees in 2005:
Professional, Scientific, and Technical Services: Research and Development in the Physical, Engineering, and Life Sciences (500-999 employees: 1 establishment, 100-249 employees: 1 establishment, 50-99 employees: 5 establishments, 20-49 employees: 6 establishments, 10-19 employees: 5 establishments, 5-9 employees: 3 establishments, 1-4 employees: 8 establishments)
2002 - 2018 National Fire Incident Reporting System (NFIRS) incidents
According to the data from the years 2002 - 2018 the average number of fire incidents per year is 100. The highest number of fires - 212 took place in 2010, and the least - 28 in 2006. The data has a growing trend.
When looking into fire subcategories, the most incidents belonged to: Structure Fires (40.8%), and Outside Fires (34.1%).
Fire incident types reported to NFIRS in Zip Code 27713
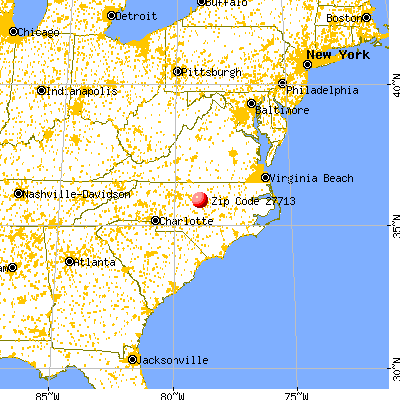


 Nearest zip codes: 27707, 27519, 27709, 27560, 27701, 27517.
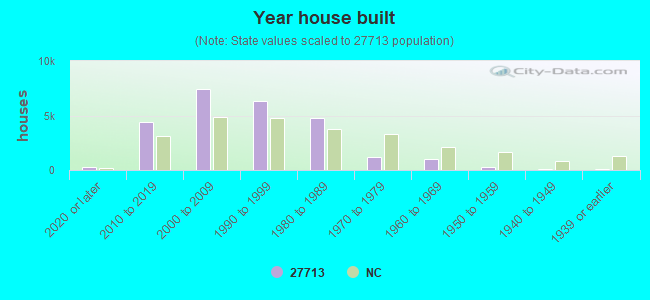


 According to the data from the years 2002 - 2018 the average number of fire incidents per year is 100. The highest number of fires - 212 took place in 2010, and the least - 28 in 2006. The data has a growing trend.
 When looking into fire subcategories, the most incidents belonged to: Structure Fires (40.8%), and Outside Fires (34.1%).