Estimated zip code population in 2022: 19,778 Zip code population in 2010: 21,740 Zip code population in 2000: 22,292
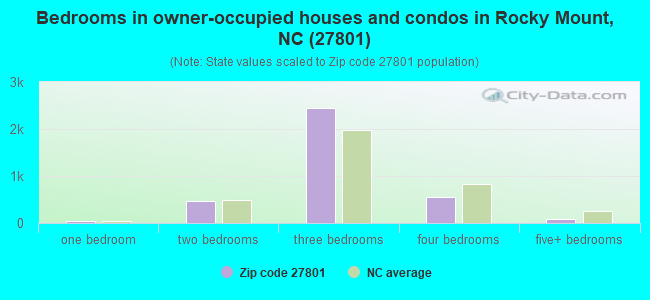
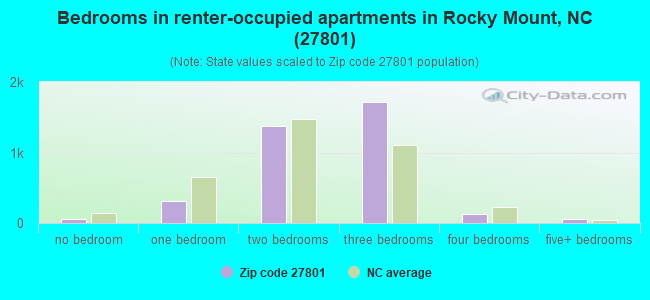
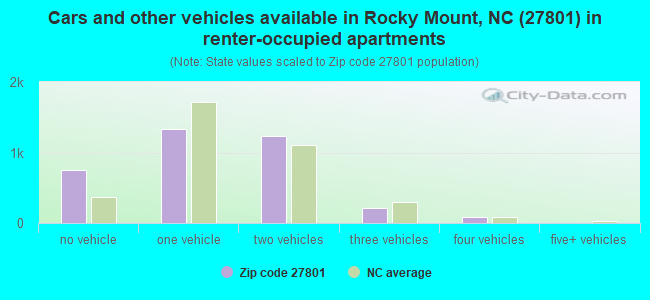
Houses and condos: 9,190 Renter-occupied apartments: 3,659
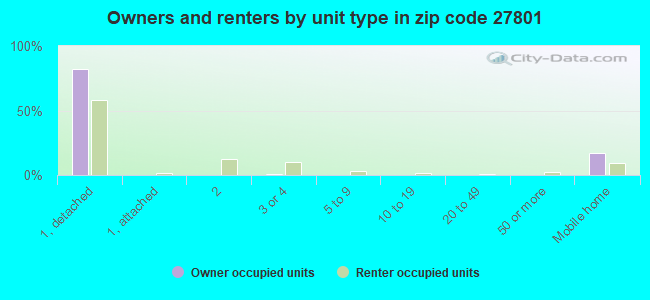
% of renters here:
50%
State:
33%
March 2022 cost of living index in zip code 27801: 84.9 (less than average, U.S. average is 100)
Land area: 69.6 sq. mi. Water area: 0.3 sq. mi.
Population density: 284 people per square mile
(very low).
OSM Map
General Map
Google Map
MSN Map
OSM Map
General Map
Google Map
MSN Map
OSM Map
General Map
Google Map
MSN Map
OSM Map
General Map
Google Map
MSN Map
Please wait while loading the map...
Real estate property taxes paid for housing units in 2022:
This zip code:
1.2% ($1,363)
North Carolina:
0.6% ($1,769)
Median real estate property taxes paid for housing units with mortgages in 2022: $1,420 (1.1%) Median real estate property taxes paid for housing units with no mortgage in 2022: $1,273 (1.2%)
Averages for the 2020 tax year for zip code 27801, filed in 2021:
Average Adjusted Gross Income (AGI) in 2020: $32,122 (Individual Income Tax Returns)
Here:
$32,122
State:
$70,020
Salary/wage: $28,163 (reported on 85.6% of returns)
Here:
$28,163
State:
$58,387
(% of AGI for various income ranges: 1139.1% for AGIs below $25k, 3731.8% for AGIs $25k-50k, 7721.8% for AGIs $50k-75k, 12220.6% for AGIs $75k-100k, 17587.9% for AGIs $100k-200k)
Taxable interest for individuals: $547 (reported on 13.4% of returns)
This zip code:
$547
North Carolina:
$1,479
(% of AGI for various income ranges: 4.2% for AGIs below $25k, 4.7% for AGIs $25k-50k, 20.4% for AGIs $50k-75k, 32.8% for AGIs $75k-100k, 147.9% for AGIs $100k-200k)
Ordinary dividends: $3,181 (reported on 4.5% of returns)
Here:
$3,181
State:
$7,888
(% of AGI for various income ranges: 3.7% for AGIs below $25k, 8.8% for AGIs $25k-50k, 32.8% for AGIs $50k-75k, 123.9% for AGIs $75k-100k, 351.4% for AGIs $100k-200k)
Net capital gain/loss in AGI: +$4,377 (reported on 4.2% of returns)
Here:
+$4,377
State:
+$23,652
(% of AGI for various income ranges: 1.5% for AGIs below $25k, 5.0% for AGIs $25k-50k, 14.6% for AGIs $50k-75k, 145.0% for AGIs $75k-100k, 749.3% for AGIs $100k-200k)
Profit/loss from business: +$4,148 (reported on 12.8% of returns)
Here:
+$4,148
State:
+$11,710
(% of AGI for various income ranges: 61.1% for AGIs below $25k, 43.6% for AGIs $25k-50k, 94.4% for AGIs $50k-75k, 147.8% for AGIs $75k-100k, 456.4% for AGIs $100k-200k)
Taxable individual retirement arrangement distribution: $12,351 (reported on 5.2% of returns)
27801:
$12,351
North Carolina:
$20,247
(% of AGI for various income ranges: 21.0% for AGIs below $25k, 58.4% for AGIs $25k-50k, 247.8% for AGIs $50k-75k, 478.9% for AGIs $75k-100k, 968.6% for AGIs $100k-200k)
Total itemized deductions: $25,819 (reported on 3.1% of returns)
Here:
$25,819
State:
$34,549
(% of AGI for various income ranges: 18.8% for AGIs below $25k, 87.3% for AGIs $25k-50k, 324.2% for AGIs $50k-75k, 531.1% for AGIs $75k-100k, 1299.3% for AGIs $100k-200k)
Charity contributions: $9,274 (reported on 2.8% of returns)
Here:
$9,274
State:
$13,360
(% of AGI for various income ranges: 2.4% for AGIs below $25k, 19.0% for AGIs $25k-50k, 92.2% for AGIs $50k-75k, 167.8% for AGIs $75k-100k, 661.4% for AGIs $100k-200k)
Taxes paid: $4,635 (reported on 3.1% of returns)
27801:
$4,635
State:
$7,586
(% of AGI for various income ranges: 1.9% for AGIs below $25k, 11.6% for AGIs $25k-50k, 58.2% for AGIs $50k-75k, 120.0% for AGIs $75k-100k, 294.3% for AGIs $100k-200k)
Earned income credit: $2,716 (reported on 38.5% of returns)
Here:
$2,716
State:
$2,337
(% of AGI for various income ranges: 182.0% for AGIs below $25k, 112.3% for AGIs $25k-50k)
Percentage of individuals using paid preparers for their 2020 taxes: 89.6%
Here:
90%
State:
93%
(% for various income ranges: 91.1% for AGIs below $25k, 90.5% for AGIs $25k-50k, 85.5% for AGIs $50k-75k, 80.6% for AGIs $75k-100k, 86.2% for AGIs $100k-200k, 66.7% for AGIs over 200k)
Averages for the 2012 tax year for zip code 27801, filed in 2013:
Average Adjusted Gross Income (AGI) in 2012: $28,282 (Individual Income Tax Returns)
Here:
$28,282
State:
$54,937
Salary/wage: $24,816 (reported on 87.7% of returns)
Here:
$24,816
State:
$46,336
(% of AGI for various income ranges: 79.8% for AGIs below $25k, 82.8% for AGIs $25k-50k, 75.3% for AGIs $50k-75k, 72.5% for AGIs $75k-100k, 63.8% for AGIs $100k-200k)
Taxable interest for individuals: $774 (reported on 13.9% of returns)
This zip code:
$774
North Carolina:
$1,298
(% of AGI for various income ranges: 0.4% for AGIs below $25k, 0.3% for AGIs $25k-50k, 0.3% for AGIs $50k-75k, 0.3% for AGIs $75k-100k, 0.6% for AGIs $100k-200k)
Ordinary dividends: $2,334 (reported on 5.3% of returns)
Here:
$2,334
State:
$6,213
(% of AGI for various income ranges: 0.2% for AGIs below $25k, 0.2% for AGIs $25k-50k, 0.4% for AGIs $50k-75k, 0.3% for AGIs $75k-100k, 1.6% for AGIs $100k-200k)
Net capital gain/loss in AGI: +$4,033 (reported on 4.0% of returns)
Here:
+$4,033
State:
+$12,740
(% of AGI for various income ranges: 0.1% for AGIs $25k-50k, 0.4% for AGIs $50k-75k, 0.3% for AGIs $75k-100k, 3.3% for AGIs $100k-200k)
Profit/loss from business: +$4,811 (reported on 13.6% of returns)
Here:
+$4,811
State:
+$10,311
(% of AGI for various income ranges: 6.1% for AGIs below $25k, 0.7% for AGIs $25k-50k, 0.5% for AGIs $50k-75k, 1.0% for AGIs $75k-100k, 1.6% for AGIs $100k-200k)
Taxable individual retirement arrangement distribution: $10,431 (reported on 5.9% of returns)
27801:
$10,431
North Carolina:
$15,575
(% of AGI for various income ranges: 1.4% for AGIs below $25k, 2.1% for AGIs $25k-50k, 2.5% for AGIs $50k-75k, 3.2% for AGIs $75k-100k, 2.7% for AGIs $100k-200k)
Total itemized deductions: $17,199 (30% of AGI, reported on 18.8% of returns)
Here:
$17,199
State:
$23,438
Here:
29.9% of AGI
State:
21.5% of AGI
(% of AGI for various income ranges: 6.1% for AGIs below $25k, 10.5% for AGIs $25k-50k, 15.7% for AGIs $50k-75k, 14.5% for AGIs $75k-100k, 16.4% for AGIs $100k-200k)
Charity contributions: $4,591 (reported on 16.5% of returns)
Here:
$4,591
State:
$4,687
(% of AGI for various income ranges: 1.0% for AGIs below $25k, 2.1% for AGIs $25k-50k, 3.7% for AGIs $50k-75k, 4.1% for AGIs $75k-100k, 4.8% for AGIs $100k-200k)
Taxes paid: $4,573 (reported on 18.6% of returns)
27801:
$4,573
State:
$8,823
(% of AGI for various income ranges: 1.0% for AGIs below $25k, 2.2% for AGIs $25k-50k, 4.0% for AGIs $50k-75k, 4.5% for AGIs $75k-100k, 6.4% for AGIs $100k-200k)
Earned income credit: $2,808 (reported on 47.2% of returns)
Here:
$2,808
State:
$2,376
(% of AGI for various income ranges: 14.7% for AGIs below $25k, 2.0% for AGIs $25k-50k)
Percentage of individuals using paid preparers for their 2012 taxes: 55.4%
Here:
55%
State:
53%
(% for various income ranges: 57.5% for AGIs below $25k, 49.5% for AGIs $25k-50k, 54.3% for AGIs $50k-75k, 54.5% for AGIs $75k-100k, 63.6% for AGIs $100k-200k)
Averages for the 2004 tax year for zip code 27801, filed in 2005:
Average Adjusted Gross Income (AGI) in 2004: $26,182 (Individual Income Tax Returns)
Here:
$26,182
State:
$45,376
Salary/wage: $23,970 (reported on 90.7% of returns)
Here:
$23,970
State:
$39,442
(% of AGI for various income ranges: 94.4% for AGIs below $10k, 86.8% for AGIs $10k-25k, 86.2% for AGIs $25k-50k, 81.9% for AGIs $50k-75k, 76.6% for AGIs $75k-100k, 63.6% for AGIs over 100k)
Taxable interest for individuals: $1,056 (reported on 18.6% of returns)
This zip code:
$1,056
North Carolina:
$1,515
(% of AGI for various income ranges: 1.5% for AGIs below $10k, 0.3% for AGIs $10k-25k, 0.5% for AGIs $25k-50k, 0.5% for AGIs $50k-75k, 0.6% for AGIs $75k-100k, 3.3% for AGIs over 100k)
Taxable dividends: $1,281 (reported on 8.1% of returns)
Here:
$1,281
State:
$4,016
(% of AGI for various income ranges: 0.5% for AGIs below $10k, 0.2% for AGIs $10k-25k, 0.2% for AGIs $25k-50k, 0.5% for AGIs $50k-75k, 0.6% for AGIs $75k-100k, 0.9% for AGIs over 100k)
Net capital gain/loss: +$2,796 (reported on 5.2% of returns)
Here:
+$2,796
State:
+$11,152
(% of AGI for various income ranges: -0.5% for AGIs below $10k, -0.0% for AGIs $10k-25k, 0.2% for AGIs $25k-50k, 0.4% for AGIs $50k-75k, 1.1% for AGIs $75k-100k, 3.7% for AGIs over 100k)
Profit/loss from business: +$3,316 (reported on 10.6% of returns)
Here:
+$3,316
State:
+$9,490
(% of AGI for various income ranges: 3.1% for AGIs below $10k, 1.5% for AGIs $10k-25k, 0.4% for AGIs $25k-50k, 1.4% for AGIs $50k-75k, 0.9% for AGIs $75k-100k, 4.2% for AGIs over 100k)
IRA payment deduction: $2,383 (reported on 1.0% of returns)
27801:
$2,383
North Carolina:
$2,967
Total itemized deductions: $15,325 (30% of AGI, reported on 22.7% of returns)
Here:
$15,325
State:
$19,464
Here:
30.5% of AGI
State:
22.7% of AGI
(% of AGI for various income ranges: 13.7% for AGIs below $10k, 7.0% for AGIs $10k-25k, 13.9% for AGIs $25k-50k, 16.7% for AGIs $50k-75k, 17.7% for AGIs $75k-100k, 16.0% for AGIs over 100k)
Charity contributions deductions: $3,802 (7% of AGI, reported on 20.9% of returns)
Here:
$3,802
State:
$4,035
Here:
7.4% of AGI
State:
4.5% of AGI
(% of AGI for various income ranges: 0.7% for AGIs below $10k, 1.3% for AGIs $10k-25k, 3.0% for AGIs $25k-50k, 3.9% for AGIs $50k-75k, 4.9% for AGIs $75k-100k, 5.0% for AGIs over 100k)
Total tax: $3,016 (reported on 53.9% of returns)
27801:
$3,016
State:
$7,257
(% of AGI for various income ranges: 1.6% for AGIs below $10k, 2.2% for AGIs $10k-25k, 5.2% for AGIs $25k-50k, 8.4% for AGIs $50k-75k, 10.4% for AGIs $75k-100k, 14.8% for AGIs over 100k)
Earned income credit: $2,154 (reported on 44.0% of returns)
Here:
$2,154
State:
$1,851
Percentage of individuals using paid preparers for their 2004 taxes: 66.9%
Here:
67%
State:
62%
(% for various income ranges: 64.6% for AGIs below $10k, 72.3% for AGIs $10k-25k, 62.9% for AGIs $25k-50k, 60.5% for AGIs $50k-75k, 60.6% for AGIs $75k-100k, 76.7% for AGIs over 100k)
Household received Food Stamps/SNAP in the past 12 months: 2,179 Household did not receive Food Stamps/SNAP in the past 12 months: 5,236
Women who had a birth in the past 12 months: 89 (49 now married, 39 unmarried) Women who did not have a birth in the past 12 months: 4,555 (1,550 now married, 2,995 unmarried)
Housing units in zip code 27801 with a mortgage: 1,929 (181 second mortgage, 144 both second mortgage and home equity loan) Median monthly owner costs for units with a mortgage: $1,270 Median monthly owner costs for units without a mortgage: $478
Residents with income below the poverty level in 2022:
This zip code:
23.7%
Whole state:
12.8%
Residents with income below 50% of the poverty level in 2022:
This zip code:
12.4%
Whole state:
6.8%
Median number of rooms in houses and condos:
Here:
6.0
State:
6.4
Median number of rooms in apartments:
Here:
4.9
State:
4.4
Notable locations in this zip code not listed on our city pages
Notable locations in zip code 27801: Rock Mount Community Center (A), Rocky Mount Fairgrounds (B), Rocky Mount W Base (C). Display/hide their locations on the map
Churches in zip code 27801 include: Thornes Church (A), Avalon Church (B), Union Branch Church (C), Metropolitan Church (D), Mount Olive Church (E), Oak View Church (F), Hickory View Church (G), Pleasant Hill Church (H), Mount Galilee Church (I). Display/hide their locations on the map
Cemeteries: Unity Cemetery (1), Northeastern Cemetery (2), Bulluck Cemetery (3), Powell Cemetery (4), Pineview Cemetery (5). Display/hide their locations on the map
1,385 married couples with children.
2,417 single-parent households (697 men, 1,720 women).
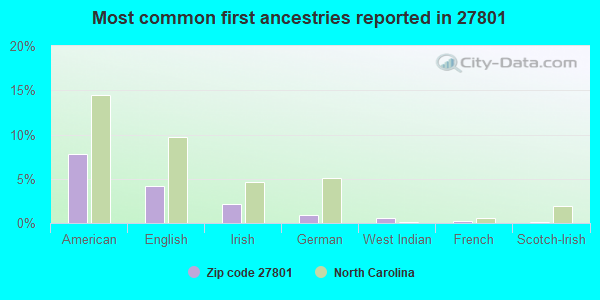
96.8% of residents of 27801 zip code speak English at home.
2.1% of residents speak Spanish at home (80% very well, 16% well, 5% not well).
0.3% of residents speak other Indo-European language at home (100% very well).
0.3% of residents speak Asian or Pacific Island language at home (73% very well, 27% well).
0.2% of residents speak other language at home (66% very well, 34% well).
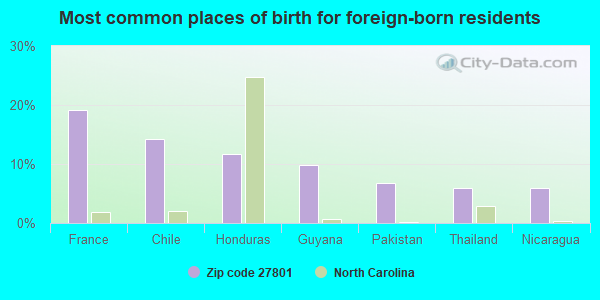
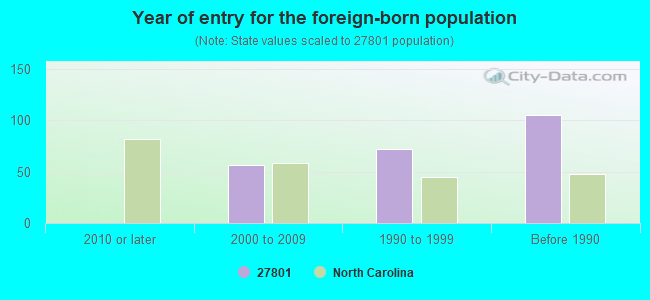
Foreign born population: 211 (1.1%) (87.9% of them are naturalized citizens)
Major facilities with environmental interests located in this zip code:
ABBOTT LABORATORIES (HIGHWAY 301 NORTH in ROCKY MOUNT, NC)
AIR SYNTHETIC MINOR (AIRS/AFS) STATE MASTER (North Carolina facility info) - -115DA4YG00M29W84AX3X05P5XJ, WASTEWATER FACILITY, -2310, AIR PROGRAM CRITERIA AND HAZARDOUS AIR POLLUTANT INVENTORY (Inventory of air pollution sources) National Pollutant Discharge Elimination System NON-MAJOR (Tracking pollutant discharge elimination systems) - permit National Pollutant Discharge Elimination System NON-MAJOR (Tracking pollutant discharge elimination systems) - permit National Pollutant Discharge Elimination System NON-MAJOR (Tracking pollutant discharge elimination systems) - permit HAZARDOUS WASTE BIENNIAL REPORTER (Resource Conservation and Recovery Act (tracking hazardous waste)) Large Quantity Generators, more that 1000 kg of hazardous waste/month (Resource Conservation and Recovery Act (tracking hazardous waste)) - notification TRI REPORTER (Tracking of toxic chemicals releasing facilities) Business SIC classification: PHARMACEUTICAL PREPARATIONS Business NAICS classification: PHARMACEUTICAL PREPARATION MANUFACTURING.; PHARMACEUTICAL PREPARATION MANUFACTURING.; PHARMACEUTICAL PREPARATION MANUFACTURING. Alternative names: HOSPIRA INC, HOSPIRA INC RM2
ADAMS PRODUCTS COMPANY (HWY NC 97 E in ROCKY MOUNT, NC)
AIR MINOR (AIRS/AFS) STATE MASTER (North Carolina facility info) - UNDERGROUND STORAGE TANK PROGRAM, AIR PROGRAM CRITERIA AND HAZARDOUS AIR POLLUTANT INVENTORY (Inventory of air pollution sources) Business SIC classification: CONCRETE PRODUCTS, EXCEPT BLOCK AND BRICK; NONCLASSIFIABLE ESTABLISHMENTS Business NAICS classification: ALL OTHER MISCELLANEOUS MANUFACTURING.
BARCA LOUNGER COMPANY (1450 ATLANTIC AVE in ROCKY MOUNT, NC)
STATE MASTER (North Carolina facility info) - UNDERGROUND STORAGE TANK PROGRAM, -115DA4YG00M29W84AY3XG5BN88, WASTEWATER FACILITY National Pollutant Discharge Elimination System NON-MAJOR (Tracking pollutant discharge elimination systems) - permit Conditionally Exempt Small Quantity Generators, less than 100 kg/month of hazardous waste (Resource Conservation and Recovery Act (tracking hazardous waste)) - notification Business SIC classification: WOOD HOUSEHOLD FURNITURE, UPHOLSTERED; NONCLASSIFIABLE ESTABLISHMENTS Organizations: BARCALOUNGER CO (CONTACT/OWNER)
Alternative names: BARCALOUNGER COMPANY
BARNHILL CONTRACTING COMPANY (NC HIGHWAY 97 EAST in ROCKY MOUNT, NC)
AIR SYNTHETIC MINOR (AIRS/AFS) STATE MASTER (North Carolina facility info) - -115DA4YG00M29W84AY3XRC0TGH, WASTEWATER FACILITY, -2152, AIR PROGRAM CRITERIA AND HAZARDOUS AIR POLLUTANT INVENTORY (Inventory of air pollution sources) National Pollutant Discharge Elimination System NON-MAJOR (Tracking pollutant discharge elimination systems) - permit Business SIC classification: ASPHALT PAVING MIXTURES AND BLOCKS Business NAICS classification: ASPHALT PAVING MIXTURE AND BLOCK MANUFACTURING.; ASPHALT PAVING MIXTURE AND BLOCK MANUFACTURING.
CARGILL INC INACTIVE (US HWY 301-A SOUTH in ROCKY MOUNT, NC)
AIR MINOR (AIRS/AFS) STATE MASTER (North Carolina facility info) - AIR PROGRAM Business SIC classification: CASH GRAINS; SOYBEAN OIL MILLS Alternative names: CARGILL INCORPORATED
CAROLINA TELEPHONE AND TELEGRAPH D/B/A SPRINT (143 NORTH WASHINGTON STREET in ROCKY MOUNT, NC)
AIR MINOR (AIRS/AFS) STATE MASTER (North Carolina facility info) - AIR PROGRAM CRITERIA AND HAZARDOUS AIR POLLUTANT INVENTORY (Inventory of air pollution sources) Business SIC classification: TELEPHONE COMMUNICATIONS, EXCEPT RADIOTELEPHONE Alternative names: CAROLINA TELEPHONE & TELEGRAPH D/B/A EM, CAROLINA TELEPHONE & TELEGRAPH D/B/A SPR, CAROLINA TELEPHONE & TELEGRAPH DBA SPRIN
ABBOTT LABORATORIES (751 HALIFAX ROAD in ROCKY MOUNT, NC)
STATE MASTER (North Carolina facility info) - UNDERGROUND STORAGE TANK PROGRAM, -115DA4YG00M29W84AX3X05V0F0, WASTEWATER FACILITY National Pollutant Discharge Elimination System NON-MAJOR (Tracking pollutant discharge elimination systems) - permit Business SIC classification: SURGICAL AND MEDICAL INSTRUMENTS AND APPARATUS; NONCLASSIFIABLE ESTABLISHMENTS
CITY OF ROCKY MOUNT HWY 97 LIFT STATION (HIGHWAY 97 EAST in ROCKY MOUNT, NC)
AIR MINOR (AIRS/AFS) STATE MASTER (North Carolina facility info) - AIR PROGRAM Business SIC classification: ELECTRIC SERVICES Business NAICS classification: ELECTRIC POWER DISTRIBUTION. Alternative names: CITY OF ROCKY MOUNT - HWY 97 LIFT STATIO
CITY OF ROCKY MOUNT - AT AMOCO FIBERS (ATLANTIC AVENUE EXTENSION - NC 97 EAST in ROCKY MOUNT, NC)
AIR SYNTHETIC MINOR (AIRS/AFS) STATE MASTER (North Carolina facility info) - AIR PROGRAM CRITERIA AND HAZARDOUS AIR POLLUTANT INVENTORY (Inventory of air pollution sources) Business SIC classification: ELECTRIC SERVICES Business NAICS classification: FOSSIL FUEL ELECTRIC POWER GENERATION.; FOSSIL FUEL ELECTRIC POWER GENERATION. Alternative names: CITY OF ROCKY MOUNT AT AMOCO FIBERS PLANT, CITY OF ROCKY MOUNT power station AT AMOCO FIBERS plant
DON BULLUCK CHEVROLET INCORPORATED (1920 WESLEYAN BOULEVARD in ROCKY MOUNT, NC)
STATE MASTER (North Carolina facility info) - UNDERGROUND STORAGE TANK PROGRAM Small Quantity Generators, between 100 kg and 1000 kg of hazardous waste/month (Resource Conservation and Recovery Act (tracking hazardous waste)) - notification Business SIC classification: NONCLASSIFIABLE ESTABLISHMENTS Organizations: D.B. CHEVROLET INCORPORATED (CONTACT/OWNER)
BASKERVILLE ELEMENTARY (1100 STOKES AVE in ROCKY MOUNT, NC)
(National Center for Education Statistics) - STATE ID-306 Organizations: NASH-ROCKY MOUNT SCHOOLS (SCHOOL DISTRICT)
BENVENUE CLEANERS (106-B WEST RIDGE ST in ROCKY MOUNT, NC)
BILL ROWE OLDSMOBILE-NISSAN (851 N WESLEYAN BLVD in ROCKY MOUNT, NC)
(Resource Conservation and Recovery Act (tracking hazardous waste)) Organizations: WILLIAM S ROWE (CONTACT/OWNER)
Housing units lacking complete plumbing facilities: 4.5% Housing units lacking complete kitchen facilities: 6.2%
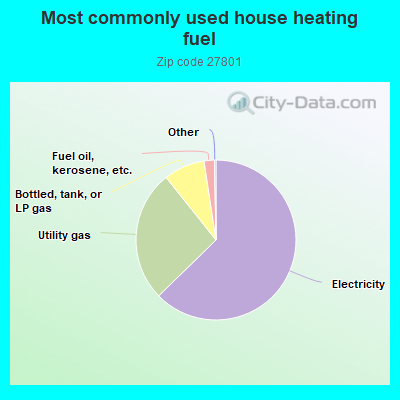
62.7%Electricity
26.6%Utility gas
8.3%Bottled, tank, or LP gas
2.1%Fuel oil, kerosene, etc.
Population in 1990: 25,072.
Place of birth for U.S.-born residents:
This state: 15,382
Northeast: 1,434
Midwest: 477
South: 1,766
West: 209
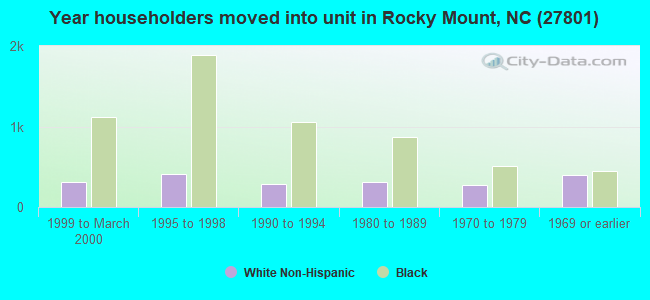
55% of the 27801 zip code residents lived in the same house 5 years ago. Out of people who lived in different houses, 56% lived in this county. Out of people who lived in different counties, 50% lived in North Carolina.
94% of the 27801 zip code residents lived in the same house 1 year ago. Out of people who lived in different houses, 23% moved from this county. Out of people who lived in different houses, 67% moved from different county within same state. Out of people who lived in different houses, 21% moved from different state. Out of people who lived in different houses, 2% moved from abroad.
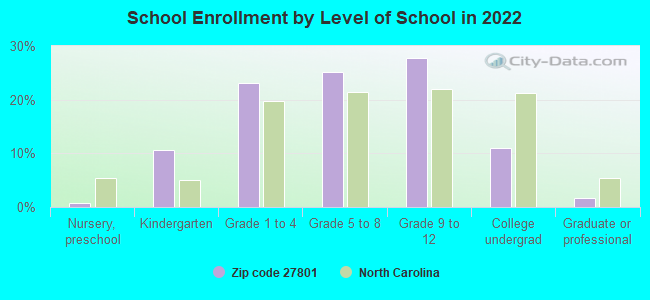
Private vs. public school enrollment:
Students in private schools in grades 1 to 8 (elementary and middle school): 279
Here:
14.1%
North Carolina:
13.8%
Students in private schools in grades 9 to 12 (high school): 5
Here:
0.5%
North Carolina:
11.9%
Students in private undergraduate colleges: 49
Here:
11.0%
North Carolina:
19.3%
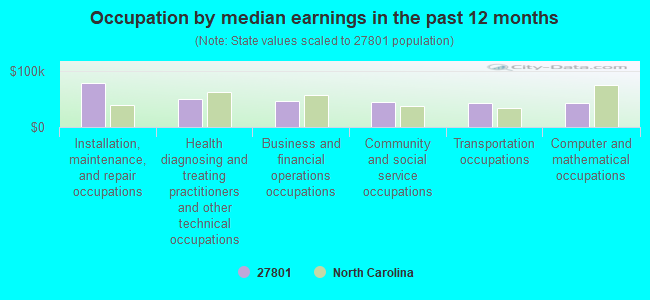
Occupation by median earnings in the past 12 months ($)
78,788Installation, maintenance, and repair occupations
50,122Health diagnosing and treating practitioners and other technical occupations
46,794Business and financial operations occupations
44,423Community and social service occupations
43,564Transportation occupations
42,102Computer and mathematical occupations
Companies with federal contracts located in this zip code:
MK-FERGUSON OF OAK RIDGE CO (1400 VANCE ST 101 GELO RD in ROCKY MOUNT, NC)
$162,327 with ENERGY, Department of for Operation of Government-Owned Facilities -- Miscellaneous Buildings. Taking place in TN. Signed on 2004-09-15. Completion date: 1999-04-30.
MARVA P. DAWKINS, PH.D. (No data from D and B in CHVATERUBY, In; small business) 10 employees, $0 revenue. Small Disadvantaged Business, Woman Owned Business: $126,566 in 5 contractsfrom 2002 to 2003
Contracts for Psychiatry Services by SOCIAL SECURITY ADMINISTRATION Signed by year:2000: $0; 2001: $0; 2002: $28,660; 2003: $97,906; 2004: $0; 2005: $0; 2006: $0.
Biggest contracts:
$35,825 with SOCIAL SECURITY ADMINISTRATION for Psychiatry Services. Taking place in IL. Signed on 2003-04-15. Completion date: 2003-12-15.
$31,213, same as above.Signed on 2003-06-15. Completion date: 2003-12-15.
$30,868, same as above.Signed on 2003-09-15. Completion date: 2003-12-15.
$28,660, same as above.Signed on 2002-12-15. Completion date: 2003-12-15.
WILSON IRON WORKS, INC (600 S WASHINGTON ST in ROCKY MOUNT, NC; small business)
$21,990 with Army for Miscellaneous Special Industry Machinery. Signed on 2005-09-23. Completion date: 2005-09-30.
Top industries in this zip code by the number of employees in 2005:
Information: Cable and Other Program Distribution (500-999 employees: 1 establishment, 20-49 employees: 1 establishment)
2002 - 2018 National Fire Incident Reporting System (NFIRS) incidents
Based on the data from the years 2002 - 2018 the average number of fires per year is 174. The highest number of fire incidents - 362 took place in 2005, and the least - 34 in 2008. The data has an increasing trend.
When looking into fire subcategories, the most incidents belonged to: Structure Fires (49.4%), and Outside Fires (35.8%).
Fire incident types reported to NFIRS in Zip Code 27801
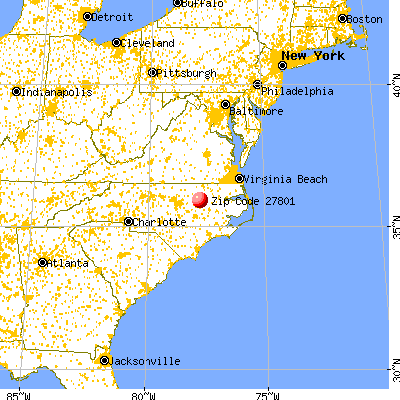


 Nearest zip codes: 27809, 27878, 27803, 27864, 27804, 27822.
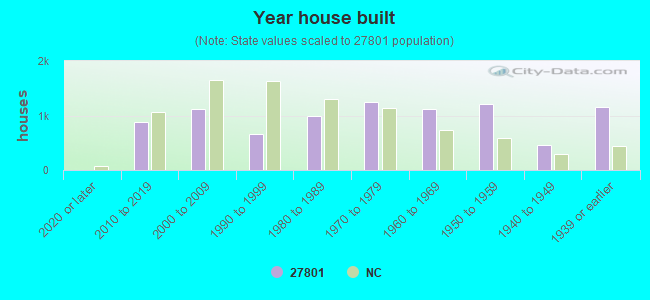


 Based on the data from the years 2002 - 2018 the average number of fires per year is 174. The highest number of fire incidents - 362 took place in 2005, and the least - 34 in 2008. The data has an increasing trend.
 When looking into fire subcategories, the most incidents belonged to: Structure Fires (49.4%), and Outside Fires (35.8%).