Estimated zip code population in 2022: 2,496 Zip code population in 2010: 2,977 Zip code population in 2000: 2,653
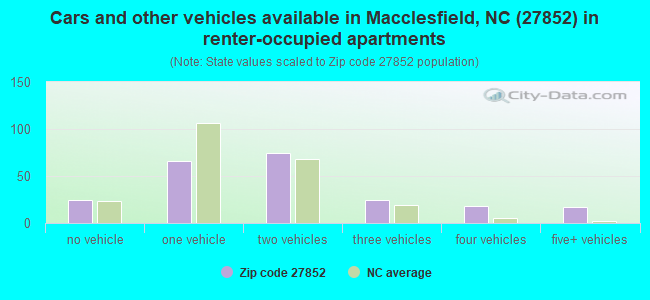
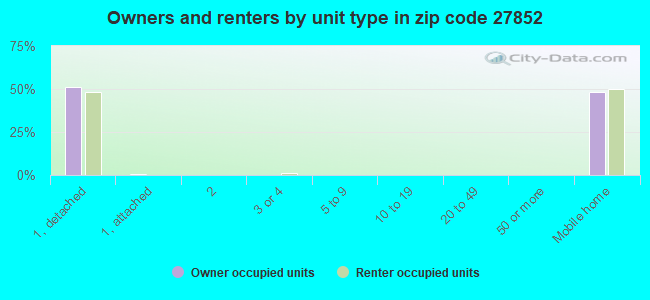
Houses and condos: 1,276 Renter-occupied apartments: 219
% of renters here:
19%
State:
33%
March 2022 cost of living index in zip code 27852: 79.4 (low, U.S. average is 100)
Land area: 48.6 sq. mi. Water area: 0.2 sq. mi.
Population density: 51 people per square mile
(very low).
OSM Map
General Map
Google Map
MSN Map
OSM Map
General Map
Google Map
MSN Map
OSM Map
General Map
Google Map
MSN Map
OSM Map
General Map
Google Map
MSN Map
Please wait while loading the map...
Real estate property taxes paid for housing units in 2022:
This zip code:
0.9% ($1,267)
North Carolina:
0.6% ($1,769)
Median real estate property taxes paid for housing units with mortgages in 2022: $1,529 (0.8%) Median real estate property taxes paid for housing units with no mortgage in 2022: $1,146 (0.9%)
Business Search- 14 Million verified businesses
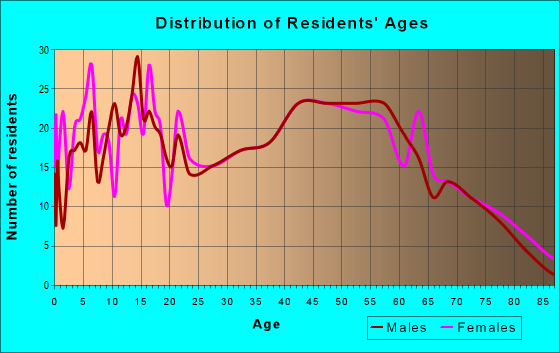
Males: 1,200
(48.1%)
Females: 1,295
(51.9%)
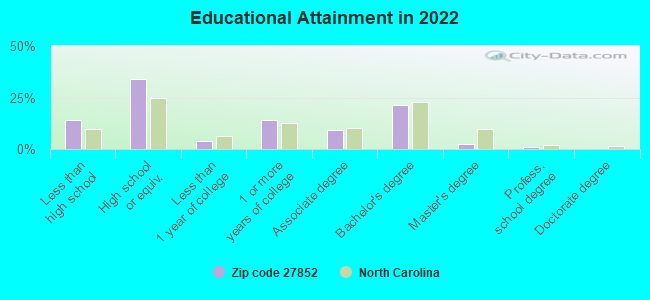
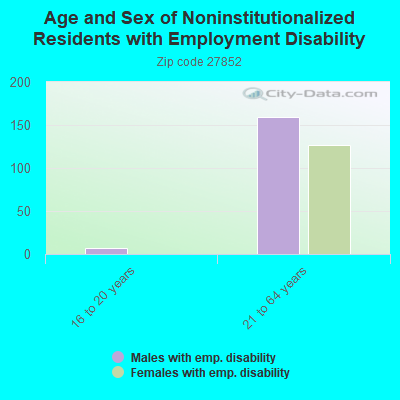
For population 25 years and over in 27852:
High school or higher: 84.2%
Bachelor's degree or higher: 24.4%
Graduate or professional degree: 3.4%
Unemployed: 9.1%
Mean travel time to work (commute): 27.0 minutes
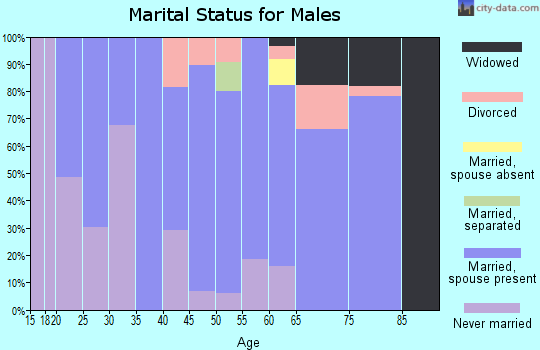
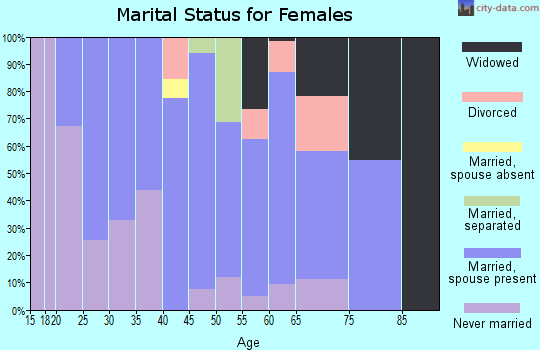
For population 15 years and over in 27852:
Never married: 28.9%
Now married: 37.2%
Separated: 1.4%
Widowed: 12.9%
Divorced: 19.6%
Zip code 27852 compared to state average:
Median house value below state average.
Unemployed percentage above state average.
Hispanic race population percentage significantly below state average.
Foreign-born population percentage significantly below state average.
Renting percentage below state average.
Length of stay since moving in significantly above state average.
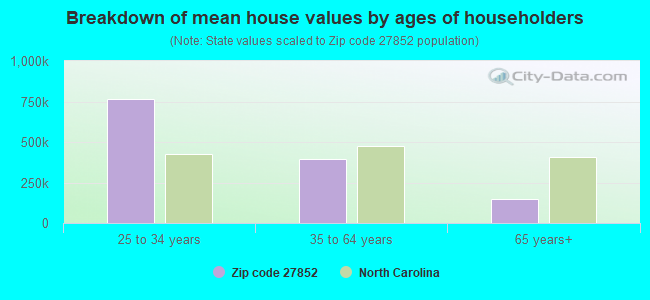
Estimated median house/condo value in 2022: $136,418
27852:
$136,418
North Carolina:
$280,600
According to our research of North Carolina and other state lists, there were 8 registered sex offenders living in 27852 zip code as of April 27, 2024. The ratio of all residents to sex offenders in zip code 27852 is 403 to 1.
Median resident age:
This zip code:
43.0 years
North Carolina median age:
39.2 years
Average household size:
This zip code:
2.1 people
North Carolina:
2.4 people
Averages for the 2020 tax year for zip code 27852, filed in 2021:
Average Adjusted Gross Income (AGI) in 2020: $56,106 (Individual Income Tax Returns)
Here:
$56,106
State:
$70,020
Salary/wage: $46,404 (reported on 80.2% of returns)
Here:
$46,404
State:
$58,387
(% of AGI for various income ranges: 1286.8% for AGIs below $25k, 3669.6% for AGIs $25k-50k, 7056.7% for AGIs $50k-75k, 10816.7% for AGIs $75k-100k, 22055.0% for AGIs $100k-200k)
Taxable interest for individuals: $550 (reported on 26.4% of returns)
This zip code:
$550
North Carolina:
$1,479
(% of AGI for various income ranges: 7.5% for AGIs below $25k, 7.5% for AGIs $25k-50k, 15.8% for AGIs $50k-75k, 16.7% for AGIs $75k-100k, 135.0% for AGIs $100k-200k)
Ordinary dividends: $2,343 (reported on 11.6% of returns)
Here:
$2,343
State:
$7,888
(% of AGI for various income ranges: 13.2% for AGIs below $25k, 10.4% for AGIs $25k-50k, 57.5% for AGIs $50k-75k, 246.2% for AGIs $100k-200k)
Net capital gain/loss in AGI: +$6,177 (reported on 10.7% of returns)
Here:
+$6,177
State:
+$23,652
(% of AGI for various income ranges: 8.6% for AGIs below $25k, 82.5% for AGIs $50k-75k, 850.0% for AGIs $100k-200k)
Profit/loss from business: +$11,600 (reported on 14.0% of returns)
Here:
+$11,600
State:
+$11,710
(% of AGI for various income ranges: 176.8% for AGIs below $25k, 202.1% for AGIs $25k-50k, 156.7% for AGIs $50k-75k, 1005.0% for AGIs $100k-200k)
Taxable individual retirement arrangement distribution: $15,083 (reported on 9.9% of returns)
27852:
$15,083
North Carolina:
$20,247
(% of AGI for various income ranges: 66.1% for AGIs below $25k, 103.3% for AGIs $25k-50k, 538.3% for AGIs $50k-75k, 913.7% for AGIs $100k-200k)
Total itemized deductions: $28,860 (reported on 4.1% of returns)
Here:
$28,860
State:
$34,549
(% of AGI for various income ranges: 220.0% for AGIs $25k-50k, 1143.8% for AGIs $100k-200k)
Charity contributions: $7,080 (reported on 4.1% of returns)
Here:
$7,080
State:
$13,360
(% of AGI for various income ranges: 442.5% for AGIs $100k-200k)
Taxes paid: $7,200 (reported on 4.1% of returns)
27852:
$7,200
State:
$7,586
(% of AGI for various income ranges: 45.8% for AGIs $25k-50k, 312.5% for AGIs $100k-200k)
Earned income credit: $2,335 (reported on 21.5% of returns)
Here:
$2,335
State:
$2,337
(% of AGI for various income ranges: 136.4% for AGIs below $25k, 93.8% for AGIs $25k-50k)
Percentage of individuals using paid preparers for their 2020 taxes: 93.4%
Here:
93%
State:
93%
(% for various income ranges: 93.3% for AGIs below $25k, 93.8% for AGIs $25k-50k, 88.9% for AGIs $50k-75k, 100.0% for AGIs $75k-100k, 106.7% for AGIs $100k-200k, 0.0% for AGIs over 200k)
Averages for the 2012 tax year for zip code 27852, filed in 2013:
Average Adjusted Gross Income (AGI) in 2012: $40,851 (Individual Income Tax Returns)
Here:
$40,851
State:
$54,937
Salary/wage: $36,962 (reported on 83.9% of returns)
Here:
$36,962
State:
$46,336
(% of AGI for various income ranges: 72.6% for AGIs below $25k, 82.8% for AGIs $25k-50k, 82.8% for AGIs $50k-75k, 78.0% for AGIs $75k-100k, 65.5% for AGIs $100k-200k)
Taxable interest for individuals: $881 (reported on 27.7% of returns)
This zip code:
$881
North Carolina:
$1,298
(% of AGI for various income ranges: 1.6% for AGIs below $25k, 0.3% for AGIs $25k-50k, 0.4% for AGIs $50k-75k, 0.3% for AGIs $75k-100k, 0.6% for AGIs $100k-200k)
Ordinary dividends: $1,475 (reported on 10.7% of returns)
Here:
$1,475
State:
$6,213
(% of AGI for various income ranges: 0.2% for AGIs below $25k, 0.1% for AGIs $25k-50k, 0.3% for AGIs $50k-75k, 0.7% for AGIs $75k-100k, 0.6% for AGIs $100k-200k)
Net capital gain/loss in AGI: +$1,264 (reported on 12.5% of returns)
Here:
+$1,264
State:
+$12,740
(% of AGI for various income ranges: 1.8% for AGIs below $25k, 0.2% for AGIs $50k-75k, 0.3% for AGIs $100k-200k)
Profit/loss from business: +$6,200 (reported on 15.2% of returns)
Here:
+$6,200
State:
+$10,311
(% of AGI for various income ranges: 7.3% for AGIs below $25k, 3.9% for AGIs $25k-50k, 1.9% for AGIs $50k-75k)
Taxable individual retirement arrangement distribution: $7,067 (reported on 8.0% of returns)
27852:
$7,067
North Carolina:
$15,575
(% of AGI for various income ranges: 3.0% for AGIs below $25k, 1.9% for AGIs $25k-50k, 2.6% for AGIs $50k-75k)
Total itemized deductions: $18,176 (24% of AGI, reported on 22.3% of returns)
Here:
$18,176
State:
$23,438
Here:
23.8% of AGI
State:
21.5% of AGI
(% of AGI for various income ranges: 4.4% for AGIs below $25k, 9.3% for AGIs $25k-50k, 8.3% for AGIs $50k-75k, 10.3% for AGIs $75k-100k, 14.4% for AGIs $100k-200k)
Charity contributions: $3,900 (reported on 18.8% of returns)
Here:
$3,900
State:
$4,687
(% of AGI for various income ranges: 2.1% for AGIs $25k-50k, 1.1% for AGIs $50k-75k, 1.8% for AGIs $75k-100k, 3.0% for AGIs $100k-200k)
Taxes paid: $6,425 (reported on 21.4% of returns)
27852:
$6,425
State:
$8,823
(% of AGI for various income ranges: 0.9% for AGIs below $25k, 2.0% for AGIs $25k-50k, 2.7% for AGIs $50k-75k, 3.7% for AGIs $75k-100k, 6.2% for AGIs $100k-200k)
Earned income credit: $2,470 (reported on 24.1% of returns)
Here:
$2,470
State:
$2,376
(% of AGI for various income ranges: 8.1% for AGIs below $25k, 1.3% for AGIs $25k-50k)
Percentage of individuals using paid preparers for their 2012 taxes: 62.5%
Here:
62%
State:
53%
(% for various income ranges: 62.0% for AGIs below $25k, 60.0% for AGIs $25k-50k, 62.5% for AGIs $50k-75k, 62.5% for AGIs $75k-100k, 75.0% for AGIs $100k-200k)
Averages for the 2004 tax year for zip code 27852, filed in 2005:
Average Adjusted Gross Income (AGI) in 2004: $37,510 (Individual Income Tax Returns)
Here:
$37,510
State:
$45,376
Salary/wage: $33,429 (reported on 86.4% of returns)
Here:
$33,429
State:
$39,442
(% of AGI for various income ranges: 114.8% for AGIs below $10k, 83.8% for AGIs $10k-25k, 86.0% for AGIs $25k-50k, 87.5% for AGIs $50k-75k, 84.7% for AGIs $75k-100k, 44.5% for AGIs over 100k)
Taxable interest for individuals: $892 (reported on 38.0% of returns)
This zip code:
$892
North Carolina:
$1,515
(% of AGI for various income ranges: 5.2% for AGIs below $10k, 1.5% for AGIs $10k-25k, 0.7% for AGIs $25k-50k, 0.6% for AGIs $50k-75k, 1.0% for AGIs $75k-100k, 0.5% for AGIs over 100k)
Taxable dividends: $2,357 (reported on 15.7% of returns)
Here:
$2,357
State:
$4,016
(% of AGI for various income ranges: 1.2% for AGIs below $10k, 0.2% for AGIs $10k-25k, 0.4% for AGIs $25k-50k, 0.5% for AGIs $50k-75k, 0.2% for AGIs $75k-100k, 3.0% for AGIs over 100k)
Net capital gain/loss: +$13,051 (reported on 10.7% of returns)
Here:
+$13,051
State:
+$11,152
(% of AGI for various income ranges: 1.7% for AGIs below $10k, 0.9% for AGIs $10k-25k, 0.0% for AGIs $25k-50k, -0.1% for AGIs $50k-75k, 0.3% for AGIs $75k-100k, 15.8% for AGIs over 100k)
Profit/loss from business: +$4,279 (reported on 16.4% of returns)
Here:
+$4,279
State:
+$9,490
(% of AGI for various income ranges: 3.0% for AGIs below $10k, 2.8% for AGIs $10k-25k, 1.8% for AGIs $25k-50k, 1.6% for AGIs $50k-75k, 0.3% for AGIs $75k-100k, 2.7% for AGIs over 100k)
IRA payment deduction: $2,222 (reported on 1.6% of returns)
27852:
$2,222
North Carolina:
$2,967
Total itemized deductions: $15,518 (22% of AGI, reported on 25.5% of returns)
Here:
$15,518
State:
$19,464
Here:
22.5% of AGI
State:
22.7% of AGI
(% of AGI for various income ranges: 13.7% for AGIs below $10k, 9.6% for AGIs $10k-25k, 9.7% for AGIs $25k-50k, 10.9% for AGIs $50k-75k, 12.5% for AGIs $75k-100k, 10.2% for AGIs over 100k)
Charity contributions deductions: $3,103 (4% of AGI, reported on 22.3% of returns)
Here:
$3,103
State:
$4,035
Here:
4.2% of AGI
State:
4.5% of AGI
(% of AGI for various income ranges: 1.1% for AGIs $10k-25k, 1.8% for AGIs $25k-50k, 1.7% for AGIs $50k-75k, 2.1% for AGIs $75k-100k, 2.4% for AGIs over 100k)
Total tax: $5,128 (reported on 69.9% of returns)
27852:
$5,128
State:
$7,257
(% of AGI for various income ranges: 3.7% for AGIs below $10k, 3.0% for AGIs $10k-25k, 6.1% for AGIs $25k-50k, 8.6% for AGIs $50k-75k, 10.0% for AGIs $75k-100k, 18.8% for AGIs over 100k)
Earned income credit: $1,881 (reported on 24.7% of returns)
Here:
$1,881
State:
$1,851
Percentage of individuals using paid preparers for their 2004 taxes: 68.2%
Here:
68%
State:
62%
(% for various income ranges: 68.4% for AGIs below $10k, 69.6% for AGIs $10k-25k, 66.4% for AGIs $25k-50k, 61.2% for AGIs $50k-75k, 71.6% for AGIs $75k-100k, 82.6% for AGIs over 100k)
Likely homosexual households (counted as self-reported same-sex unmarried-partner households)
Lesbian couples: 0.0% of all households
Gay men: 0.3% of all households
Household received Food Stamps/SNAP in the past 12 months: 212 Household did not receive Food Stamps/SNAP in the past 12 months: 959
Women who had a birth in the past 12 months: 3 (3 now married, 0 unmarried) Women who did not have a birth in the past 12 months: 625 (141 now married, 481 unmarried)
Housing units in zip code 27852 with a mortgage: 338 (39 second mortgage, 32 both second mortgage and home equity loan) Houses without a mortgage: 14
Median monthly owner costs for units with a mortgage: $1,076 Median monthly owner costs for units without a mortgage: $486
Residents with income below the poverty level in 2022:
This zip code:
16.9%
Whole state:
12.8%
Residents with income below 50% of the poverty level in 2022:
This zip code:
10.3%
Whole state:
6.8%
Median number of rooms in houses and condos:
Here:
6.1
State:
6.4
Median number of rooms in apartments:
Here:
4.8
State:
4.4
Notable locations in this zip code not listed on our city pages
Churches in zip code 27852 include: New Hope Church (A), Cedar Grove Church (B), Community Church (C), Cedar Grove Church (D), Edgewood Church (E), Andrews Church (F), Otter Creek Church (G), Webbtown Church (H), Webbs Chapel (I). Display/hide their locations on the map
Size of family households: 309 2-persons, 449 3-persons, 43 4-persons, 29 5-persons
Size of nonfamily households: 305 1-person, 20 2-persons, 11 3-persons
148 married couples with children.
158 single-parent households (158 women).
98.1% of residents of 27852 zip code speak English at home.
1.2% of residents speak other Indo-European language at home (41% very well, 45% well, 14% not at all).
0.2% of residents speak Asian or Pacific Island language at home (33% very well, 17% well, 50% not well).
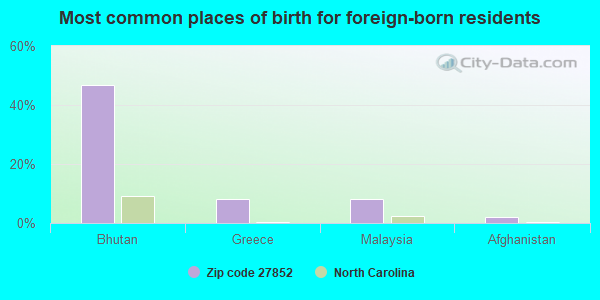
Foreign born population: 50 (2.0%) (57.1% of them are naturalized citizens)
This zip code:
2.0%
Whole state:
8.6%
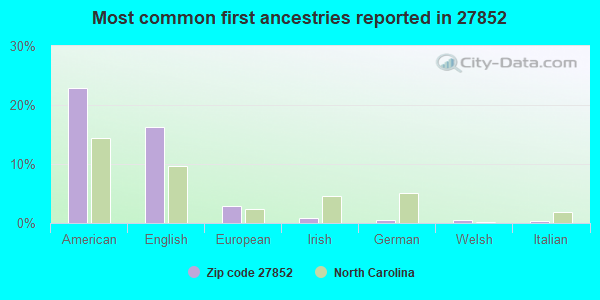
47%Bhutan
8%Greece
8%Malaysia
2%Afghanistan
23%American
16%English
3%European
1%Irish
1%German
0%Welsh
0%Italian
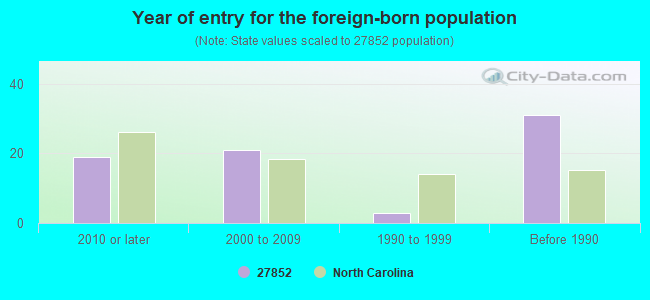
Year of entry for the foreign-born population
192010 or later
212000 to 2009
31990 to 1999
31Before 1990
Housing units lacking complete plumbing facilities: 2.0% Housing units lacking complete kitchen facilities: 1.7%
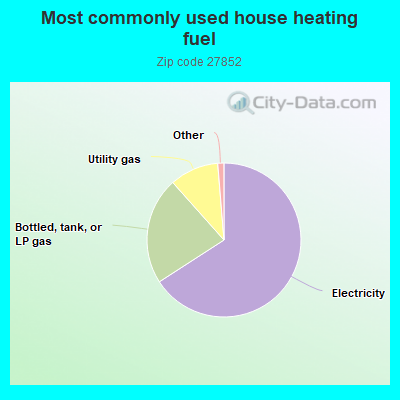
66.0%Electricity
22.6%Bottled, tank, or LP gas
10.3%Utility gas
0.8%Fuel oil, kerosene, etc.
0.5%Other fuel
Population in 1990: 4,145.
Place of birth for U.S.-born residents:
This state: 1,949
Northeast: 44
Midwest: 145
South: 194
West: 52
70% of the 27852 zip code residents lived in the same house 5 years ago. Out of people who lived in different houses, 51% lived in this county. Out of people who lived in different counties, 50% lived in North Carolina.
94% of the 27852 zip code residents lived in the same house 1 year ago. Out of people who lived in different houses, 34% moved from this county. Out of people who lived in different houses, 47% moved from different county within same state. Out of people who lived in different houses, 23% moved from different state. Out of people who lived in different houses, 2% moved from abroad.
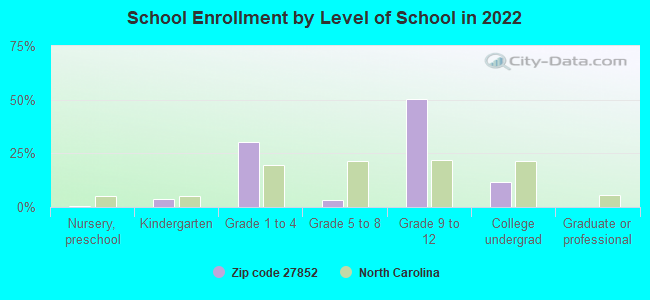
Private vs. public school enrollment:
Students in private schools in grades 1 to 8 (elementary and middle school): 5
Here:
5.1%
North Carolina:
13.8%
Students in private schools in grades 9 to 12 (high school): 18
Here:
10.7%
North Carolina:
11.9%
Students in private undergraduate colleges: 3
Here:
9.8%
North Carolina:
19.3%
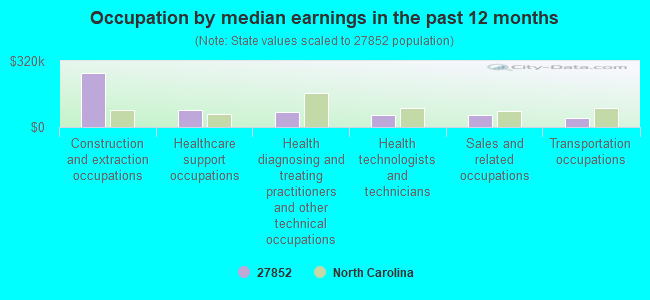
Occupation by median earnings in the past 12 months ($)
261,758Construction and extraction occupations
82,525Healthcare support occupations
71,334Health diagnosing and treating practitioners and other technical occupations
59,418Health technologists and technicians
56,222Sales and related occupations
42,494Transportation occupations
Top industries in this zip code by the number of employees in 2005:
Health Care and Social Assistance: Home Health Care Services (100-249 employees: 1 establishment, 5-9 employees: 1 establishment)
Administrative and Support and Waste Management and Remediation Services: Landscaping Services (5-9: 3)
Health Care and Social Assistance: Offices of Physicians (except Mental Health Specialists) (10-19: 1)
Other Services (except Public Administration): Religious Organizations (5-9: 1, 1-4: 4)
Accommodation and Food Services: Full-Service Restaurants (5-9: 1, 1-4: 1)
Health Care and Social Assistance: Homes for the Elderly (5-9: 1)
Finance and Insurance: Commercial Banking (5-9: 1)
Professional, Scientific, and Technical Services: Landscape Architectural Services (1-4: 1)
Finance and Insurance: Direct Property and Casualty Insurance Carriers (1-4: 1)
Fatal accident statistics in 2014:
Fatal accident count: 1
Vehicles involved in fatal accidents: 1
Fatal accidents caused by drunken drivers: 0
Fatalities: 1
Persons involved in fatal accidents: 1
Pedestrians involved in fatal accidents: 0
Fatal accident statistics in 2013:
Fatal accident count: 1
Vehicles involved in fatal accidents: 1
Fatal accidents caused by drunken drivers: 0
Fatalities: 1
Persons involved in fatal accidents: 1
Pedestrians involved in fatal accidents: 0
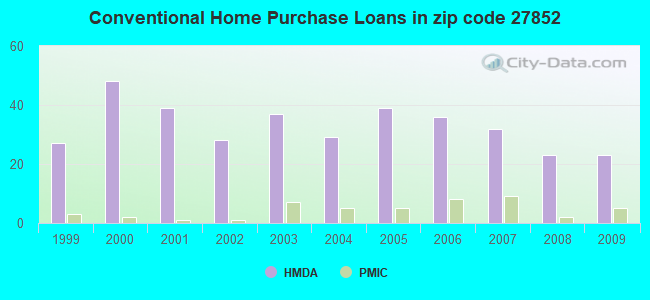
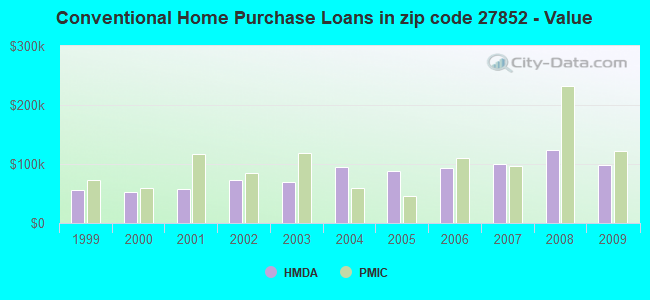
Home Mortgage Disclosure Act Aggregated Statistics For Year 2009 (Based on 4 partial tracts)
A) FHA, FSA/RHS & VA Home Purchase Loans
B) Conventional Home Purchase Loans
C) Refinancings
D) Home Improvement Loans
F) Non-occupant Loans on < 5 Family Dwellings (A B C & D)
G) Loans On Manufactured Home Dwelling (A B C & D)
Number
Average Value
Number
Average Value
Number
Average Value
Number
Average Value
Number
Average Value
Number
Average Value
LOANS ORIGINATED
10
$96,355
23
$97,813
71
$117,974
3
$31,627
5
$66,770
14
$59,763
APPLICATIONS APPROVED, NOT ACCEPTED
0
$0
0
$0
10
$75,218
1
$30,840
0
$0
2
$57,225
APPLICATIONS DENIED
8
$114,874
4
$50,150
29
$87,503
12
$14,619
0
$0
18
$66,117
APPLICATIONS WITHDRAWN
0
$0
3
$86,493
11
$97,223
1
$59,300
1
$23,720
3
$70,307
FILES CLOSED FOR INCOMPLETENESS
0
$0
0
$0
2
$43,290
1
$130,550
0
$0
1
$36,770
Aggregated Statistics For Year 2008 (Based on 4 partial tracts)
A) FHA, FSA/RHS & VA Home Purchase Loans
B) Conventional Home Purchase Loans
C) Refinancings
D) Home Improvement Loans
F) Non-occupant Loans on < 5 Family Dwellings (A B C & D)
G) Loans On Manufactured Home Dwelling (A B C & D)
Number
Average Value
Number
Average Value
Number
Average Value
Number
Average Value
Number
Average Value
Number
Average Value
LOANS ORIGINATED
11
$83,345
23
$123,656
48
$91,842
6
$89,120
5
$126,926
27
$63,478
APPLICATIONS APPROVED, NOT ACCEPTED
0
$0
3
$57,290
9
$86,678
1
$1,190
1
$59,300
2
$57,770
APPLICATIONS DENIED
3
$69,113
9
$87,361
45
$89,684
16
$44,637
3
$74,180
19
$64,858
APPLICATIONS WITHDRAWN
0
$0
5
$90,338
20
$109,541
1
$156,930
0
$0
7
$88,227
FILES CLOSED FOR INCOMPLETENESS
0
$0
1
$326,370
8
$83,821
0
$0
1
$26,390
3
$87,493
Aggregated Statistics For Year 2007 (Based on 4 partial tracts)
A) FHA, FSA/RHS & VA Home Purchase Loans
B) Conventional Home Purchase Loans
C) Refinancings
D) Home Improvement Loans
F) Non-occupant Loans on < 5 Family Dwellings (A B C & D)
G) Loans On Manufactured Home Dwelling (A B C & D)
Number
Average Value
Number
Average Value
Number
Average Value
Number
Average Value
Number
Average Value
Number
Average Value
LOANS ORIGINATED
4
$121,725
32
$99,955
48
$92,878
6
$16,273
6
$39,807
29
$58,445
APPLICATIONS APPROVED, NOT ACCEPTED
1
$157,740
5
$86,218
14
$82,599
3
$78,297
3
$195,307
7
$42,177
APPLICATIONS DENIED
3
$47,683
8
$62,788
69
$94,531
10
$61,214
3
$162,203
13
$61,639
APPLICATIONS WITHDRAWN
0
$0
7
$92,136
23
$115,987
1
$80,650
3
$54,450
5
$65,918
FILES CLOSED FOR INCOMPLETENESS
1
$116,660
0
$0
2
$270,630
0
$0
0
$0
1
$116,660
Aggregated Statistics For Year 2006 (Based on 4 partial tracts)
A) FHA, FSA/RHS & VA Home Purchase Loans
B) Conventional Home Purchase Loans
C) Refinancings
D) Home Improvement Loans
F) Non-occupant Loans on < 5 Family Dwellings (A B C & D)
G) Loans On Manufactured Home Dwelling (A B C & D)
Number
Average Value
Number
Average Value
Number
Average Value
Number
Average Value
Number
Average Value
Number
Average Value
LOANS ORIGINATED
5
$102,944
36
$92,398
57
$79,921
20
$33,805
9
$57,094
17
$61,621
APPLICATIONS APPROVED, NOT ACCEPTED
0
$0
9
$74,393
11
$71,013
1
$4,170
2
$78,870
3
$19,663
APPLICATIONS DENIED
1
$102,590
17
$68,172
60
$81,086
19
$68,427
8
$54,920
22
$65,708
APPLICATIONS WITHDRAWN
1
$64,040
3
$55,053
26
$78,644
3
$98,690
3
$60,487
3
$52,460
FILES CLOSED FOR INCOMPLETENESS
0
$0
1
$388,860
12
$119,926
0
$0
1
$75,000
1
$57,520
Aggregated Statistics For Year 2005 (Based on 4 partial tracts)
A) FHA, FSA/RHS & VA Home Purchase Loans
B) Conventional Home Purchase Loans
C) Refinancings
D) Home Improvement Loans
F) Non-occupant Loans on < 5 Family Dwellings (A B C & D)
G) Loans On Manufactured Home Dwelling (A B C & D)
Number
Average Value
Number
Average Value
Number
Average Value
Number
Average Value
Number
Average Value
Number
Average Value
LOANS ORIGINATED
8
$86,630
39
$88,799
49
$82,193
6
$27,717
6
$73,442
21
$67,682
APPLICATIONS APPROVED, NOT ACCEPTED
0
$0
1
$37,360
21
$67,866
0
$0
1
$26,090
2
$50,110
APPLICATIONS DENIED
1
$113,260
24
$67,225
84
$83,750
24
$46,635
5
$61,554
48
$68,468
APPLICATIONS WITHDRAWN
1
$42,100
11
$84,328
21
$82,248
3
$91,660
1
$69,440
4
$88,580
FILES CLOSED FOR INCOMPLETENESS
0
$0
3
$106,197
9
$139,891
1
$14,820
0
$0
3
$86,150
Aggregated Statistics For Year 2004 (Based on 4 partial tracts)
A) FHA, FSA/RHS & VA Home Purchase Loans
B) Conventional Home Purchase Loans
C) Refinancings
D) Home Improvement Loans
F) Non-occupant Loans on < 5 Family Dwellings (A B C & D)
G) Loans On Manufactured Home Dwelling (A B C & D)
Number
Average Value
Number
Average Value
Number
Average Value
Number
Average Value
Number
Average Value
Number
Average Value
LOANS ORIGINATED
3
$102,460
29
$94,607
53
$75,728
7
$25,797
12
$54,261
13
$47,333
APPLICATIONS APPROVED, NOT ACCEPTED
1
$75,310
5
$35,348
13
$113,485
3
$11,157
1
$97,220
5
$44,130
APPLICATIONS DENIED
3
$109,000
36
$66,930
62
$71,360
15
$69,887
2
$55,740
44
$61,083
APPLICATIONS WITHDRAWN
1
$158,320
3
$240,263
31
$91,381
5
$40,536
0
$0
7
$64,776
FILES CLOSED FOR INCOMPLETENESS
0
$0
0
$0
3
$155,547
1
$83,330
0
$0
0
$0
Aggregated Statistics For Year 2003 (Based on 4 partial tracts)
A) FHA, FSA/RHS & VA Home Purchase Loans
B) Conventional Home Purchase Loans
C) Refinancings
D) Home Improvement Loans
F) Non-occupant Loans on < 5 Family Dwellings (A B C & D)
Number
Average Value
Number
Average Value
Number
Average Value
Number
Average Value
Number
Average Value
LOANS ORIGINATED
2
$88,355
37
$69,314
107
$88,310
11
$11,856
15
$41,953
APPLICATIONS APPROVED, NOT ACCEPTED
0
$0
6
$45,855
14
$72,814
1
$37,500
2
$30,765
APPLICATIONS DENIED
1
$100,220
19
$58,873
63
$80,405
5
$9,132
1
$17,790
APPLICATIONS WITHDRAWN
0
$0
7
$79,806
21
$81,151
1
$20,750
0
$0
FILES CLOSED FOR INCOMPLETENESS
1
$56,330
0
$0
5
$85,616
0
$0
0
$0
Aggregated Statistics For Year 2002 (Based on 4 partial tracts)
A) FHA, FSA/RHS & VA Home Purchase Loans
B) Conventional Home Purchase Loans
C) Refinancings
D) Home Improvement Loans
F) Non-occupant Loans on < 5 Family Dwellings (A B C & D)
Number
Average Value
Number
Average Value
Number
Average Value
Number
Average Value
Number
Average Value
LOANS ORIGINATED
2
$82,130
28
$72,365
72
$83,009
8
$13,640
4
$54,390
APPLICATIONS APPROVED, NOT ACCEPTED
0
$0
10
$42,689
12
$70,624
0
$0
1
$13,640
APPLICATIONS DENIED
0
$0
31
$36,302
46
$65,967
10
$17,814
1
$46,250
APPLICATIONS WITHDRAWN
0
$0
3
$72,500
16
$83,066
3
$11,807
1
$45,660
FILES CLOSED FOR INCOMPLETENESS
0
$0
0
$0
1
$75,310
0
$0
0
$0
Aggregated Statistics For Year 2001 (Based on 4 partial tracts)
A) FHA, FSA/RHS & VA Home Purchase Loans
B) Conventional Home Purchase Loans
C) Refinancings
D) Home Improvement Loans
F) Non-occupant Loans on < 5 Family Dwellings (A B C & D)
Number
Average Value
Number
Average Value
Number
Average Value
Number
Average Value
Number
Average Value
LOANS ORIGINATED
6
$67,925
39
$57,805
51
$82,083
10
$14,384
11
$45,019
APPLICATIONS APPROVED, NOT ACCEPTED
2
$68,285
16
$38,514
8
$50,264
1
$111,100
0
$0
APPLICATIONS DENIED
0
$0
71
$51,865
49
$61,506
4
$13,355
5
$66,952
APPLICATIONS WITHDRAWN
0
$0
3
$32,867
9
$68,781
4
$13,488
1
$55,150
FILES CLOSED FOR INCOMPLETENESS
0
$0
1
$47,440
3
$48,257
1
$111,100
0
$0
Aggregated Statistics For Year 2000 (Based on 4 partial tracts)
A) FHA, FSA/RHS & VA Home Purchase Loans
B) Conventional Home Purchase Loans
C) Refinancings
D) Home Improvement Loans
F) Non-occupant Loans on < 5 Family Dwellings (A B C & D)
Number
Average Value
Number
Average Value
Number
Average Value
Number
Average Value
Number
Average Value
LOANS ORIGINATED
5
$67,050
48
$53,070
30
$61,784
20
$9,702
7
$46,876
APPLICATIONS APPROVED, NOT ACCEPTED
8
$37,352
26
$38,520
11
$75,794
1
$30,550
0
$0
APPLICATIONS DENIED
10
$38,783
80
$43,760
39
$52,731
4
$21,738
6
$62,742
APPLICATIONS WITHDRAWN
1
$21,940
5
$43,262
16
$65,832
1
$5,340
0
$0
FILES CLOSED FOR INCOMPLETENESS
0
$0
1
$187,490
7
$64,480
0
$0
0
$0
Aggregated Statistics For Year 1999 (Based on 2 partial tracts)
A) FHA, FSA/RHS & VA Home Purchase Loans
B) Conventional Home Purchase Loans
C) Refinancings
D) Home Improvement Loans
F) Non-occupant Loans on < 5 Family Dwellings (A B C & D)
Detailed PMIC statistics for the following Tracts:0215.00
, 0216.00
2002 - 2018 National Fire Incident Reporting System (NFIRS) incidents
According to the data from the years 2002 - 2018 the average number of fires per year is 9. The highest number of fires - 24 took place in 2004, and the least - 1 in 2002. The data has a growing trend.
When looking into fire subcategories, the most incidents belonged to: Structure Fires (58.7%), and Outside Fires (26.0%).
Fire incident types reported to NFIRS in Zip Code 27852


 Nearest zip codes: 27864, 27829, 27827, 27873, 27828, 27888.


 According to the data from the years 2002 - 2018 the average number of fires per year is 9. The highest number of fires - 24 took place in 2004, and the least - 1 in 2002. The data has a growing trend.
 When looking into fire subcategories, the most incidents belonged to: Structure Fires (58.7%), and Outside Fires (26.0%).