Estimated zip code population in 2022: 7,215 Zip code population in 2010: 7,969 Zip code population in 2000: 6,452
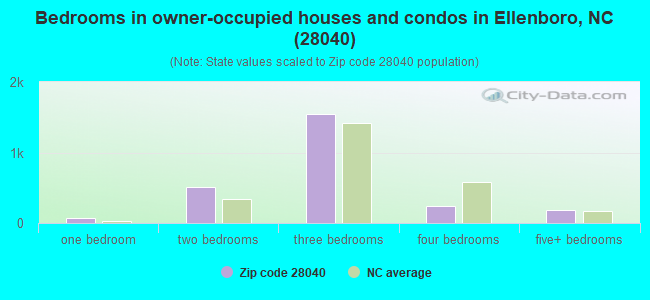
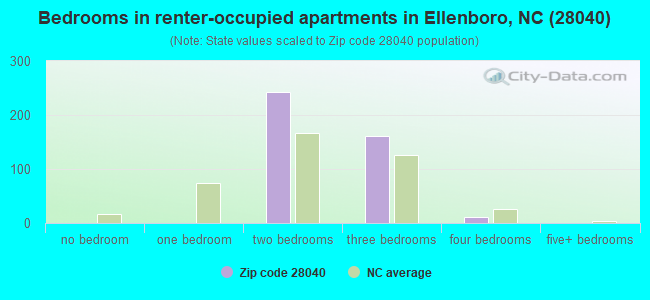
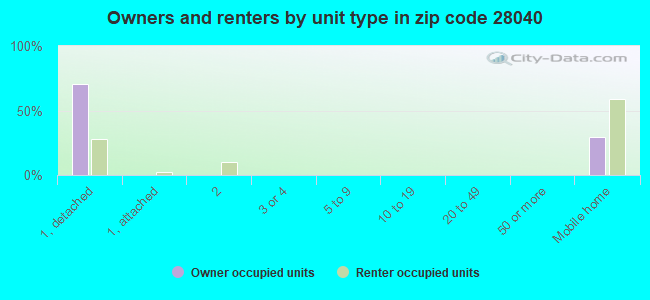
Houses and condos: 3,451 Renter-occupied apartments: 417
% of renters here:
14%
State:
33%
March 2022 cost of living index in zip code 28040: 78.7 (low, U.S. average is 100)
Land area: 71.2 sq. mi. Water area: 0.0 sq. mi.
Population density: 101 people per square mile
(very low).
OSM Map
General Map
Google Map
MSN Map
OSM Map
General Map
Google Map
MSN Map
OSM Map
General Map
Google Map
MSN Map
OSM Map
General Map
Google Map
MSN Map
Please wait while loading the map...
Real estate property taxes paid for housing units in 2022:
This zip code:
0.6% ($796)
North Carolina:
0.6% ($1,769)
Median real estate property taxes paid for housing units with mortgages in 2022: $876 (0.5%) Median real estate property taxes paid for housing units with no mortgage in 2022: $784 (0.6%)
Averages for the 2020 tax year for zip code 28040, filed in 2021:
Average Adjusted Gross Income (AGI) in 2020: $46,790 (Individual Income Tax Returns)
Here:
$46,790
State:
$70,020
Salary/wage: $42,427 (reported on 84.5% of returns)
Here:
$42,427
State:
$58,387
(% of AGI for various income ranges: 1206.9% for AGIs below $25k, 3869.7% for AGIs $25k-50k, 6735.7% for AGIs $50k-75k, 10382.5% for AGIs $75k-100k, 17208.1% for AGIs $100k-200k)
Taxable interest for individuals: $763 (reported on 23.5% of returns)
This zip code:
$763
North Carolina:
$1,479
(% of AGI for various income ranges: 12.2% for AGIs below $25k, 10.1% for AGIs $25k-50k, 40.3% for AGIs $50k-75k, 30.6% for AGIs $75k-100k, 100.0% for AGIs $100k-200k)
Ordinary dividends: $3,223 (reported on 10.0% of returns)
Here:
$3,223
State:
$7,888
(% of AGI for various income ranges: 11.6% for AGIs below $25k, 21.8% for AGIs $25k-50k, 72.0% for AGIs $50k-75k, 87.5% for AGIs $75k-100k, 218.1% for AGIs $100k-200k)
Net capital gain/loss in AGI: +$6,893 (reported on 8.7% of returns)
Here:
+$6,893
State:
+$23,652
(% of AGI for various income ranges: 8.2% for AGIs below $25k, 13.4% for AGIs $25k-50k, 25.1% for AGIs $50k-75k, 160.6% for AGIs $75k-100k, 842.5% for AGIs $100k-200k)
Profit/loss from business: +$4,537 (reported on 13.2% of returns)
Here:
+$4,537
State:
+$11,710
(% of AGI for various income ranges: 95.5% for AGIs below $25k, 86.8% for AGIs $25k-50k, 30.3% for AGIs $50k-75k, 33.8% for AGIs $75k-100k, 146.2% for AGIs $100k-200k)
Taxable individual retirement arrangement distribution: $16,385 (reported on 8.7% of returns)
28040:
$16,385
North Carolina:
$20,247
(% of AGI for various income ranges: 53.3% for AGIs below $25k, 76.8% for AGIs $25k-50k, 250.3% for AGIs $50k-75k, 238.1% for AGIs $75k-100k, 1342.5% for AGIs $100k-200k)
Total itemized deductions: $29,750 (reported on 2.6% of returns)
Here:
$29,750
State:
$34,549
(% of AGI for various income ranges: 113.8% for AGIs $25k-50k, 982.5% for AGIs $100k-200k)
Charity contributions: $12,567 (reported on 1.9% of returns)
Here:
$12,567
State:
$13,360
(% of AGI for various income ranges: 471.3% for AGIs $100k-200k)
Taxes paid: $6,375 (reported on 2.6% of returns)
28040:
$6,375
State:
$7,586
(% of AGI for various income ranges: 15.8% for AGIs $25k-50k, 248.7% for AGIs $100k-200k)
Earned income credit: $2,427 (reported on 24.2% of returns)
Here:
$2,427
State:
$2,337
(% of AGI for various income ranges: 130.3% for AGIs below $25k, 93.0% for AGIs $25k-50k)
Percentage of individuals using paid preparers for their 2020 taxes: 94.8%
Here:
95%
State:
93%
(% for various income ranges: 94.1% for AGIs below $25k, 95.5% for AGIs $25k-50k, 95.9% for AGIs $50k-75k, 91.3% for AGIs $75k-100k, 96.3% for AGIs $100k-200k, 100.0% for AGIs over 200k)
Averages for the 2012 tax year for zip code 28040, filed in 2013:
Average Adjusted Gross Income (AGI) in 2012: $37,264 (Individual Income Tax Returns)
Here:
$37,264
State:
$54,937
Salary/wage: $34,150 (reported on 84.1% of returns)
Here:
$34,150
State:
$46,336
(% of AGI for various income ranges: 74.8% for AGIs below $25k, 81.1% for AGIs $25k-50k, 79.2% for AGIs $50k-75k, 82.8% for AGIs $75k-100k, 65.7% for AGIs $100k-200k)
Taxable interest for individuals: $809 (reported on 27.2% of returns)
This zip code:
$809
North Carolina:
$1,298
(% of AGI for various income ranges: 0.9% for AGIs below $25k, 0.8% for AGIs $25k-50k, 0.3% for AGIs $50k-75k, 0.2% for AGIs $75k-100k, 0.7% for AGIs $100k-200k)
Ordinary dividends: $1,873 (reported on 10.9% of returns)
Here:
$1,873
State:
$6,213
(% of AGI for various income ranges: 0.8% for AGIs below $25k, 0.7% for AGIs $25k-50k, 0.3% for AGIs $50k-75k, 0.3% for AGIs $75k-100k, 0.7% for AGIs $100k-200k)
Net capital gain/loss in AGI: +$1,615 (reported on 7.2% of returns)
Here:
+$1,615
State:
+$12,740
(% of AGI for various income ranges: 0.3% for AGIs below $25k, 0.3% for AGIs $25k-50k, 0.4% for AGIs $50k-75k, 0.2% for AGIs $75k-100k, 0.4% for AGIs $100k-200k)
Profit/loss from business: +$5,271 (reported on 13.8% of returns)
Here:
+$5,271
State:
+$10,311
(% of AGI for various income ranges: 5.2% for AGIs below $25k, 1.6% for AGIs $25k-50k, 2.1% for AGIs $50k-75k, 1.2% for AGIs $75k-100k)
Taxable individual retirement arrangement distribution: $12,721 (reported on 10.1% of returns)
28040:
$12,721
North Carolina:
$15,575
(% of AGI for various income ranges: 4.3% for AGIs below $25k, 2.8% for AGIs $25k-50k, 2.6% for AGIs $50k-75k, 2.7% for AGIs $75k-100k, 5.3% for AGIs $100k-200k)
Total itemized deductions: $18,303 (25% of AGI, reported on 21.0% of returns)
Here:
$18,303
State:
$23,438
Here:
25.5% of AGI
State:
21.5% of AGI
(% of AGI for various income ranges: 5.3% for AGIs below $25k, 8.3% for AGIs $25k-50k, 10.0% for AGIs $50k-75k, 13.5% for AGIs $75k-100k, 15.1% for AGIs $100k-200k)
Charity contributions: $4,616 (reported on 15.9% of returns)
Here:
$4,616
State:
$4,687
(% of AGI for various income ranges: 0.7% for AGIs below $25k, 1.2% for AGIs $25k-50k, 2.0% for AGIs $50k-75k, 2.8% for AGIs $75k-100k, 3.3% for AGIs $100k-200k)
Taxes paid: $5,205 (reported on 21.0% of returns)
28040:
$5,205
State:
$8,823
(% of AGI for various income ranges: 0.6% for AGIs below $25k, 1.6% for AGIs $25k-50k, 2.6% for AGIs $50k-75k, 4.5% for AGIs $75k-100k, 5.9% for AGIs $100k-200k)
Earned income credit: $2,352 (reported on 29.0% of returns)
Here:
$2,352
State:
$2,376
(% of AGI for various income ranges: 8.7% for AGIs below $25k, 1.7% for AGIs $25k-50k)
Percentage of individuals using paid preparers for their 2012 taxes: 60.5%
Here:
61%
State:
53%
(% for various income ranges: 55.7% for AGIs below $25k, 61.1% for AGIs $25k-50k, 67.5% for AGIs $50k-75k, 70.0% for AGIs $75k-100k, 69.2% for AGIs $100k-200k)
Averages for the 2004 tax year for zip code 28040, filed in 2005:
Average Adjusted Gross Income (AGI) in 2004: $32,648 (Individual Income Tax Returns)
Here:
$32,648
State:
$45,376
Salary/wage: $30,607 (reported on 87.6% of returns)
Here:
$30,607
State:
$39,442
(% of AGI for various income ranges: 87.2% for AGIs below $10k, 78.5% for AGIs $10k-25k, 85.6% for AGIs $25k-50k, 85.7% for AGIs $50k-75k, 83.7% for AGIs $75k-100k, 66.2% for AGIs over 100k)
Taxable interest for individuals: $887 (reported on 33.7% of returns)
This zip code:
$887
North Carolina:
$1,515
(% of AGI for various income ranges: 5.1% for AGIs below $10k, 1.2% for AGIs $10k-25k, 0.6% for AGIs $25k-50k, 0.5% for AGIs $50k-75k, 0.5% for AGIs $75k-100k, 1.9% for AGIs over 100k)
Taxable dividends: $1,091 (reported on 14.7% of returns)
Here:
$1,091
State:
$4,016
(% of AGI for various income ranges: 2.2% for AGIs below $10k, 0.6% for AGIs $10k-25k, 0.4% for AGIs $25k-50k, 0.3% for AGIs $50k-75k, 0.5% for AGIs $75k-100k, 0.5% for AGIs over 100k)
Net capital gain/loss: +$3,739 (reported on 8.6% of returns)
Here:
+$3,739
State:
+$11,152
(% of AGI for various income ranges: -0.8% for AGIs below $10k, 0.2% for AGIs $10k-25k, 0.2% for AGIs $25k-50k, 0.6% for AGIs $50k-75k, 0.5% for AGIs $75k-100k, 6.4% for AGIs over 100k)
Profit/loss from business: +$4,478 (reported on 15.9% of returns)
Here:
+$4,478
State:
+$9,490
(% of AGI for various income ranges: 4.3% for AGIs below $10k, 4.1% for AGIs $10k-25k, 2.3% for AGIs $25k-50k, 2.3% for AGIs $50k-75k, 0.8% for AGIs $75k-100k)
IRA payment deduction: $2,800 (reported on 1.7% of returns)
28040:
$2,800
North Carolina:
$2,967
Total itemized deductions: $14,962 (25% of AGI, reported on 24.6% of returns)
Here:
$14,962
State:
$19,464
Here:
25.0% of AGI
State:
22.7% of AGI
(% of AGI for various income ranges: 9.2% for AGIs below $10k, 5.2% for AGIs $10k-25k, 9.4% for AGIs $25k-50k, 13.7% for AGIs $50k-75k, 15.6% for AGIs $75k-100k, 15.3% for AGIs over 100k)
Charity contributions deductions: $3,633 (6% of AGI, reported on 21.1% of returns)
Here:
$3,633
State:
$4,035
Here:
5.9% of AGI
State:
4.5% of AGI
(% of AGI for various income ranges: 1.2% for AGIs below $10k, 0.7% for AGIs $10k-25k, 1.6% for AGIs $25k-50k, 2.8% for AGIs $50k-75k, 4.0% for AGIs $75k-100k, 4.2% for AGIs over 100k)
Total tax: $3,572 (reported on 69.5% of returns)
28040:
$3,572
State:
$7,257
(% of AGI for various income ranges: 2.9% for AGIs below $10k, 3.4% for AGIs $10k-25k, 5.7% for AGIs $25k-50k, 8.1% for AGIs $50k-75k, 10.5% for AGIs $75k-100k, 15.8% for AGIs over 100k)
Earned income credit: $1,802 (reported on 24.5% of returns)
Here:
$1,802
State:
$1,851
Percentage of individuals using paid preparers for their 2004 taxes: 69.6%
Here:
70%
State:
62%
(% for various income ranges: 62.3% for AGIs below $10k, 73.7% for AGIs $10k-25k, 69.8% for AGIs $25k-50k, 70.9% for AGIs $50k-75k, 63.6% for AGIs $75k-100k, 77.3% for AGIs over 100k)
Household received Food Stamps/SNAP in the past 12 months: 535 Household did not receive Food Stamps/SNAP in the past 12 months: 2,447
Women who had a birth in the past 12 months: 62 (18 now married, 42 unmarried) Women who did not have a birth in the past 12 months: 1,771 (865 now married, 908 unmarried)
Housing units in zip code 28040 with a mortgage: 925 (44 second mortgage, 3 home equity loan, 42 both second mortgage and home equity loan) Houses without a mortgage: 187
Median monthly owner costs for units with a mortgage: $855 Median monthly owner costs for units without a mortgage: $314
Residents with income below the poverty level in 2022:
This zip code:
11.4%
Whole state:
12.8%
Residents with income below 50% of the poverty level in 2022:
This zip code:
6.9%
Whole state:
6.8%
Median number of rooms in houses and condos:
Here:
5.9
State:
6.4
Median number of rooms in apartments:
Here:
4.5
State:
4.4
Notable locations in this zip code not listed on our city pages
Churches in zip code 28040 include: Webbs Chapel (A), Ellenboro Presbyterian Church (B), White Oak Springs Church (C), Hopewell Church (D), Hollis Methodist Church (E), Race Path Church (F), Oak Grove Church (G), Piney Mountain Church (H), Mount Olivet Church (I). Display/hide their locations on the map
Streams, rivers, and creeks: Cub Creek (A), Bowen Branch (B), Big Springs Branch (C), Webbs Creek (D), Thompson Branch (E), Taylor Branch (F), Green Branch (G), Isham Fork (H). Display/hide their locations on the map
In group quarters: 10 (-1 institutionalized population)
Size of family households: 882 2-persons, 564 3-persons, 323 4-persons, 176 5-persons, 30 6-persons, 13 7-or-more-persons
Size of nonfamily households: 777 1-person, 184 2-persons, 16 4-persons
716 married couples with children.
366 single-parent households (144 men, 222 women).
94.3% of residents of 28040 zip code speak English at home.
4.5% of residents speak Spanish at home (50% very well, 45% well, 4% not well).
0.6% of residents speak other Indo-European language at home (33% very well, 46% well, 21% not well).
0.2% of residents speak Asian or Pacific Island language at home (100% well).
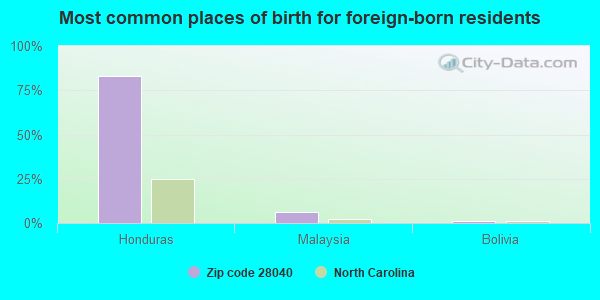
Foreign born population: 231 (3.2%) (92.5% of them are naturalized citizens)
This zip code:
3.2%
Whole state:
8.6%
83%Honduras
6%Malaysia
1%Bolivia
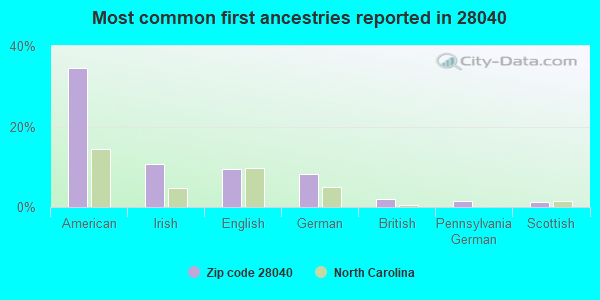
34%American
11%Irish
10%English
8%German
2%British
2%Pennsylvania German
1%Scottish
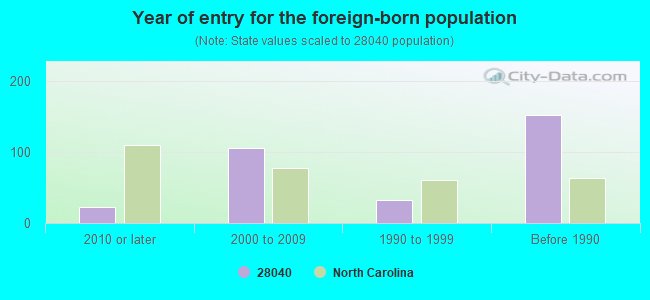
Year of entry for the foreign-born population
222010 or later
1052000 to 2009
321990 to 1999
152Before 1990
Facilities with environmental interests located in this zip code:
DATA PAPERS OF NORTH CAROLINA INCORPORATED (324 TINEY ROAD in ELLENBORO, NC)
AIR MINOR (AIRS/AFS) STATE MASTER (North Carolina facility info) - AIR PROGRAM CRITERIA AND HAZARDOUS AIR POLLUTANT INVENTORY (Inventory of air pollution sources) Business SIC and NAICS classification: MANIFOLD BUSINESS FORMS Alternative names: DATA PAPERS OF NORTH CAROLINA INC ** INA
Housing units lacking complete plumbing facilities: 2.4% Housing units lacking complete kitchen facilities: 1.1%
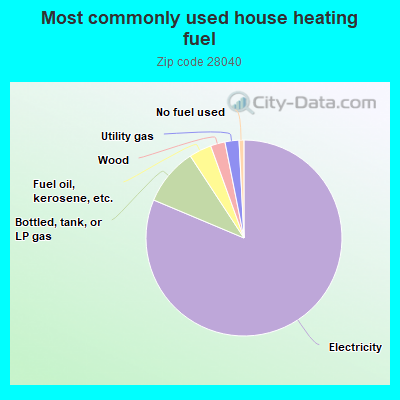
81.1%Electricity
9.4%Bottled, tank, or LP gas
3.7%Fuel oil, kerosene, etc.
2.4%Wood
2.3%Utility gas
0.8%No fuel used
Population in 1990: 8,287.
Place of birth for U.S.-born residents:
This state: 5,347
Northeast: 168
Midwest: 151
South: 1,000
West: 142
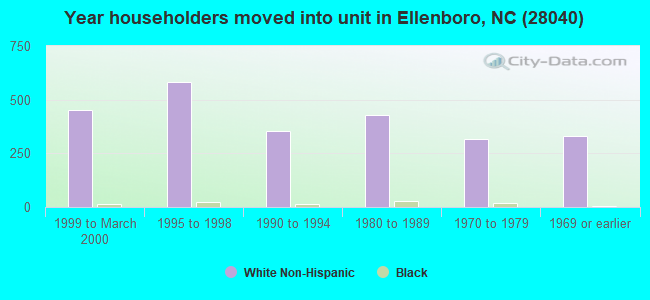
61% of the 28040 zip code residents lived in the same house 5 years ago. Out of people who lived in different houses, 70% lived in this county. Out of people who lived in different counties, 50% lived in North Carolina.
96% of the 28040 zip code residents lived in the same house 1 year ago. Out of people who lived in different houses, 65% moved from this county. Out of people who lived in different houses, 28% moved from different county within same state. Out of people who lived in different houses, 14% moved from different state.
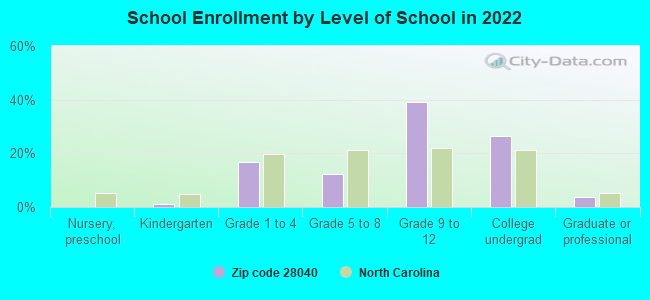
Private vs. public school enrollment:
Students in private schools in grades 1 to 8 (elementary and middle school): 23
Here:
5.9%
North Carolina:
13.8%
Students in private schools in grades 9 to 12 (high school):
Here:
0.0%
North Carolina:
11.9%
Students in private undergraduate colleges: 24
Here:
6.7%
North Carolina:
19.3%
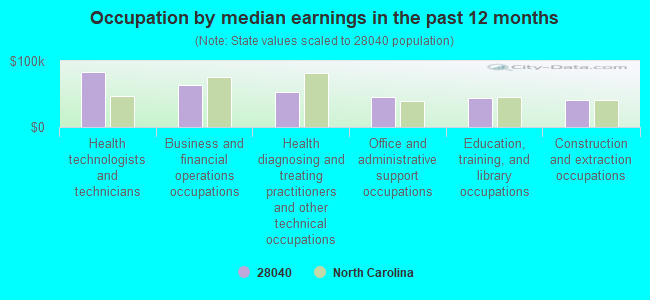
Occupation by median earnings in the past 12 months ($)
83,285Health technologists and technicians
63,173Business and financial operations occupations
52,486Health diagnosing and treating practitioners and other technical occupations
45,085Office and administrative support occupations
44,656Education, training, and library occupations
40,900Construction and extraction occupations
Top industries in this zip code by the number of employees in 2005:
Other Services (except Public Administration): Religious Organizations (20-49 employees: 1 establishment, 5-9 employees: 6 establishments, 1-4 employees: 4 establishments)
Construction: Water and Sewer Line and Related Structures Construction (10-19: 2)
Construction: Plumbing, Heating, and Air-Conditioning Contractors (10-19: 1, 5-9: 1)
Construction: Highway, Street, and Bridge Construction (10-19: 1)
Construction: Other Heavy and Civil Engineering Construction (10-19: 1)
People in group quarters in 2010:
6 people in group homes intended for adults
People in group quarters in 2000:
11 people in nursing homes
Fatal accident statistics in 2013:
Fatal accident count: 1
Vehicles involved in fatal accidents: 1
Fatal accidents caused by drunken drivers: 0
Fatalities: 1
Persons involved in fatal accidents: 1
Pedestrians involved in fatal accidents: 0
Fatal accident statistics in 2012:
Fatal accident count: 1
Vehicles involved in fatal accidents: 2
Fatal accidents caused by drunken drivers: 0
Fatalities: 1
Persons involved in fatal accidents: 2
Pedestrians involved in fatal accidents: 0
2002 - 2018 National Fire Incident Reporting System (NFIRS) incidents
According to the data from the years 2002 - 2018 the average number of fires per year is 44. The highest number of fire incidents - 101 took place in 2005, and the least - 0 in 2003. The data has a rising trend.
When looking into fire subcategories, the most reports belonged to: Structure Fires (45.8%), and Outside Fires (40.6%).
Fire incident types reported to NFIRS in Zip Code 28040
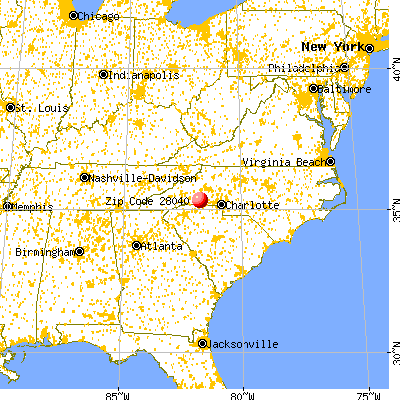


 Nearest zip codes: 28018, 28019, 28089, 28076, 28043, 28114.


 According to the data from the years 2002 - 2018 the average number of fires per year is 44. The highest number of fire incidents - 101 took place in 2005, and the least - 0 in 2003. The data has a rising trend.
 When looking into fire subcategories, the most reports belonged to: Structure Fires (45.8%), and Outside Fires (40.6%).