Estimated zip code population in 2022: 6,835 Zip code population in 2010: 7,056 Zip code population in 2000: 5,999
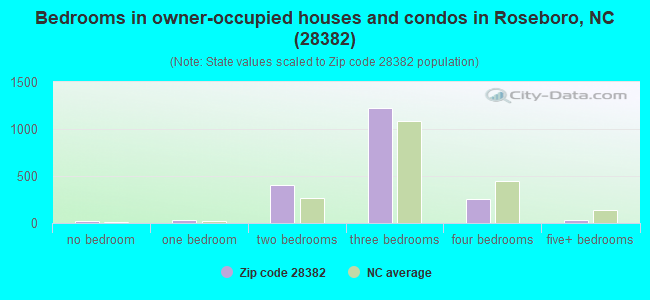
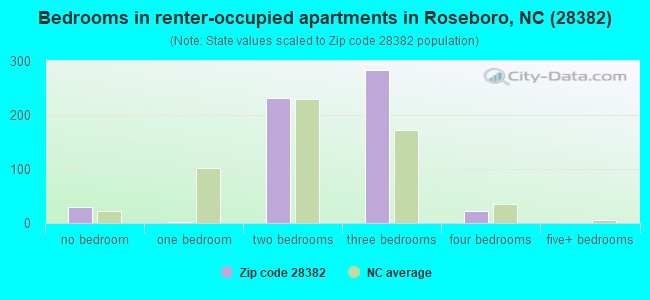
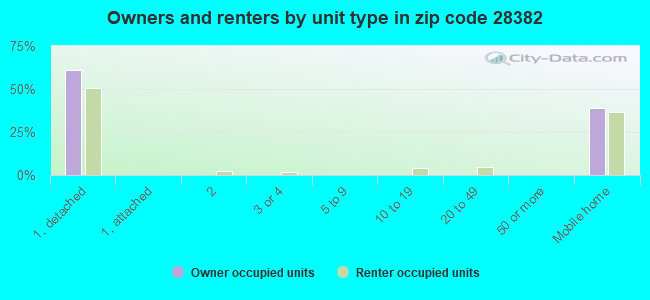
Houses and condos: 3,154 Renter-occupied apartments: 571
% of renters here:
22%
State:
33%
March 2022 cost of living index in zip code 28382: 79.0 (low, U.S. average is 100)
Land area: 118.1 sq. mi. Water area: 0.3 sq. mi.
Population density: 58 people per square mile
(very low).
OSM Map
General Map
Google Map
MSN Map
OSM Map
General Map
Google Map
MSN Map
OSM Map
General Map
Google Map
MSN Map
OSM Map
General Map
Google Map
MSN Map
Please wait while loading the map...
Real estate property taxes paid for housing units in 2022:
This zip code:
0.7% ($931)
North Carolina:
0.6% ($1,769)
Median real estate property taxes paid for housing units with mortgages in 2022: $1,168 (0.7%) Median real estate property taxes paid for housing units with no mortgage in 2022: $881 (0.7%)
Business Search- 14 Million verified businesses
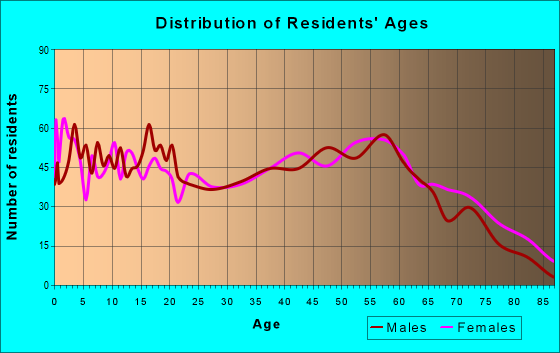
Males: 3,544
(51.9%)
Females: 3,289
(48.1%)
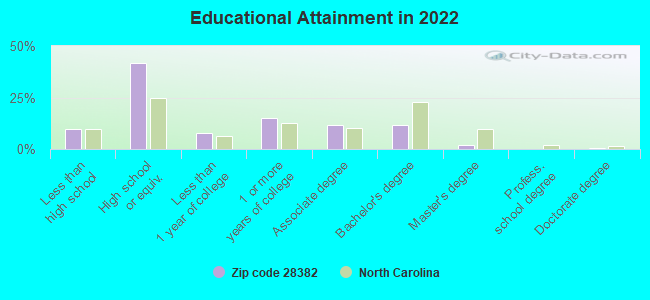
For population 25 years and over in 28382:
High school or higher: 88.6%
Bachelor's degree or higher: 13.8%
Graduate or professional degree: 2.4%
Unemployed: 5.8%
Mean travel time to work (commute): 29.0 minutes
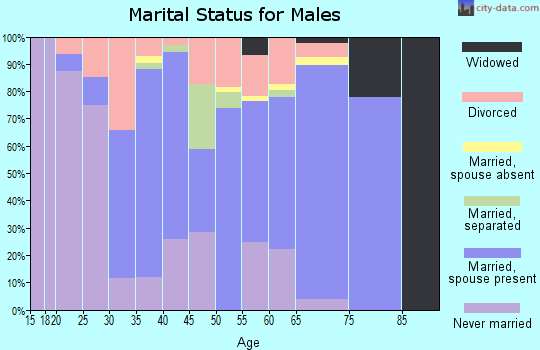
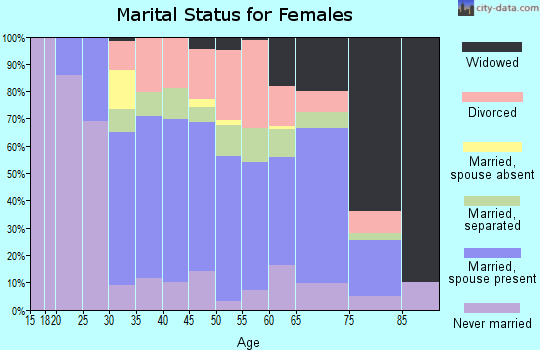
For population 15 years and over in 28382:
Never married: 35.6%
Now married: 51.7%
Separated: 0.9%
Widowed: 7.2%
Divorced: 4.6%
Zip code 28382 compared to state average:
Median house value below state average.
Length of stay since moving in significantly above state average.
Number of college students below state average.
Percentage of population with a bachelor's degree or higher significantly below state average.
Averages for the 2020 tax year for zip code 28382, filed in 2021:
Average Adjusted Gross Income (AGI) in 2020: $43,590 (Individual Income Tax Returns)
Here:
$43,590
State:
$70,020
Salary/wage: $39,069 (reported on 83.3% of returns)
Here:
$39,069
State:
$58,387
(% of AGI for various income ranges: 1336.8% for AGIs below $25k, 3783.7% for AGIs $25k-50k, 6617.5% for AGIs $50k-75k, 9464.7% for AGIs $75k-100k, 18502.5% for AGIs $100k-200k)
Taxable interest for individuals: $698 (reported on 19.7% of returns)
This zip code:
$698
North Carolina:
$1,479
(% of AGI for various income ranges: 7.2% for AGIs below $25k, 10.8% for AGIs $25k-50k, 21.1% for AGIs $50k-75k, 44.7% for AGIs $75k-100k, 48.3% for AGIs $100k-200k)
Ordinary dividends: $2,381 (reported on 5.4% of returns)
Here:
$2,381
State:
$7,888
(% of AGI for various income ranges: 3.2% for AGIs below $25k, 4.4% for AGIs $25k-50k, 25.4% for AGIs $50k-75k, 19.3% for AGIs $75k-100k, 185.8% for AGIs $100k-200k)
Net capital gain/loss in AGI: +$7,768 (reported on 6.4% of returns)
Here:
+$7,768
State:
+$23,652
(% of AGI for various income ranges: 2.4% for AGIs below $25k, 8.4% for AGIs $25k-50k, 16.1% for AGIs $50k-75k, 18.0% for AGIs $75k-100k, 1106.7% for AGIs $100k-200k)
Profit/loss from business: +$5,205 (reported on 14.7% of returns)
Here:
+$5,205
State:
+$11,710
(% of AGI for various income ranges: 85.2% for AGIs below $25k, 71.3% for AGIs $25k-50k, 92.9% for AGIs $50k-75k, 114.7% for AGIs $75k-100k, 506.7% for AGIs $100k-200k)
Taxable individual retirement arrangement distribution: $12,273 (reported on 5.0% of returns)
28382:
$12,273
North Carolina:
$20,247
(% of AGI for various income ranges: 27.8% for AGIs below $25k, 40.6% for AGIs $25k-50k, 185.4% for AGIs $50k-75k, 234.7% for AGIs $75k-100k, 377.5% for AGIs $100k-200k)
Total itemized deductions: $31,738 (reported on 2.7% of returns)
Here:
$31,738
State:
$34,549
(% of AGI for various income ranges: 533.2% for AGIs $50k-75k, 871.7% for AGIs $100k-200k)
Charity contributions: $11,357 (reported on 2.3% of returns)
Here:
$11,357
State:
$13,360
(% of AGI for various income ranges: 96.4% for AGIs $50k-75k, 437.5% for AGIs $100k-200k)
Taxes paid: $5,712 (reported on 2.7% of returns)
28382:
$5,712
State:
$7,586
(% of AGI for various income ranges: 80.0% for AGIs $50k-75k, 194.2% for AGIs $100k-200k)
Earned income credit: $2,443 (reported on 27.4% of returns)
Here:
$2,443
State:
$2,337
(% of AGI for various income ranges: 152.3% for AGIs below $25k, 90.6% for AGIs $25k-50k)
Percentage of individuals using paid preparers for their 2020 taxes: 92.3%
Here:
92%
State:
93%
(% for various income ranges: 92.4% for AGIs below $25k, 93.9% for AGIs $25k-50k, 89.7% for AGIs $50k-75k, 95.2% for AGIs $75k-100k, 87.0% for AGIs $100k-200k, 100.0% for AGIs over 200k)
Averages for the 2012 tax year for zip code 28382, filed in 2013:
Average Adjusted Gross Income (AGI) in 2012: $36,575 (Individual Income Tax Returns)
Here:
$36,575
State:
$54,937
Salary/wage: $33,276 (reported on 86.2% of returns)
Here:
$33,276
State:
$46,336
(% of AGI for various income ranges: 76.9% for AGIs below $25k, 86.3% for AGIs $25k-50k, 75.7% for AGIs $50k-75k, 83.9% for AGIs $75k-100k, 91.9% for AGIs $100k-200k)
Taxable interest for individuals: $773 (reported on 21.1% of returns)
This zip code:
$773
North Carolina:
$1,298
(% of AGI for various income ranges: 0.5% for AGIs below $25k, 0.3% for AGIs $25k-50k, 0.4% for AGIs $50k-75k, 0.2% for AGIs $75k-100k, 1.0% for AGIs $100k-200k)
Ordinary dividends: $1,852 (reported on 6.6% of returns)
Here:
$1,852
State:
$6,213
(% of AGI for various income ranges: 0.1% for AGIs below $25k, 0.2% for AGIs $25k-50k, 0.4% for AGIs $50k-75k, 0.5% for AGIs $75k-100k, 0.8% for AGIs $100k-200k)
Net capital gain/loss in AGI: +$5,000 (reported on 7.9% of returns)
Here:
+$5,000
State:
+$12,740
(% of AGI for various income ranges: 0.2% for AGIs below $25k, 0.5% for AGIs $25k-50k, 1.1% for AGIs $50k-75k, 0.3% for AGIs $75k-100k, 4.1% for AGIs $100k-200k)
Profit/loss from business: +$7,439 (reported on 12.9% of returns)
Here:
+$7,439
State:
+$10,311
(% of AGI for various income ranges: 6.6% for AGIs below $25k, 1.8% for AGIs $25k-50k, 1.7% for AGIs $50k-75k, 1.1% for AGIs $75k-100k, 3.1% for AGIs $100k-200k)
Taxable individual retirement arrangement distribution: $7,550 (reported on 5.0% of returns)
28382:
$7,550
North Carolina:
$15,575
(% of AGI for various income ranges: 1.0% for AGIs below $25k, 1.3% for AGIs $25k-50k, 1.6% for AGIs $50k-75k, 1.0% for AGIs $100k-200k)
Total itemized deductions: $18,118 (25% of AGI, reported on 19.5% of returns)
Here:
$18,118
State:
$23,438
Here:
24.9% of AGI
State:
21.5% of AGI
(% of AGI for various income ranges: 4.8% for AGIs below $25k, 6.5% for AGIs $25k-50k, 11.4% for AGIs $50k-75k, 12.6% for AGIs $75k-100k, 19.6% for AGIs $100k-200k)
Charity contributions: $4,562 (reported on 15.7% of returns)
Here:
$4,562
State:
$4,687
(% of AGI for various income ranges: 0.7% for AGIs below $25k, 1.4% for AGIs $25k-50k, 2.2% for AGIs $50k-75k, 2.3% for AGIs $75k-100k, 4.6% for AGIs $100k-200k)
Taxes paid: $5,744 (reported on 19.5% of returns)
28382:
$5,744
State:
$8,823
(% of AGI for various income ranges: 0.8% for AGIs below $25k, 1.3% for AGIs $25k-50k, 3.2% for AGIs $50k-75k, 4.3% for AGIs $75k-100k, 8.6% for AGIs $100k-200k)
Earned income credit: $2,341 (reported on 27.0% of returns)
Here:
$2,341
State:
$2,376
(% of AGI for various income ranges: 8.1% for AGIs below $25k, 1.2% for AGIs $25k-50k)
Percentage of individuals using paid preparers for their 2012 taxes: 57.5%
Here:
58%
State:
53%
(% for various income ranges: 56.8% for AGIs below $25k, 52.0% for AGIs $25k-50k, 66.7% for AGIs $50k-75k, 61.1% for AGIs $75k-100k, 80.0% for AGIs $100k-200k)
Averages for the 2004 tax year for zip code 28382, filed in 2005:
Average Adjusted Gross Income (AGI) in 2004: $31,731 (Individual Income Tax Returns)
Here:
$31,731
State:
$45,376
Salary/wage: $29,607 (reported on 86.9% of returns)
Here:
$29,607
State:
$39,442
(% of AGI for various income ranges: 104.1% for AGIs below $10k, 81.5% for AGIs $10k-25k, 85.6% for AGIs $25k-50k, 81.1% for AGIs $50k-75k, 81.2% for AGIs $75k-100k, 66.8% for AGIs over 100k)
Taxable interest for individuals: $874 (reported on 29.6% of returns)
This zip code:
$874
North Carolina:
$1,515
(% of AGI for various income ranges: 3.5% for AGIs below $10k, 1.5% for AGIs $10k-25k, 0.4% for AGIs $25k-50k, 0.6% for AGIs $50k-75k, 0.5% for AGIs $75k-100k, 0.9% for AGIs over 100k)
Taxable dividends: $1,276 (reported on 9.2% of returns)
Here:
$1,276
State:
$4,016
(% of AGI for various income ranges: 0.8% for AGIs below $10k, 0.4% for AGIs $10k-25k, 0.3% for AGIs $25k-50k, 0.3% for AGIs $50k-75k, 0.1% for AGIs $75k-100k, 0.8% for AGIs over 100k)
Net capital gain/loss: +$1,820 (reported on 8.4% of returns)
Here:
+$1,820
State:
+$11,152
(% of AGI for various income ranges: -0.6% for AGIs below $10k, -0.1% for AGIs $10k-25k, 0.4% for AGIs $25k-50k, 1.3% for AGIs $50k-75k, 0.4% for AGIs $75k-100k, 0.4% for AGIs over 100k)
Profit/loss from business: +$5,904 (reported on 13.6% of returns)
Here:
+$5,904
State:
+$9,490
(% of AGI for various income ranges: -10.6% for AGIs below $10k, 4.5% for AGIs $10k-25k, 2.6% for AGIs $25k-50k, 1.9% for AGIs $50k-75k, 2.9% for AGIs $75k-100k, 3.3% for AGIs over 100k)
Profit/loss from farming: +$1,210 (reported on 4.9% of returns)
Here:
+$1,210
State:
-$3,231
(% of AGI for various income ranges: -4.0% for AGIs below $10k, -0.7% for AGIs $10k-25k, -0.4% for AGIs $25k-50k, 1.2% for AGIs $50k-75k, 1.9% for AGIs $75k-100k)
IRA payment deduction: $3,027 (reported on 1.3% of returns)
28382:
$3,027
North Carolina:
$2,967
Total itemized deductions: $16,241 (26% of AGI, reported on 23.4% of returns)
Here:
$16,241
State:
$19,464
Here:
25.6% of AGI
State:
22.7% of AGI
(% of AGI for various income ranges: 6.5% for AGIs below $10k, 6.2% for AGIs $10k-25k, 10.8% for AGIs $25k-50k, 13.2% for AGIs $50k-75k, 17.0% for AGIs $75k-100k, 15.6% for AGIs over 100k)
Charity contributions deductions: $3,630 (6% of AGI, reported on 21.0% of returns)
Here:
$3,630
State:
$4,035
Here:
5.5% of AGI
State:
4.5% of AGI
(% of AGI for various income ranges: 1.2% for AGIs below $10k, 1.2% for AGIs $10k-25k, 2.0% for AGIs $25k-50k, 2.5% for AGIs $50k-75k, 3.6% for AGIs $75k-100k, 3.6% for AGIs over 100k)
Total tax: $3,978 (reported on 65.3% of returns)
28382:
$3,978
State:
$7,257
(% of AGI for various income ranges: 2.8% for AGIs below $10k, 2.9% for AGIs $10k-25k, 5.9% for AGIs $25k-50k, 8.5% for AGIs $50k-75k, 9.9% for AGIs $75k-100k, 18.2% for AGIs over 100k)
Earned income credit: $1,922 (reported on 27.9% of returns)
Here:
$1,922
State:
$1,851
Percentage of individuals using paid preparers for their 2004 taxes: 69.2%
Here:
69%
State:
62%
(% for various income ranges: 65.6% for AGIs below $10k, 71.2% for AGIs $10k-25k, 70.1% for AGIs $25k-50k, 67.5% for AGIs $50k-75k, 64.9% for AGIs $75k-100k, 81.6% for AGIs over 100k)
Household received Food Stamps/SNAP in the past 12 months: 459 Household did not receive Food Stamps/SNAP in the past 12 months: 2,101
Women who had a birth in the past 12 months: 114 (9 now married, 99 unmarried) Women who did not have a birth in the past 12 months: 1,375 (554 now married, 820 unmarried)
Housing units in zip code 28382 with a mortgage: 798 (37 second mortgage, 39 both second mortgage and home equity loan) Houses without a mortgage: 16
Median monthly owner costs for units with a mortgage: $1,093 Median monthly owner costs for units without a mortgage: $399
Residents with income below the poverty level in 2022:
This zip code:
14.1%
Whole state:
12.8%
Residents with income below 50% of the poverty level in 2022:
This zip code:
7.9%
Whole state:
6.8%
Median number of rooms in houses and condos:
Here:
6.5
State:
6.4
Median number of rooms in apartments:
Here:
5.0
State:
4.4
Notable locations in this zip code not listed on our city pages
Churches in zip code 28382 include: Hollands Chapel (A), Andrews Chapel (B), Beaver Dam Church (C), Union Chapel (D), Pleasant Union Church (E), Beulah Church (F), Mill Creek Church (G), Old Mill Church (H), Peniel Church (I). Display/hide their locations on the map
Reservoirs and swamps: Howard Pond (A), Warren Millpond (B), Williams Pond (C), Halls Pond (D), Mathews Pond (E), McLambs Pond (F), Jacksons Pond (G), Crumpler Millpond (H). Display/hide their locations on the map
Streams, rivers, and creeks: Betty Branch (A), Bearskin Swamp (B), Beaver Dam Creek (C), Big Swamp (D), Castle Mill Creek (E), Long Branch (F), Mulatto Branch (G), Opossum Swamp (H), Hornet Swamp (I). Display/hide their locations on the map
534 married couples with children.
500 single-parent households (197 men, 303 women).
86.5% of residents of 28382 zip code speak English at home.
13.3% of residents speak Spanish at home (54% very well, 6% well, 15% not well, 26% not at all).
0.2% of residents speak Asian or Pacific Island language at home (100% very well).
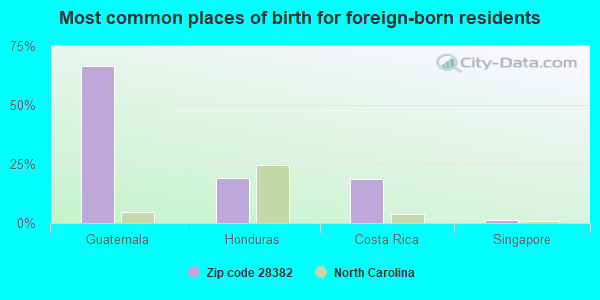
Foreign born population: 720 (10.5%) (51.0% of them are naturalized citizens)
This zip code:
10.5%
Whole state:
8.6%
67%Guatemala
19%Honduras
19%Costa Rica
1%Singapore
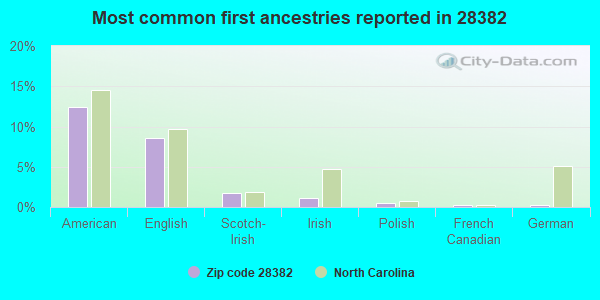
12%American
9%English
2%Scotch-Irish
1%Irish
0%Polish
0%French Canadian
0%German
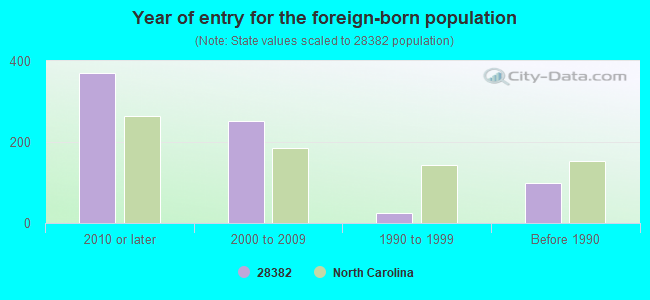
Year of entry for the foreign-born population
3712010 or later
2522000 to 2009
251990 to 1999
100Before 1990
Facilities with environmental interests located in this zip code:
BRADFORD PLYWOOD COMPANY (310 SOUTH EAST STREET in ROSEBORO, NC)
AIR MINOR (AIRS/AFS) STATE MASTER (North Carolina facility info) - -115DA4YG00M69W84AY3V88NB9U, WASTEWATER FACILITY, -653, AIR PROGRAM National Pollutant Discharge Elimination System NON-MAJOR (Tracking pollutant discharge elimination systems) - permit National Pollutant Discharge Elimination System NON-MAJOR (Tracking pollutant discharge elimination systems) - permit Business SIC and NAICS classification: HARDWOOD VENEER AND PLYWOOD
BOREN CLAY PRODUCTS - ROSEBORO (2981 AUTRY HIGHWAY in ROSEBORO, NC)
AIR MAJOR (AIRS/AFS) STATE MASTER (North Carolina facility info) - AIR PROGRAM CRITERIA AND HAZARDOUS AIR POLLUTANT INVENTORY (Inventory of air pollution sources) National Pollutant Discharge Elimination System NON-MAJOR (Tracking pollutant discharge elimination systems) - permit TRI REPORTER (Tracking of toxic chemicals releasing facilities) Business SIC classification: BRICK AND STRUCTURAL CLAY TILE; CLAY REFRACTORIES Business NAICS classification: BRICK AND STRUCTURAL CLAY TILE MANUFACTURING.; BRICK AND STRUCTURAL CLAY TILE MANUFACTURING. Alternative names: BOREN BRICK- ROSEBORO PLANT, BOREN CLAY PRODS., ROSEBORO PLANT, HANSON BRICK ROSEBORO PLANT
BROWNS DRY CLEANERS & LAUNDROMAT (LAKEWOOD PLAZA SHOPPING CENTER in ROSEBORO, NC)
AIR MINOR (AIRS/AFS) STATE MASTER (North Carolina facility info) - AIR PROGRAM Business SIC classification: DRYCLEANING PLANTS, EXCEPT RUG CLEANING
CHARLES CRAFT INCORPORATED (WEST AVENUE in ROSEBORO, NC)
AIR MINOR (AIRS/AFS) STATE MASTER (North Carolina facility info) - AIR PROGRAM, -66AN2CF00066XDA489NUR2CFE7, WASTEWATER FACILITY Business SIC classification: YARN SPINNING MILLS; NONCLASSIFIABLE ESTABLISHMENTS Alternative names: CHARLES CRAFT INC **INACTIVE**
CHARLES E PERRY ELEMENTARY (705 GOLD ST in ROSEBORO, NC)
(National Center for Education Statistics) - STATE ID-312 Organizations: SAMPSON COUNTY SCHOOLS (SCHOOL DISTRICT)
DENNY PLYWOOD CO (310 S EAST ST in ROSEBORO, NC) . Tribal Land
(Resource Conservation and Recovery Act (tracking hazardous waste)) Organizations: WEST COAST PLYWOOD COMPANY (CONTACT/OWNER)
A.D.J. HOG FARM 3-5 (1366 BASS LAKE RD in ROSEBORO, NC)
National Pollutant Discharge Elimination System NON-MAJOR (Tracking pollutant discharge elimination systems) - permit
DENNY PLYWOOD CO (406 S EAST ST in ROSEBORO, NC)
CRITERIA AND HAZARDOUS AIR POLLUTANT INVENTORY (Inventory of air pollution sources) Business SIC and NAICS classification: HARDWOOD VENEER AND PLYWOOD
Housing units lacking complete plumbing facilities: 3.1% Housing units lacking complete kitchen facilities: 2.3%
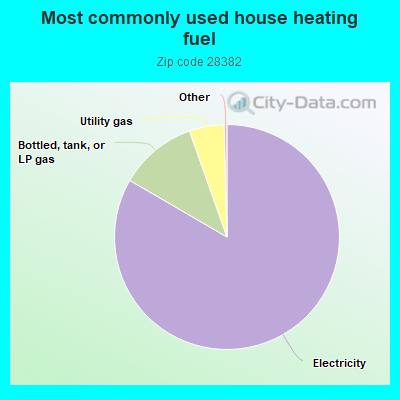
83.4%Electricity
11.2%Bottled, tank, or LP gas
5.0%Utility gas
Population in 1990: 6,495.
Place of birth for U.S.-born residents:
This state: 5,352
Northeast: 220
Midwest: 96
South: 312
West: 47
67% of the 28382 zip code residents lived in the same house 5 years ago. Out of people who lived in different houses, 63% lived in this county. Out of people who lived in different counties, 50% lived in North Carolina.
96% of the 28382 zip code residents lived in the same house 1 year ago. Out of people who lived in different houses, 51% moved from this county. Out of people who lived in different houses, 11% moved from different county within same state. Out of people who lived in different houses, 25% moved from different state. Out of people who lived in different houses, 26% moved from abroad.
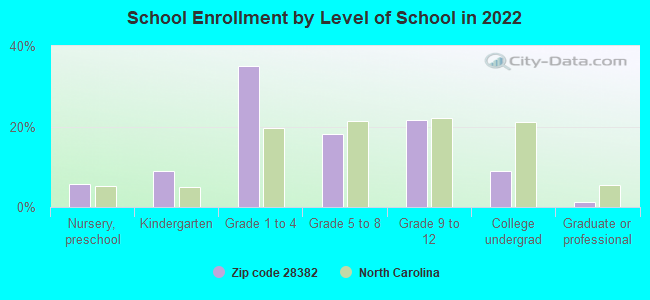
Private vs. public school enrollment:
Students in private schools in grades 1 to 8 (elementary and middle school): 153
Here:
24.9%
North Carolina:
13.8%
Students in private schools in grades 9 to 12 (high school): 45
Here:
18.1%
North Carolina:
11.9%
Students in private undergraduate colleges: 6
Here:
6.4%
North Carolina:
19.3%
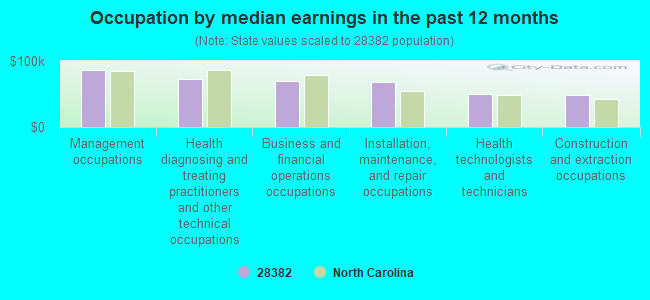
Occupation by median earnings in the past 12 months ($)
86,043Management occupations
73,286Health diagnosing and treating practitioners and other technical occupations
70,074Business and financial operations occupations
68,018Installation, maintenance, and repair occupations
50,159Health technologists and technicians
48,268Construction and extraction occupations
Companies with federal contracts located in this zip code:
M&T CONSTRUCTION (4646 BEAVER DAM CHURCH ROA in ROSEBORO, NC; small business) : $16,990 in 2 contractsin 2000
$10,490 with Army for Maintenance, Repair or Alteration of Real Property -- Religious Facilities. Signed on 2000-03-23. Completion date: 2000-06-15.
$6,500 with Army for Maintenance, Repair or Alteration of Real Property -- Miscellaneous Buildings. Signed on 2000-05-17. Completion date: 2000-07-06.
Top industries in this zip code by the number of employees in 2005:
Wholesale Trade: Metal Service Centers and Other Metal Merchant Wholesalers (100-249 employees: 1 establishment)
Accommodation and Food Services: Caterers (50-99: 1)
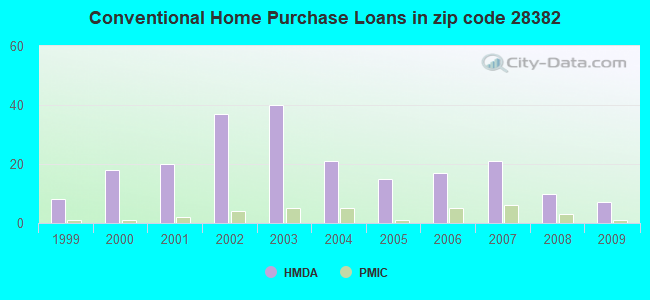
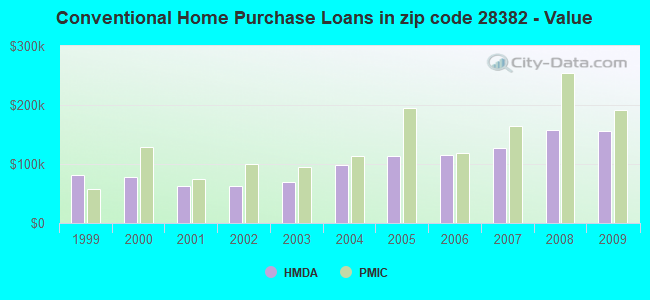
Detailed PMIC statistics for the following Tracts:0029.00
2002 - 2018 National Fire Incident Reporting System (NFIRS) incidents
Based on the data from the years 2002 - 2018 the average number of fire incidents per year is 88. The highest number of reported fires - 170 took place in 2007, and the least - 5 in 2003. The data has a growing trend.
When looking into fire subcategories, the most incidents belonged to: Outside Fires (48.8%), and Structure Fires (40.8%).
Fire incident types reported to NFIRS in Zip Code 28382


+$1,210
-$3,231
(% of AGI for various income ranges: -4.0% for AGIs below $10k, -0.7% for AGIs $10k-25k, -0.4% for AGIs $25k-50k, 1.2% for AGIs $50k-75k, 1.9% for AGIs $75k-100k) Nearest zip codes: 28385, 28318, 28328, 28441, 28391, 28344.
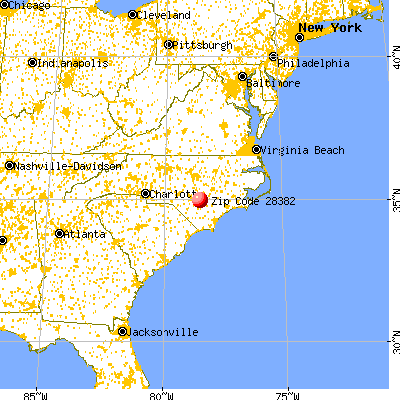
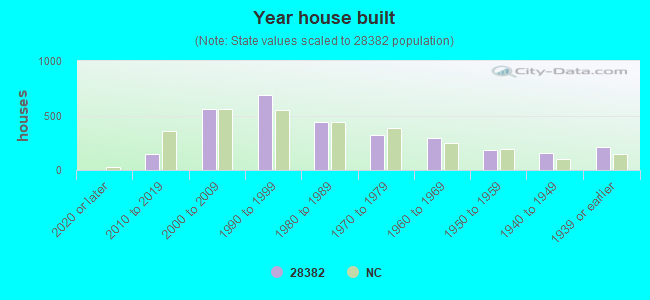


 Based on the data from the years 2002 - 2018 the average number of fire incidents per year is 88. The highest number of reported fires - 170 took place in 2007, and the least - 5 in 2003. The data has a growing trend.
 When looking into fire subcategories, the most incidents belonged to: Outside Fires (48.8%), and Structure Fires (40.8%).