Estimated zip code population in 2022: 6,471 Zip code population in 2010: 4,903 Zip code population in 2000: 2,869
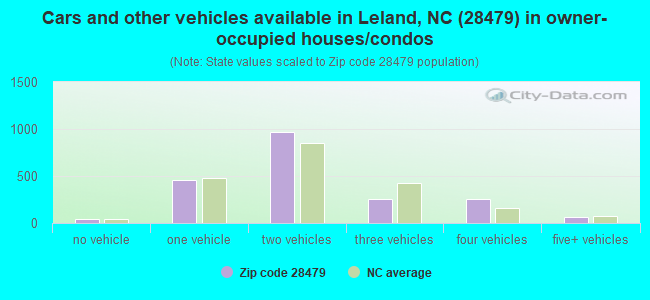
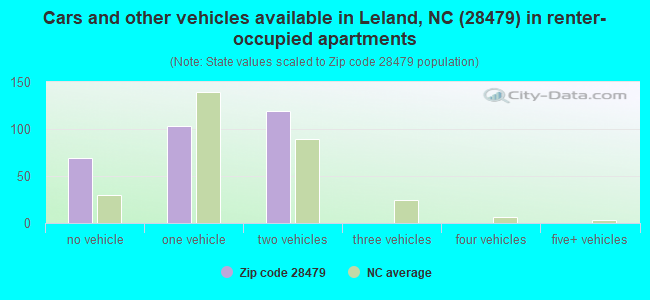
Houses and condos: 2,545 Renter-occupied apartments: 296
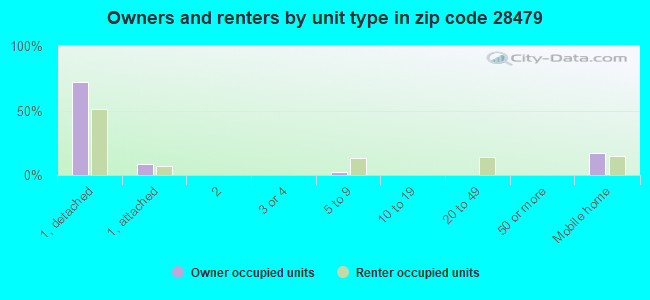
% of renters here:
13%
State:
33%
March 2022 cost of living index in zip code 28479: 81.7 (low, U.S. average is 100)
Land area: 93.0 sq. mi. Water area: 12.0 sq. mi.
Population density: 70 people per square mile
(very low).
OSM Map
General Map
Google Map
MSN Map
OSM Map
General Map
Google Map
MSN Map
OSM Map
General Map
Google Map
MSN Map
OSM Map
General Map
Google Map
MSN Map
Please wait while loading the map...
Real estate property taxes paid for housing units in 2022:
This zip code:
0.5% ($1,314)
North Carolina:
0.6% ($1,769)
Median real estate property taxes paid for housing units with mortgages in 2022: $1,411 (0.4%) Median real estate property taxes paid for housing units with no mortgage in 2022: $1,085 (0.5%)
Business Search- 14 Million verified businesses
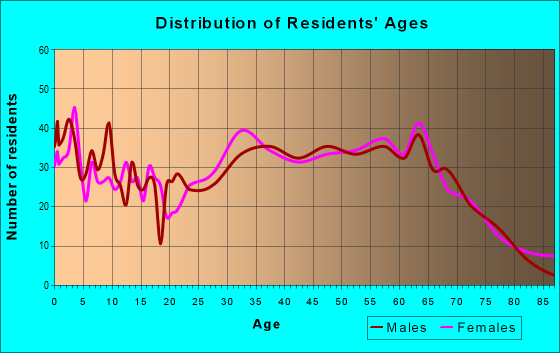
Males: 3,393
(52.5%)
Females: 3,076
(47.5%)
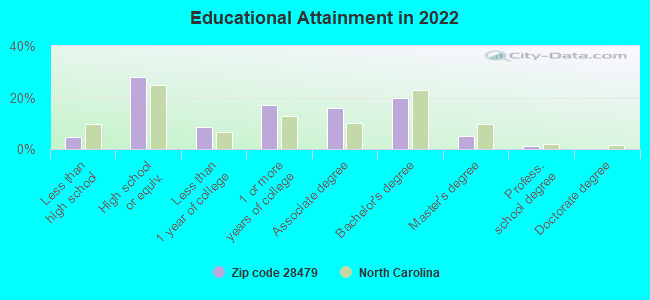
For population 25 years and over in 28479:
High school or higher: 94.8%
Bachelor's degree or higher: 25.8%
Graduate or professional degree: 6.3%
Unemployed: 5.0%
Mean travel time to work (commute): 25.6 minutes
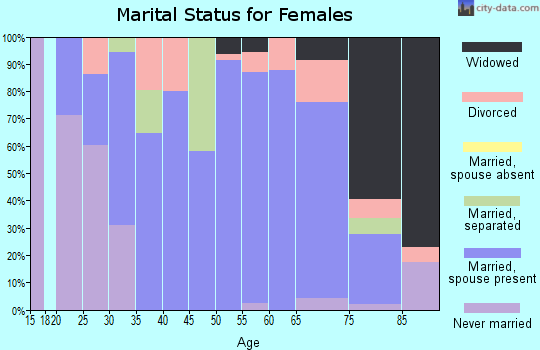
For population 15 years and over in 28479:
Never married: 21.9%
Now married: 57.1%
Separated: 1.8%
Widowed: 5.6%
Divorced: 13.6%
Zip code 28479 compared to state average:
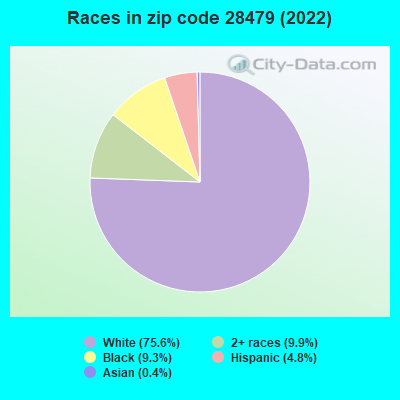
Black race population percentage below state average.
Hispanic race population percentage below state average.
Foreign-born population percentage significantly below state average.
Renting percentage significantly below state average.
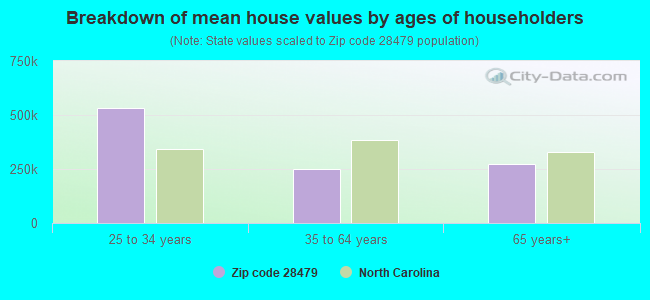
Estimated median house/condo value in 2022: $289,798
28479:
$289,798
North Carolina:
$280,600
According to our research of North Carolina and other state lists, there were 14 registered sex offenders living in 28479 zip code as of April 27, 2024. The ratio of all residents to sex offenders in zip code 28479 is 453 to 1. The ratio of registered sex offenders to all residents in this zip code is near the state average.
Median resident age:
This zip code:
39.8 years
North Carolina median age:
39.2 years
Average household size:
This zip code:
2.7 people
North Carolina:
2.4 people
Averages for the 2020 tax year for zip code 28479, filed in 2021:
Average Adjusted Gross Income (AGI) in 2020: $60,255 (Individual Income Tax Returns)
Here:
$60,255
State:
$70,020
Salary/wage: $54,314 (reported on 78.9% of returns)
Here:
$54,314
State:
$58,387
(% of AGI for various income ranges: 1094.7% for AGIs below $25k, 3452.9% for AGIs $25k-50k, 6235.3% for AGIs $50k-75k, 8907.0% for AGIs $75k-100k, 17725.9% for AGIs $100k-200k)
Taxable interest for individuals: $624 (reported on 31.3% of returns)
This zip code:
$624
North Carolina:
$1,479
(% of AGI for various income ranges: 13.3% for AGIs below $25k, 20.3% for AGIs $25k-50k, 41.4% for AGIs $50k-75k, 33.0% for AGIs $75k-100k, 53.1% for AGIs $100k-200k)
Ordinary dividends: $2,463 (reported on 16.3% of returns)
Here:
$2,463
State:
$7,888
(% of AGI for various income ranges: 17.7% for AGIs below $25k, 35.2% for AGIs $25k-50k, 45.0% for AGIs $50k-75k, 73.3% for AGIs $75k-100k, 138.8% for AGIs $100k-200k)
Net capital gain/loss in AGI: +$6,782 (reported on 15.1% of returns)
Here:
+$6,782
State:
+$23,652
(% of AGI for various income ranges: 8.6% for AGIs below $25k, 23.1% for AGIs $25k-50k, 68.3% for AGIs $50k-75k, 151.9% for AGIs $75k-100k, 433.1% for AGIs $100k-200k)
Profit/loss from business: +$9,161 (reported on 17.2% of returns)
Here:
+$9,161
State:
+$11,710
(% of AGI for various income ranges: 165.4% for AGIs below $25k, 158.5% for AGIs $25k-50k, 162.5% for AGIs $50k-75k, 237.4% for AGIs $75k-100k, 579.7% for AGIs $100k-200k)
Taxable individual retirement arrangement distribution: $16,233 (reported on 11.7% of returns)
28479:
$16,233
North Carolina:
$20,247
(% of AGI for various income ranges: 60.1% for AGIs below $25k, 153.4% for AGIs $25k-50k, 298.6% for AGIs $50k-75k, 401.5% for AGIs $75k-100k, 875.0% for AGIs $100k-200k)
Total itemized deductions: $27,605 (reported on 5.7% of returns)
Here:
$27,605
State:
$34,549
(% of AGI for various income ranges: 128.2% for AGIs $25k-50k, 229.4% for AGIs $50k-75k, 324.8% for AGIs $75k-100k, 858.4% for AGIs $100k-200k)
Charity contributions: $6,825 (reported on 4.8% of returns)
Here:
$6,825
State:
$13,360
(% of AGI for various income ranges: 7.3% for AGIs below $25k, 41.4% for AGIs $50k-75k, 48.5% for AGIs $75k-100k, 237.8% for AGIs $100k-200k)
Taxes paid: $6,711 (reported on 5.7% of returns)
28479:
$6,711
State:
$7,586
(% of AGI for various income ranges: 19.2% for AGIs $25k-50k, 51.1% for AGIs $50k-75k, 74.4% for AGIs $75k-100k, 240.9% for AGIs $100k-200k)
Earned income credit: $2,350 (reported on 15.1% of returns)
Here:
$2,350
State:
$2,337
(% of AGI for various income ranges: 108.9% for AGIs below $25k, 66.6% for AGIs $25k-50k)
Percentage of individuals using paid preparers for their 2020 taxes: 93.4%
Here:
93%
State:
93%
(% for various income ranges: 90.9% for AGIs below $25k, 93.8% for AGIs $25k-50k, 94.2% for AGIs $50k-75k, 97.4% for AGIs $75k-100k, 93.0% for AGIs $100k-200k, 100.0% for AGIs over 200k)
Averages for the 2012 tax year for zip code 28479, filed in 2013:
Average Adjusted Gross Income (AGI) in 2012: $49,904 (Individual Income Tax Returns)
Here:
$49,904
State:
$54,937
Salary/wage: $44,421 (reported on 84.2% of returns)
Here:
$44,421
State:
$46,336
(% of AGI for various income ranges: 69.2% for AGIs below $25k, 73.2% for AGIs $25k-50k, 73.5% for AGIs $50k-75k, 76.5% for AGIs $75k-100k, 76.4% for AGIs $100k-200k, 82.1% for AGIs over 200k)
Taxable interest for individuals: $754 (reported on 30.8% of returns)
This zip code:
$754
North Carolina:
$1,298
(% of AGI for various income ranges: 1.2% for AGIs below $25k, 0.3% for AGIs $25k-50k, 0.4% for AGIs $50k-75k, 0.3% for AGIs $75k-100k, 0.6% for AGIs $100k-200k)
Ordinary dividends: $2,220 (reported on 15.8% of returns)
Here:
$2,220
State:
$6,213
(% of AGI for various income ranges: 1.2% for AGIs below $25k, 0.6% for AGIs $25k-50k, 1.0% for AGIs $50k-75k, 0.6% for AGIs $75k-100k, 0.7% for AGIs $100k-200k)
Net capital gain/loss in AGI: +$2,286 (reported on 10.0% of returns)
Here:
+$2,286
State:
+$12,740
(% of AGI for various income ranges: 0.2% for AGIs $75k-100k, 1.6% for AGIs $100k-200k)
Profit/loss from business: +$7,715 (reported on 15.4% of returns)
Here:
+$7,715
State:
+$10,311
(% of AGI for various income ranges: 7.8% for AGIs below $25k, 2.9% for AGIs $25k-50k, 1.9% for AGIs $50k-75k, 0.7% for AGIs $75k-100k, 2.1% for AGIs $100k-200k)
Taxable individual retirement arrangement distribution: $13,046 (reported on 11.8% of returns)
28479:
$13,046
North Carolina:
$15,575
(% of AGI for various income ranges: 2.8% for AGIs below $25k, 2.6% for AGIs $25k-50k, 3.1% for AGIs $50k-75k, 3.5% for AGIs $75k-100k, 3.8% for AGIs $100k-200k)
Total itemized deductions: $19,237 (24% of AGI, reported on 37.1% of returns)
Here:
$19,237
State:
$23,438
Here:
23.7% of AGI
State:
21.5% of AGI
(% of AGI for various income ranges: 11.6% for AGIs below $25k, 11.5% for AGIs $25k-50k, 15.2% for AGIs $50k-75k, 14.1% for AGIs $75k-100k, 16.2% for AGIs $100k-200k, 15.3% for AGIs over 200k)
Charity contributions: $2,806 (reported on 29.4% of returns)
Here:
$2,806
State:
$4,687
(% of AGI for various income ranges: 1.2% for AGIs below $25k, 1.3% for AGIs $25k-50k, 1.9% for AGIs $50k-75k, 1.4% for AGIs $75k-100k, 2.0% for AGIs $100k-200k, 1.7% for AGIs over 200k)
Taxes paid: $5,813 (reported on 37.1% of returns)
28479:
$5,813
State:
$8,823
(% of AGI for various income ranges: 1.3% for AGIs below $25k, 2.3% for AGIs $25k-50k, 4.0% for AGIs $50k-75k, 4.8% for AGIs $75k-100k, 6.0% for AGIs $100k-200k, 7.0% for AGIs over 200k)
Earned income credit: $2,227 (reported on 18.6% of returns)
Here:
$2,227
State:
$2,376
(% of AGI for various income ranges: 6.8% for AGIs below $25k, 1.0% for AGIs $25k-50k)
Percentage of individuals using paid preparers for their 2012 taxes: 48.4%
Here:
48%
State:
53%
(% for various income ranges: 46.9% for AGIs below $25k, 43.4% for AGIs $25k-50k, 55.6% for AGIs $50k-75k, 45.8% for AGIs $75k-100k, 60.0% for AGIs $100k-200k)
Averages for the 2004 tax year for zip code 28479, filed in 2005:
Average Adjusted Gross Income (AGI) in 2004: $35,523 (Individual Income Tax Returns)
Here:
$35,523
State:
$45,376
Salary/wage: $33,760 (reported on 84.7% of returns)
Here:
$33,760
State:
$39,442
(% of AGI for various income ranges: 117.9% for AGIs below $10k, 80.0% for AGIs $10k-25k, 80.4% for AGIs $25k-50k, 83.9% for AGIs $50k-75k, 80.5% for AGIs $75k-100k, 71.4% for AGIs over 100k)
Taxable interest for individuals: $632 (reported on 32.7% of returns)
This zip code:
$632
North Carolina:
$1,515
(% of AGI for various income ranges: 2.0% for AGIs below $10k, 0.5% for AGIs $10k-25k, 0.6% for AGIs $25k-50k, 0.6% for AGIs $50k-75k, 0.8% for AGIs $75k-100k, 0.2% for AGIs over 100k)
Taxable dividends: $1,284 (reported on 14.1% of returns)
Here:
$1,284
State:
$4,016
(% of AGI for various income ranges: 2.0% for AGIs below $10k, 0.2% for AGIs $10k-25k, 0.3% for AGIs $25k-50k, 0.5% for AGIs $50k-75k, 1.0% for AGIs $75k-100k, 0.4% for AGIs over 100k)
Net capital gain/loss: +$98 (reported on 10.3% of returns)
Here:
+$98
State:
+$11,152
(% of AGI for various income ranges: 0.0% for AGIs below $10k, -0.2% for AGIs $10k-25k, -0.3% for AGIs $25k-50k, 0.3% for AGIs $50k-75k, 0.2% for AGIs $75k-100k, 0.1% for AGIs over 100k)
Profit/loss from business: +$3,536 (reported on 20.7% of returns)
Here:
+$3,536
State:
+$9,490
(% of AGI for various income ranges: 16.8% for AGIs below $10k, 5.8% for AGIs $10k-25k, 3.5% for AGIs $25k-50k, 0.6% for AGIs $50k-75k, 0.5% for AGIs $75k-100k, -0.7% for AGIs over 100k)
IRA payment deduction: $2,682 (reported on 1.6% of returns)
28479:
$2,682
North Carolina:
$2,967
Total itemized deductions: $15,622 (25% of AGI, reported on 33.0% of returns)
Here:
$15,622
State:
$19,464
Here:
25.2% of AGI
State:
22.7% of AGI
(% of AGI for various income ranges: 9.7% for AGIs $10k-25k, 15.3% for AGIs $25k-50k, 13.8% for AGIs $50k-75k, 17.2% for AGIs $75k-100k, 16.8% for AGIs over 100k)
Charity contributions deductions: $3,065 (5% of AGI, reported on 28.6% of returns)
Here:
$3,065
State:
$4,035
Here:
4.8% of AGI
State:
4.5% of AGI
(% of AGI for various income ranges: 1.2% for AGIs $10k-25k, 2.5% for AGIs $25k-50k, 2.1% for AGIs $50k-75k, 3.2% for AGIs $75k-100k, 3.5% for AGIs over 100k)
Total tax: $4,171 (reported on 72.6% of returns)
28479:
$4,171
State:
$7,257
(% of AGI for various income ranges: 5.7% for AGIs below $10k, 3.6% for AGIs $10k-25k, 6.4% for AGIs $25k-50k, 8.1% for AGIs $50k-75k, 10.3% for AGIs $75k-100k, 14.8% for AGIs over 100k)
Earned income credit: $1,869 (reported on 23.0% of returns)
Here:
$1,869
State:
$1,851
Percentage of individuals using paid preparers for their 2004 taxes: 58.6%
Here:
59%
State:
62%
(% for various income ranges: 45.7% for AGIs below $10k, 58.9% for AGIs $10k-25k, 66.5% for AGIs $25k-50k, 64.0% for AGIs $50k-75k, 56.8% for AGIs $75k-100k, 59.3% for AGIs over 100k)
Household received Food Stamps/SNAP in the past 12 months: 513 Household did not receive Food Stamps/SNAP in the past 12 months: 1,823
Women who did not have a birth in the past 12 months: 1,398 (718 now married, 682 unmarried)
Housing units in zip code 28479 with a mortgage: 1,366 (108 second mortgage, 59 both second mortgage and home equity loan) Houses without a mortgage: 59
Median monthly owner costs for units with a mortgage: $1,437 Median monthly owner costs for units without a mortgage: $424
Residents with income below the poverty level in 2022:
This zip code:
6.1%
Whole state:
12.8%
Residents with income below 50% of the poverty level in 2022:
This zip code:
5.3%
Whole state:
6.8%
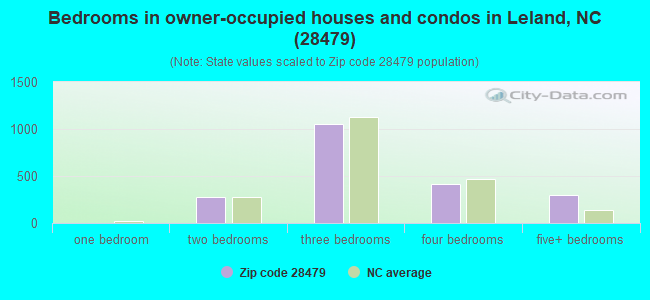
Median number of rooms in houses and condos:
Here:
6.5
State:
6.4
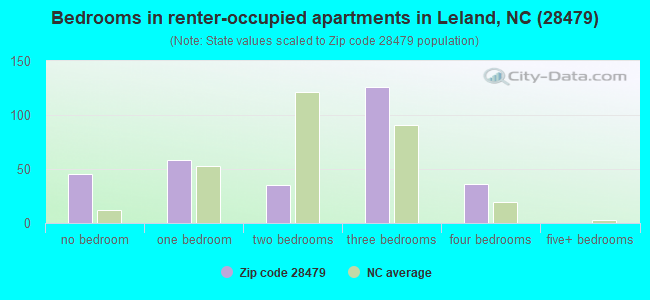
Median number of rooms in apartments:
Here:
4.4
State:
4.4
Notable locations in this zip code not listed on our city pages
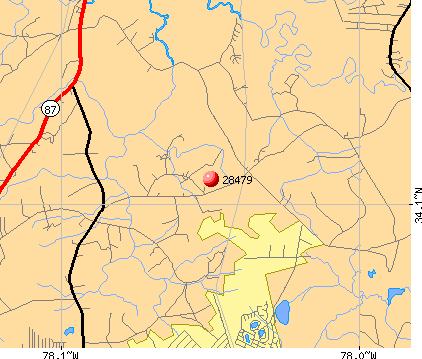
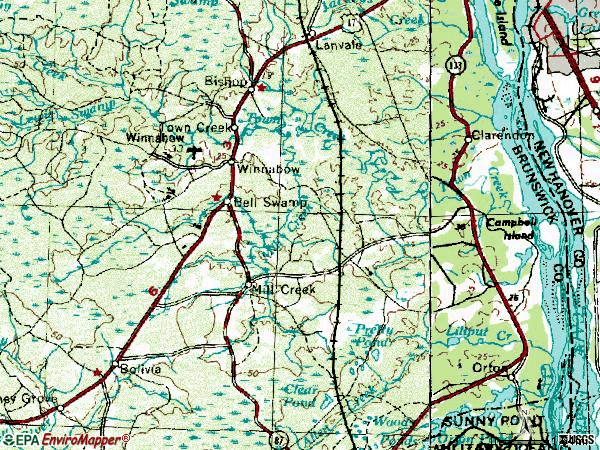
Notable locations in zip code 28479: Clarendon (A), Brunswick Station (B), Anderson Landing (C), Pinelevel (D), Orton Plantation (E), Brunswick Cove Nursing Center (F). Display/hide their locations on the map
Churches in zip code 28479 include: Wayside Church (A), Mount Zion Church (B), Christian Chapel (C), Orton Church (D), Town Creek Church (E), Saint Mary Church (F), New Hope Church (G), Peace Memorial Church (H), New Hope Church (I). Display/hide their locations on the map
Lakes, reservoirs, and swamps: Sampson Pond (A), Mc Kinzie Pond (B), Blue Pond (C), Orton Pond (D), Beaverdam Pond (E), Big Bay (F). Display/hide their locations on the map
Streams, rivers, and creeks: Dews Creek (A), Cherry Tree Swamp (B), Brunswick River (C), Bell Swamp (D), Allen Creek (E), Willet Branch (F), White Spring Creek (G), Town Creek (H), Tom Branch (I). Display/hide their locations on the map
In group quarters: 174 (-1 institutionalized population)
Size of family households: 761 2-persons, 500 3-persons, 149 4-persons, 217 5-persons, 89 6-persons
Size of nonfamily households: 517 1-person, 88 2-persons
1,173 married couples with children.
187 single-parent households (39 men, 148 women).
95.4% of residents of 28479 zip code speak English at home.
3.5% of residents speak Spanish at home (67% very well, 16% well, 18% not well).
0.2% of residents speak other Indo-European language at home (100% well).
0.4% of residents speak Asian or Pacific Island language at home (100% very well).
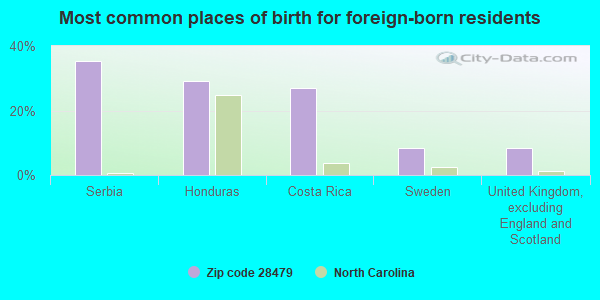
Foreign born population: 50 (0.8%) (100.0% of them are naturalized citizens)
This zip code:
0.8%
Whole state:
8.6%
35%Serbia
29%Honduras
27%Costa Rica
8%Sweden
8%United Kingdom, excluding England and Scotland
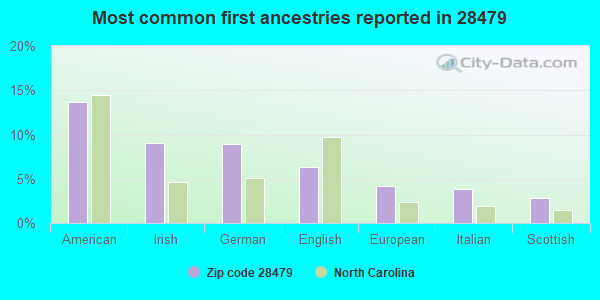
14%American
9%Irish
9%German
6%English
4%European
4%Italian
3%Scottish
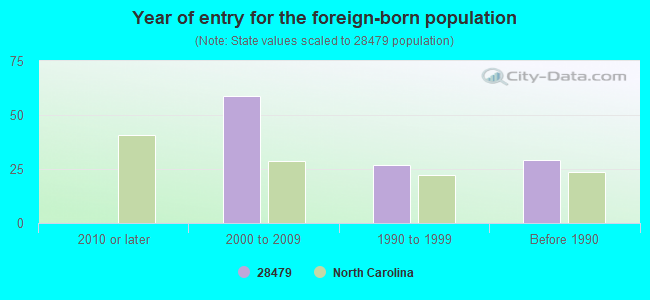
Year of entry for the foreign-born population
02010 or later
592000 to 2009
271990 to 1999
29Before 1990
Public elementary/middle school in in zip code 28479 not listed on the city page:
Facilities with environmental interests located in this zip code:
BELL SWAMP FARMS, INC. (1027 BELL SWAMP RD in WINNABOW, NC)
National Pollutant Discharge Elimination System NON-MAJOR (Tracking pollutant discharge elimination systems) - permit
BRUNSWICK CO/TOWN CREEK PARK (HWY 17 N in WINNABOW, NC)
National Pollutant Discharge Elimination System NON-MAJOR (Tracking pollutant discharge elimination systems) - permit Business SIC classification: SEWERAGE SYSTEMS
Housing units lacking complete plumbing facilities: 2.9% Housing units lacking complete kitchen facilities: 1.5%
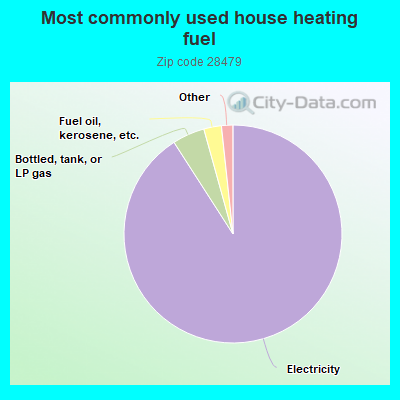
90.9%Electricity
4.8%Bottled, tank, or LP gas
2.6%Fuel oil, kerosene, etc.
0.9%No fuel used
0.5%Utility gas
Population in 1990: 3,084.
Place of birth for U.S.-born residents:
This state: 3,123
Northeast: 1,081
Midwest: 677
South: 1,251
West: 221
58% of the 28479 zip code residents lived in the same house 5 years ago. Out of people who lived in different houses, 50% lived in this county. Out of people who lived in different counties, 50% lived in North Carolina.
88% of the 28479 zip code residents lived in the same house 1 year ago. Out of people who lived in different houses, 21% moved from this county. Out of people who lived in different houses, 73% moved from different county within same state. Out of people who lived in different houses, 9% moved from different state.
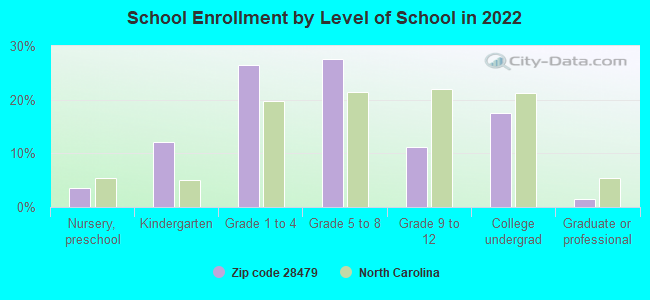
Private vs. public school enrollment:
Students in private schools in grades 1 to 8 (elementary and middle school): 252
Here:
32.0%
North Carolina:
13.8%
Students in private schools in grades 9 to 12 (high school): 32
Here:
20.0%
North Carolina:
11.9%
Students in private undergraduate colleges:
Here:
0.0%
North Carolina:
19.3%
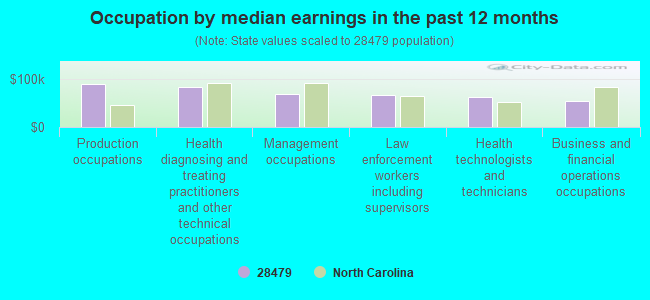
Occupation by median earnings in the past 12 months ($)
89,861Production occupations
83,286Health diagnosing and treating practitioners and other technical occupations
70,141Management occupations
67,889Law enforcement workers including supervisors
64,084Health technologists and technicians
55,146Business and financial operations occupations
Companies with federal contracts located in this zip code:
SOUTHERN PINES LAWN & LANDSCAP (831 CAISON LOOP RD in WINNABOW, NC; small business) : $43,872 in 9 contractsfrom 2003 to 2006
Contracts for Landscaping/Groundskeeping Services by Army, U.S. Army Corps of Engineers - civil program financing only Signed by year:2000: $0; 2001: $0; 2002: $0; 2003: $3,480; 2004: $15,930; 2005: $16,200; 2006: $8,262.
Biggest contracts:
$8,262 with Army for Landscaping/Groundskeeping Services. Signed on 2006-01-03. Completion date: 2006-12-31.
$8,100, same as above.Signed on 2005-02-09. Completion date: 2002-03-18.
$8,100 with U.S. Army Corps of Engineers - civil program financing only for Landscaping/Groundskeeping Services. Signed on 2005-02-09. Completion date: 2002-03-18.
$7,965, same as above.Signed on 2004-03-15. Completion date: 2002-03-18.
Top industries in this zip code by the number of employees in 2005:
Health Care and Social Assistance: Nursing Care Facilities (100-249 employees: 1 establishment)
Construction: Other Heavy and Civil Engineering Construction (20-49: 1)
Construction: New Single-Family Housing Construction (except Operative Builders) (10-19: 1, 5-9: 1, 1-4: 4)
Arts, Entertainment, and Recreation: Golf Courses and Country Clubs (5-9: 1)
Construction: Site Preparation Contractors (5-9: 1)
Construction: Roofing Contractors (5-9: 1)
Other Services (except Public Administration): Commercial and Industrial Machinery and Equipment (except Automotive and Electronic) Repair and Maintenance (5-9: 1)
Professional, Scientific, and Technical Services: Other Accounting Services (5-9: 1)
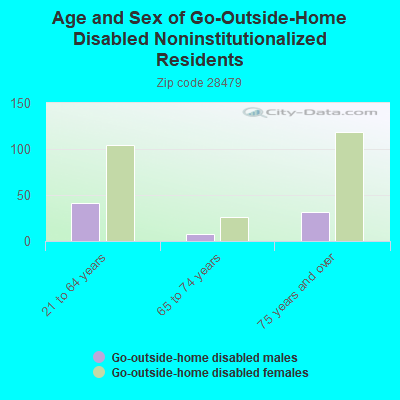
People in group quarters in 2010:
184 people in nursing facilities/skilled-nursing facilities
11 people in residential treatment centers for adults
People in group quarters in 2000:
157 people in other noninstitutional group quarters
Fatal accident statistics in 2014:
Fatal accident count: 2
Vehicles involved in fatal accidents: 5
Fatal accidents caused by drunken drivers: 0
Fatalities: 2
Persons involved in fatal accidents: 6
Pedestrians involved in fatal accidents: 0
Fatal accident statistics in 2012:
Fatal accident count: 5
Vehicles involved in fatal accidents: 7
Fatal accidents caused by drunken drivers: 1
Fatalities: 5
Persons involved in fatal accidents: 8
Pedestrians involved in fatal accidents: 0
Home Mortgage Disclosure Act Aggregated Statistics For Year 2009 (Based on 8 partial tracts)
A) FHA, FSA/RHS & VA Home Purchase Loans
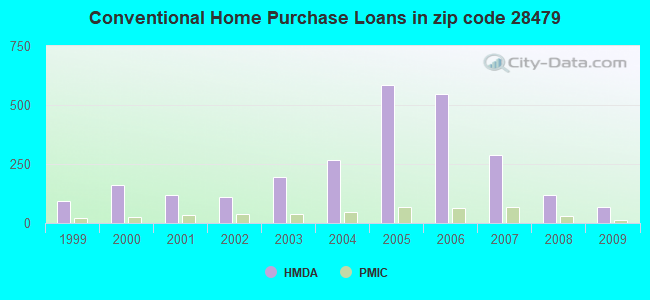
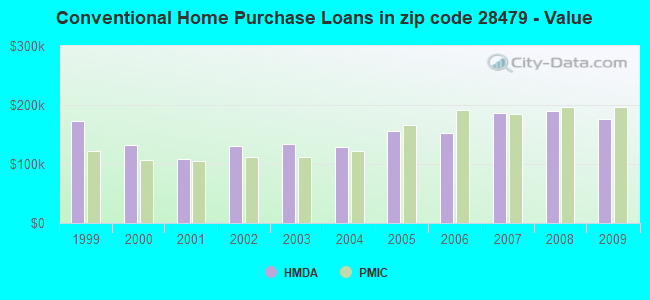
B) Conventional Home Purchase Loans
C) Refinancings
D) Home Improvement Loans
F) Non-occupant Loans on < 5 Family Dwellings (A B C & D)
G) Loans On Manufactured Home Dwelling (A B C & D)
Number
Average Value
Number
Average Value
Number
Average Value
Number
Average Value
Number
Average Value
Number
Average Value
LOANS ORIGINATED
65
$160,924
66
$176,017
342
$168,926
14
$85,255
34
$215,726
16
$70,258
APPLICATIONS APPROVED, NOT ACCEPTED
5
$154,512
4
$137,115
24
$195,170
2
$13,960
4
$261,698
2
$34,725
APPLICATIONS DENIED
11
$175,550
12
$195,588
135
$165,354
11
$53,115
16
$166,918
14
$70,986
APPLICATIONS WITHDRAWN
12
$153,224
9
$157,520
73
$167,760
3
$44,630
6
$187,592
5
$75,610
FILES CLOSED FOR INCOMPLETENESS
6
$139,620
9
$271,682
19
$155,409
1
$189,740
4
$326,675
1
$77,330
Aggregated Statistics For Year 2008 (Based on 8 partial tracts)
A) FHA, FSA/RHS & VA Home Purchase Loans
B) Conventional Home Purchase Loans
C) Refinancings
D) Home Improvement Loans
E) Loans on Dwellings For 5+ Families
F) Non-occupant Loans on < 5 Family Dwellings (A B C & D)
G) Loans On Manufactured Home Dwelling (A B C & D)
Number
Average Value
Number
Average Value
Number
Average Value
Number
Average Value
Number
Average Value
Number
Average Value
Number
Average Value
LOANS ORIGINATED
67
$163,729
120
$190,408
254
$183,758
21
$71,054
1
$358,000
56
$245,051
23
$79,787
APPLICATIONS APPROVED, NOT ACCEPTED
4
$157,878
11
$181,929
34
$181,274
1
$105,970
0
$0
3
$175,660
2
$73,390
APPLICATIONS DENIED
11
$150,685
21
$171,158
154
$173,077
32
$95,676
0
$0
6
$196,065
16
$86,994
APPLICATIONS WITHDRAWN
5
$141,052
19
$186,499
58
$173,976
3
$142,723
0
$0
6
$185,683
3
$96,183
FILES CLOSED FOR INCOMPLETENESS
1
$186,880
4
$368,740
21
$177,602
1
$200,480
0
$0
1
$298,570
0
$0
Aggregated Statistics For Year 2007 (Based on 8 partial tracts)
A) FHA, FSA/RHS & VA Home Purchase Loans
B) Conventional Home Purchase Loans
C) Refinancings
D) Home Improvement Loans
E) Loans on Dwellings For 5+ Families
F) Non-occupant Loans on < 5 Family Dwellings (A B C & D)
G) Loans On Manufactured Home Dwelling (A B C & D)
Number
Average Value
Number
Average Value
Number
Average Value
Number
Average Value
Number
Average Value
Number
Average Value
Number
Average Value
LOANS ORIGINATED
31
$159,322
289
$186,299
317
$162,153
36
$62,053
1
$412,420
94
$253,990
32
$70,437
APPLICATIONS APPROVED, NOT ACCEPTED
1
$70,880
37
$202,938
48
$158,415
9
$60,621
0
$0
14
$356,824
2
$76,255
APPLICATIONS DENIED
8
$154,298
41
$157,014
186
$192,265
34
$95,039
0
$0
20
$454,052
16
$74,106
APPLICATIONS WITHDRAWN
5
$136,040
50
$227,344
90
$207,521
6
$254,777
0
$0
32
$296,469
4
$56,922
FILES CLOSED FOR INCOMPLETENESS
1
$239,140
11
$220,203
26
$187,922
1
$14,320
0
$0
3
$148,927
1
$75,900
Aggregated Statistics For Year 2006 (Based on 8 partial tracts)
A) FHA, FSA/RHS & VA Home Purchase Loans
B) Conventional Home Purchase Loans
C) Refinancings
D) Home Improvement Loans
F) Non-occupant Loans on < 5 Family Dwellings (A B C & D)
G) Loans On Manufactured Home Dwelling (A B C & D)
Number
Average Value
Number
Average Value
Number
Average Value
Number
Average Value
Number
Average Value
Number
Average Value
LOANS ORIGINATED
47
$157,124
548
$151,847
323
$158,473
48
$77,313
200
$165,969
32
$71,622
APPLICATIONS APPROVED, NOT ACCEPTED
1
$170,410
59
$130,737
43
$133,909
5
$22,340
24
$158,862
11
$65,612
APPLICATIONS DENIED
4
$137,472
102
$162,272
135
$141,561
27
$66,959
25
$207,296
34
$62,250
APPLICATIONS WITHDRAWN
2
$168,620
55
$187,527
90
$180,472
10
$102,674
24
$189,979
7
$102,490
FILES CLOSED FOR INCOMPLETENESS
0
$0
11
$167,805
24
$147,197
1
$143,200
5
$154,226
1
$35,800
Aggregated Statistics For Year 2005 (Based on 8 partial tracts)
A) FHA, FSA/RHS & VA Home Purchase Loans
B) Conventional Home Purchase Loans
C) Refinancings
D) Home Improvement Loans
E) Loans on Dwellings For 5+ Families
F) Non-occupant Loans on < 5 Family Dwellings (A B C & D)
G) Loans On Manufactured Home Dwelling (A B C & D)
Number
Average Value
Number
Average Value
Number
Average Value
Number
Average Value
Number
Average Value
Number
Average Value
Number
Average Value
LOANS ORIGINATED
57
$147,308
584
$156,352
261
$152,884
21
$80,158
1
$158,240
178
$193,014
23
$65,312
APPLICATIONS APPROVED, NOT ACCEPTED
1
$211,940
45
$117,742
35
$141,297
5
$64,726
0
$0
6
$113,128
5
$44,106
APPLICATIONS DENIED
7
$128,471
91
$106,180
132
$117,126
37
$47,662
0
$0
16
$171,929
29
$65,600
APPLICATIONS WITHDRAWN
2
$198,690
56
$144,875
58
$136,262
8
$89,231
0
$0
14
$114,406
7
$104,434
FILES CLOSED FOR INCOMPLETENESS
1
$91,650
16
$168,215
39
$127,448
1
$39,380
0
$0
2
$115,275
1
$66,590
Aggregated Statistics For Year 2004 (Based on 8 partial tracts)
A) FHA, FSA/RHS & VA Home Purchase Loans
B) Conventional Home Purchase Loans
C) Refinancings
D) Home Improvement Loans
E) Loans on Dwellings For 5+ Families
F) Non-occupant Loans on < 5 Family Dwellings (A B C & D)
G) Loans On Manufactured Home Dwelling (A B C & D)
Number
Average Value
Number
Average Value
Number
Average Value
Number
Average Value
Number
Average Value
Number
Average Value
Number
Average Value
LOANS ORIGINATED
50
$125,100
269
$129,532
168
$110,912
20
$73,498
1
$21,480
72
$129,845
24
$64,887
APPLICATIONS APPROVED, NOT ACCEPTED
5
$110,408
23
$92,457
29
$98,141
4
$49,940
0
$0
4
$111,875
12
$57,340
APPLICATIONS DENIED
3
$88,067
45
$90,852
120
$96,791
23
$35,427
0
$0
3
$106,923
32
$59,025
APPLICATIONS WITHDRAWN
2
$134,250
26
$160,274
63
$109,696
5
$85,634
0
$0
10
$202,127
10
$69,667
FILES CLOSED FOR INCOMPLETENESS
1
$166,110
9
$171,999
13
$112,742
1
$121,720
0
$0
1
$98,810
0
$0
Aggregated Statistics For Year 2003 (Based on 8 partial tracts)
A) FHA, FSA/RHS & VA Home Purchase Loans
B) Conventional Home Purchase Loans
C) Refinancings
D) Home Improvement Loans
F) Non-occupant Loans on < 5 Family Dwellings (A B C & D)
Number
Average Value
Number
Average Value
Number
Average Value
Number
Average Value
Number
Average Value
LOANS ORIGINATED
35
$113,230
197
$134,742
366
$126,255
8
$22,465
79
$194,108
APPLICATIONS APPROVED, NOT ACCEPTED
6
$86,755
34
$68,399
47
$108,893
3
$41,527
6
$169,692
APPLICATIONS DENIED
9
$78,919
75
$67,753
105
$105,736
14
$35,851
6
$117,902
APPLICATIONS WITHDRAWN
1
$115,280
22
$161,686
61
$113,058
1
$81,620
10
$290,266
FILES CLOSED FOR INCOMPLETENESS
0
$0
6
$104,655
9
$147,734
1
$35,800
4
$187,055
Aggregated Statistics For Year 2002 (Based on 8 partial tracts)
A) FHA, FSA/RHS & VA Home Purchase Loans
B) Conventional Home Purchase Loans
C) Refinancings
D) Home Improvement Loans
F) Non-occupant Loans on < 5 Family Dwellings (A B C & D)
Number
Average Value
Number
Average Value
Number
Average Value
Number
Average Value
Number
Average Value
LOANS ORIGINATED
32
$107,601
112
$130,670
222
$119,317
6
$30,072
34
$199,596
APPLICATIONS APPROVED, NOT ACCEPTED
2
$110,980
30
$62,292
28
$111,517
1
$65,870
6
$205,133
APPLICATIONS DENIED
6
$103,343
69
$61,389
100
$77,321
4
$29,892
4
$60,322
APPLICATIONS WITHDRAWN
3
$120,287
12
$96,362
53
$96,592
2
$17,900
4
$116,350
FILES CLOSED FOR INCOMPLETENESS
2
$135,325
7
$173,579
15
$100,288
1
$68,740
0
$0
Aggregated Statistics For Year 2001 (Based on 8 partial tracts)
A) FHA, FSA/RHS & VA Home Purchase Loans
B) Conventional Home Purchase Loans
C) Refinancings
D) Home Improvement Loans
F) Non-occupant Loans on < 5 Family Dwellings (A B C & D)
Number
Average Value
Number
Average Value
Number
Average Value
Number
Average Value
Number
Average Value
LOANS ORIGINATED
43
$104,653
117
$108,085
246
$107,936
9
$48,768
33
$156,934
APPLICATIONS APPROVED, NOT ACCEPTED
2
$90,215
11
$74,334
27
$73,164
6
$39,142
3
$152,507
APPLICATIONS DENIED
2
$97,020
52
$63,435
90
$92,579
9
$39,300
3
$200,003
APPLICATIONS WITHDRAWN
4
$83,772
18
$117,146
57
$84,312
4
$26,135
2
$81,980
FILES CLOSED FOR INCOMPLETENESS
0
$0
4
$119,930
10
$106,541
1
$7,880
2
$99,165
Aggregated Statistics For Year 2000 (Based on 8 partial tracts)
A) FHA, FSA/RHS & VA Home Purchase Loans
B) Conventional Home Purchase Loans
C) Refinancings
D) Home Improvement Loans
F) Non-occupant Loans on < 5 Family Dwellings (A B C & D)
Number
Average Value
Number
Average Value
Number
Average Value
Number
Average Value
Number
Average Value
LOANS ORIGINATED
25
$106,884
159
$131,451
91
$99,477
6
$22,435
47
$219,705
APPLICATIONS APPROVED, NOT ACCEPTED
7
$51,757
44
$63,138
25
$93,682
6
$24,583
3
$160,623
APPLICATIONS DENIED
7
$72,419
90
$61,799
95
$68,110
18
$18,099
4
$59,608
APPLICATIONS WITHDRAWN
4
$64,798
19
$125,488
31
$79,499
3
$23,390
6
$168,618
FILES CLOSED FOR INCOMPLETENESS
0
$0
9
$184,251
8
$82,609
0
$0
1
$14,320
Aggregated Statistics For Year 1999 (Based on 4 partial tracts)
A) FHA, FSA/RHS & VA Home Purchase Loans
B) Conventional Home Purchase Loans
C) Refinancings
D) Home Improvement Loans
F) Non-occupant Loans on < 5 Family Dwellings (A B C & D)
Detailed PMIC statistics for the following Tracts:0202.00
2004 - 2018 National Fire Incident Reporting System (NFIRS) incidents
According to the data from the years 2004 - 2018 the average number of fires per year is 32. The highest number of fire incidents - 75 took place in 2011, and the least - 1 in 2006. The data has a growing trend.
When looking into fire subcategories, the most incidents belonged to: Structure Fires (46.0%), and Outside Fires (43.0%).
Fire incident types reported to NFIRS in Zip Code 28479
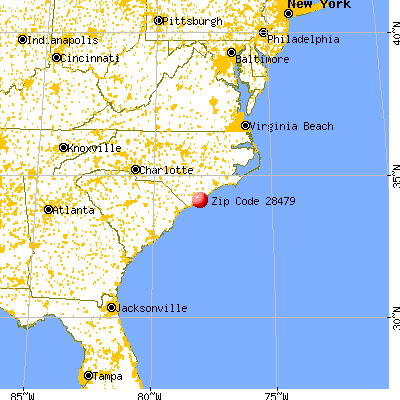


 Nearest zip codes: 28412, 28428, 28461, 28449, 28451, 28409.
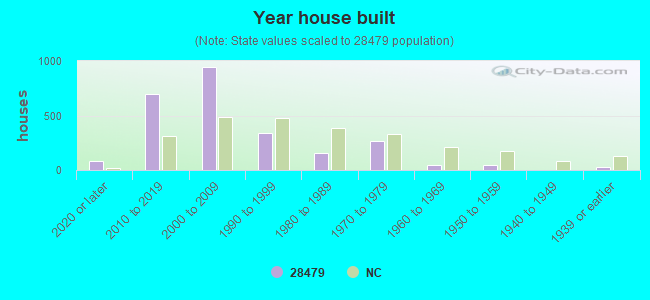


 (Location: 6330 LAKE PARK DR SE, Grades: PK-5)
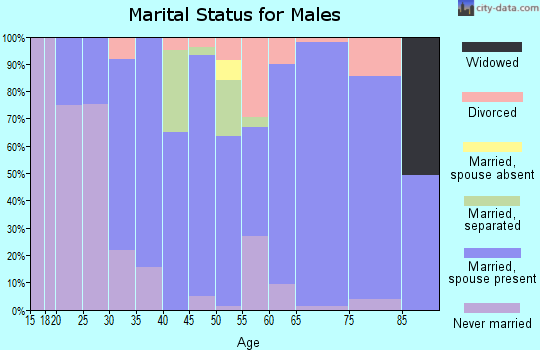
 According to the data from the years 2004 - 2018 the average number of fires per year is 32. The highest number of fire incidents - 75 took place in 2011, and the least - 1 in 2006. The data has a growing trend.
 When looking into fire subcategories, the most incidents belonged to: Structure Fires (46.0%), and Outside Fires (43.0%).