Estimated zip code population in 2022: 26,238 Zip code population in 2010: 19,140 Zip code population in 2000: 11,929
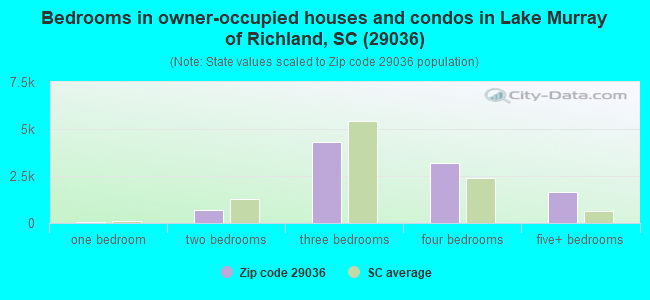
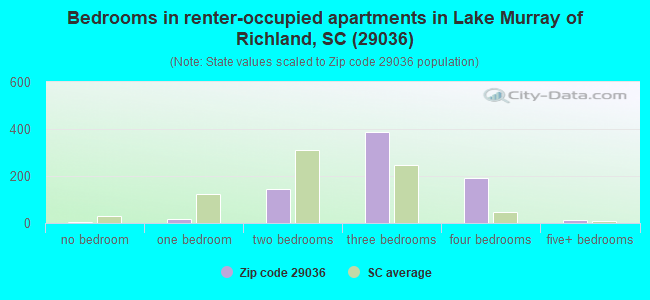
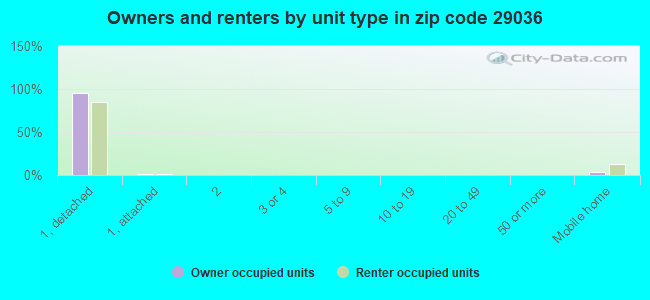
Houses and condos: 10,945 Renter-occupied apartments: 771
% of renters here:
7%
State:
28%
March 2022 cost of living index in zip code 29036: 89.6 (less than average, U.S. average is 100)
Land area: 54.0 sq. mi. Water area: 16.7 sq. mi.
Population density: 486 people per square mile
(low).
OSM Map
General Map
Google Map
MSN Map
OSM Map
General Map
Google Map
MSN Map
OSM Map
General Map
Google Map
MSN Map
OSM Map
General Map
Google Map
MSN Map
Please wait while loading the map...
Real estate property taxes paid for housing units in 2022:
This zip code:
0.5% ($2,014)
South Carolina:
0.5% ($1,185)
Median real estate property taxes paid for housing units with mortgages in 2022: $2,095 (0.5%) Median real estate property taxes paid for housing units with no mortgage in 2022: $1,877 (0.4%)
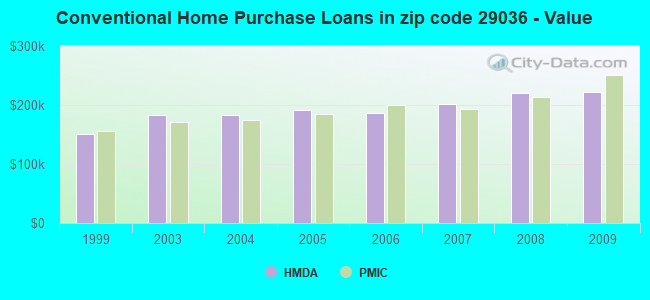
Estimated median house/condo value in 2022: $427,709
29036:
$427,709
South Carolina:
$254,600
According to our research of South Carolina and other state lists, there were 8 registered sex offenders living in 29036 zip code as of April 26, 2024. The ratio of all residents to sex offenders in zip code 29036 is 2,516 to 1. The ratio of registered sex offenders to all residents in this zip code is lower than the state average.
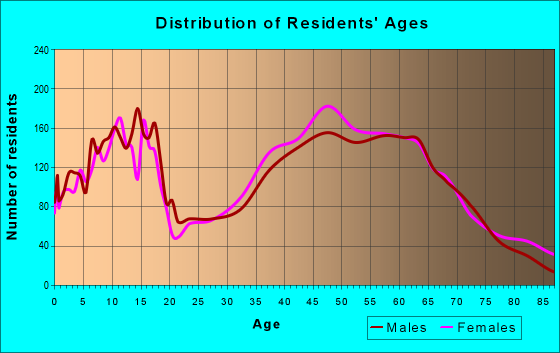
Median resident age:
This zip code:
46.2 years
South Carolina median age:
40.5 years
Average household size:
This zip code:
2.5 people
South Carolina:
2.4 people
Averages for the 2020 tax year for zip code 29036, filed in 2021:
Average Adjusted Gross Income (AGI) in 2020: $106,755 (Individual Income Tax Returns)
Here:
$106,755
State:
$65,754
Salary/wage: $84,736 (reported on 78.4% of returns)
Here:
$84,736
State:
$52,566
(% of AGI for various income ranges: 1144.3% for AGIs below $25k, 3568.5% for AGIs $25k-50k, 6140.9% for AGIs $50k-75k, 9409.1% for AGIs $75k-100k, 19167.1% for AGIs $100k-200k, 83892.7% for AGIs over 200k)
Taxable interest for individuals: $1,602 (reported on 39.2% of returns)
This zip code:
$1,602
South Carolina:
$1,749
(% of AGI for various income ranges: 26.8% for AGIs below $25k, 33.5% for AGIs $25k-50k, 49.6% for AGIs $50k-75k, 94.7% for AGIs $75k-100k, 155.9% for AGIs $100k-200k, 824.4% for AGIs over 200k)
Ordinary dividends: $7,829 (reported on 29.6% of returns)
Here:
$7,829
State:
$8,783
(% of AGI for various income ranges: 48.0% for AGIs below $25k, 73.5% for AGIs $25k-50k, 150.8% for AGIs $50k-75k, 246.4% for AGIs $75k-100k, 478.6% for AGIs $100k-200k, 4230.7% for AGIs over 200k)
Net capital gain/loss in AGI: +$17,790 (reported on 27.3% of returns)
Here:
+$17,790
State:
+$24,194
(% of AGI for various income ranges: 25.2% for AGIs below $25k, 61.9% for AGIs $25k-50k, 109.0% for AGIs $50k-75k, 168.5% for AGIs $75k-100k, 724.9% for AGIs $100k-200k, 12107.8% for AGIs over 200k)
Profit/loss from business: +$16,887 (reported on 18.2% of returns)
Here:
+$16,887
State:
+$11,253
(% of AGI for various income ranges: 94.4% for AGIs below $25k, 212.4% for AGIs $25k-50k, 263.6% for AGIs $50k-75k, 383.5% for AGIs $75k-100k, 753.2% for AGIs $100k-200k, 4186.8% for AGIs over 200k)
Taxable individual retirement arrangement distribution: $25,687 (reported on 14.8% of returns)
29036:
$25,687
South Carolina:
$21,604
(% of AGI for various income ranges: 77.1% for AGIs below $25k, 210.4% for AGIs $25k-50k, 443.7% for AGIs $50k-75k, 717.1% for AGIs $75k-100k, 1270.9% for AGIs $100k-200k, 3352.9% for AGIs over 200k)
Self-employed (Keogh) retirement plans: $18,886 (reported on 1.0% of returns)
29036:
$18,886
South Carolina:
$25,038
(% of AGI for various income ranges: 8.6% for AGIs below $25k, 39.9% for AGIs $100k-200k, 435.1% for AGIs over 200k)
Total itemized deductions: $36,446 (reported on 15.8% of returns)
Here:
$36,446
State:
$35,199
(% of AGI for various income ranges: 81.4% for AGIs below $25k, 204.1% for AGIs $25k-50k, 489.3% for AGIs $50k-75k, 593.2% for AGIs $75k-100k, 1482.0% for AGIs $100k-200k, 9091.7% for AGIs over 200k)
Charity contributions: $14,336 (reported on 13.4% of returns)
Here:
$14,336
State:
$14,319
(% of AGI for various income ranges: 6.2% for AGIs below $25k, 28.5% for AGIs $25k-50k, 81.5% for AGIs $50k-75k, 114.5% for AGIs $75k-100k, 407.0% for AGIs $100k-200k, 4100.2% for AGIs over 200k)
Taxes paid: $8,206 (reported on 15.8% of returns)
29036:
$8,206
State:
$7,486
(% of AGI for various income ranges: 10.8% for AGIs below $25k, 35.6% for AGIs $25k-50k, 98.6% for AGIs $50k-75k, 162.7% for AGIs $75k-100k, 419.8% for AGIs $100k-200k, 1743.2% for AGIs over 200k)
Earned income credit: $2,112 (reported on 7.8% of returns)
Here:
$2,112
State:
$2,397
(% of AGI for various income ranges: 56.1% for AGIs below $25k, 62.8% for AGIs $25k-50k, 1.4% for AGIs $50k-75k)
Percentage of individuals using paid preparers for their 2020 taxes: 93.3%
Here:
93%
State:
93%
(% for various income ranges: 91.5% for AGIs below $25k, 93.7% for AGIs $25k-50k, 93.3% for AGIs $50k-75k, 93.3% for AGIs $75k-100k, 93.8% for AGIs $100k-200k, 95.2% for AGIs over 200k)
Averages for the 2012 tax year for zip code 29036, filed in 2013:
Average Adjusted Gross Income (AGI) in 2012: $84,625 (Individual Income Tax Returns)
Here:
$84,625
State:
$51,133
Salary/wage: $70,976 (reported on 80.4% of returns)
Here:
$70,976
State:
$42,173
(% of AGI for various income ranges: 68.2% for AGIs below $25k, 68.9% for AGIs $25k-50k, 67.0% for AGIs $50k-75k, 65.8% for AGIs $75k-100k, 72.4% for AGIs $100k-200k, 62.0% for AGIs over 200k)
Taxable interest for individuals: $1,878 (reported on 45.9% of returns)
This zip code:
$1,878
South Carolina:
$1,468
(% of AGI for various income ranges: 1.7% for AGIs below $25k, 1.1% for AGIs $25k-50k, 1.2% for AGIs $50k-75k, 0.8% for AGIs $75k-100k, 0.6% for AGIs $100k-200k, 1.4% for AGIs over 200k)
Ordinary dividends: $5,768 (reported on 31.5% of returns)
Here:
$5,768
State:
$6,511
(% of AGI for various income ranges: 3.0% for AGIs below $25k, 1.5% for AGIs $25k-50k, 1.9% for AGIs $50k-75k, 2.0% for AGIs $75k-100k, 1.8% for AGIs $100k-200k, 2.8% for AGIs over 200k)
Net capital gain/loss in AGI: +$11,762 (reported on 24.5% of returns)
Here:
+$11,762
State:
+$13,061
(% of AGI for various income ranges: 0.3% for AGIs $25k-50k, 0.6% for AGIs $50k-75k, 0.5% for AGIs $75k-100k, 1.1% for AGIs $100k-200k, 9.4% for AGIs over 200k)
Profit/loss from business: +$14,183 (reported on 17.9% of returns)
Here:
+$14,183
State:
+$10,167
(% of AGI for various income ranges: 7.1% for AGIs below $25k, 4.3% for AGIs $25k-50k, 3.6% for AGIs $50k-75k, 2.7% for AGIs $75k-100k, 2.3% for AGIs $100k-200k, 2.9% for AGIs over 200k)
Taxable individual retirement arrangement distribution: $19,761 (reported on 15.2% of returns)
29036:
$19,761
South Carolina:
$17,019
(% of AGI for various income ranges: 4.7% for AGIs below $25k, 4.5% for AGIs $25k-50k, 3.9% for AGIs $50k-75k, 4.3% for AGIs $75k-100k, 4.2% for AGIs $100k-200k, 2.0% for AGIs over 200k)
Self-employment retirement plans: $14,875 (reported on 0.9% of returns)
29036:
$14,875
South Carolina:
$21,023
(% of AGI for various income ranges: 0.7% for AGIs below $25k, 0.1% for AGIs $100k-200k, 0.3% for AGIs over 200k)
Total itemized deductions: $26,675 (21% of AGI, reported on 53.4% of returns)
Here:
$26,675
State:
$22,890
Here:
20.7% of AGI
State:
21.4% of AGI
(% of AGI for various income ranges: 15.5% for AGIs below $25k, 15.9% for AGIs $25k-50k, 17.6% for AGIs $50k-75k, 17.9% for AGIs $75k-100k, 18.3% for AGIs $100k-200k, 14.9% for AGIs over 200k)
Charity contributions: $5,264 (reported on 46.8% of returns)
Here:
$5,264
State:
$5,169
(% of AGI for various income ranges: 1.5% for AGIs below $25k, 1.8% for AGIs $25k-50k, 2.5% for AGIs $50k-75k, 2.7% for AGIs $75k-100k, 3.0% for AGIs $100k-200k, 3.4% for AGIs over 200k)
Taxes paid: $9,864 (reported on 53.4% of returns)
29036:
$9,864
State:
$7,644
(% of AGI for various income ranges: 2.7% for AGIs below $25k, 3.6% for AGIs $25k-50k, 4.9% for AGIs $50k-75k, 5.7% for AGIs $75k-100k, 7.1% for AGIs $100k-200k, 7.0% for AGIs over 200k)
Earned income credit: $2,011 (reported on 8.7% of returns)
Here:
$2,011
State:
$2,418
(% of AGI for various income ranges: 4.0% for AGIs below $25k, 0.8% for AGIs $25k-50k)
Percentage of individuals using paid preparers for their 2012 taxes: 56.0%
Here:
56%
State:
57%
(% for various income ranges: 48.2% for AGIs below $25k, 54.3% for AGIs $25k-50k, 60.3% for AGIs $50k-75k, 59.1% for AGIs $75k-100k, 57.1% for AGIs $100k-200k, 74.2% for AGIs over 200k)
Averages for the 2004 tax year for zip code 29036, filed in 2005:
Average Adjusted Gross Income (AGI) in 2004: $77,376 (Individual Income Tax Returns)
Here:
$77,376
State:
$41,965
Salary/wage: $58,437 (reported on 81.7% of returns)
Here:
$58,437
State:
$35,695
(% of AGI for various income ranges: 262.1% for AGIs below $10k, 66.7% for AGIs $10k-25k, 70.8% for AGIs $25k-50k, 71.2% for AGIs $50k-75k, 73.6% for AGIs $75k-100k, 54.2% for AGIs over 100k)
Taxable interest for individuals: $1,667 (reported on 58.4% of returns)
This zip code:
$1,667
South Carolina:
$1,623
(% of AGI for various income ranges: 15.2% for AGIs below $10k, 3.6% for AGIs $10k-25k, 1.9% for AGIs $25k-50k, 1.3% for AGIs $50k-75k, 1.2% for AGIs $75k-100k, 1.0% for AGIs over 100k)
Taxable dividends: $4,639 (reported on 36.8% of returns)
Here:
$4,639
State:
$3,999
(% of AGI for various income ranges: 15.9% for AGIs below $10k, 2.8% for AGIs $10k-25k, 1.9% for AGIs $25k-50k, 1.6% for AGIs $50k-75k, 1.6% for AGIs $75k-100k, 2.4% for AGIs over 100k)
Net capital gain/loss: +$36,982 (reported on 29.4% of returns)
Here:
+$36,982
State:
+$13,100
(% of AGI for various income ranges: -7.7% for AGIs below $10k, 0.5% for AGIs $10k-25k, 0.7% for AGIs $25k-50k, 0.8% for AGIs $50k-75k, 2.2% for AGIs $75k-100k, 22.5% for AGIs over 100k)
Profit/loss from business: +$13,153 (reported on 18.8% of returns)
Here:
+$13,153
State:
+$9,144
(% of AGI for various income ranges: -13.9% for AGIs below $10k, 5.6% for AGIs $10k-25k, 3.7% for AGIs $25k-50k, 4.1% for AGIs $50k-75k, 2.9% for AGIs $75k-100k, 3.0% for AGIs over 100k)
IRA payment deduction: $3,405 (reported on 3.3% of returns)
29036:
$3,405
South Carolina:
$2,972
(% of AGI for various income ranges: 0.3% for AGIs $10k-25k, 0.3% for AGIs $25k-50k, 0.2% for AGIs $50k-75k, 0.2% for AGIs $75k-100k, 0.1% for AGIs over 100k)
Self-employed pension: $17,353 (reported on 1.4% of returns)
Here:
$17,353
South Carolina:
$15,117
Total itemized deductions: $24,654 (21% of AGI, reported on 55.5% of returns)
Here:
$24,654
State:
$19,039
Here:
20.5% of AGI
State:
22.8% of AGI
(% of AGI for various income ranges: 46.5% for AGIs below $10k, 17.2% for AGIs $10k-25k, 19.1% for AGIs $25k-50k, 20.0% for AGIs $50k-75k, 21.3% for AGIs $75k-100k, 16.0% for AGIs over 100k)
Charity contributions deductions: $5,453 (4% of AGI, reported on 50.7% of returns)
Here:
$5,453
State:
$4,305
Here:
4.4% of AGI
State:
5.0% of AGI
(% of AGI for various income ranges: 2.9% for AGIs below $10k, 1.5% for AGIs $10k-25k, 2.6% for AGIs $25k-50k, 2.8% for AGIs $50k-75k, 3.4% for AGIs $75k-100k, 4.1% for AGIs over 100k)
Total tax: $12,834 (reported on 81.8% of returns)
29036:
$12,834
State:
$6,497
(% of AGI for various income ranges: 9.7% for AGIs below $10k, 4.5% for AGIs $10k-25k, 6.8% for AGIs $25k-50k, 8.4% for AGIs $50k-75k, 9.6% for AGIs $75k-100k, 17.1% for AGIs over 100k)
Earned income credit: $1,660 (reported on 6.7% of returns)
Here:
$1,660
State:
$1,882
Percentage of individuals using paid preparers for their 2004 taxes: 59.1%
Here:
59%
State:
66%
(% for various income ranges: 49.5% for AGIs below $10k, 59.7% for AGIs $10k-25k, 58.2% for AGIs $25k-50k, 61.1% for AGIs $50k-75k, 60.4% for AGIs $75k-100k, 65.5% for AGIs over 100k)
Likely homosexual households (counted as self-reported same-sex unmarried-partner households)
Lesbian couples: 0.0% of all households
Gay men: 0.1% of all households
Household received Food Stamps/SNAP in the past 12 months: 330 Household did not receive Food Stamps/SNAP in the past 12 months: 10,066
Women who had a birth in the past 12 months: 194 (195 now married, 10 unmarried) Women who did not have a birth in the past 12 months: 5,168 (3,076 now married, 2,125 unmarried)
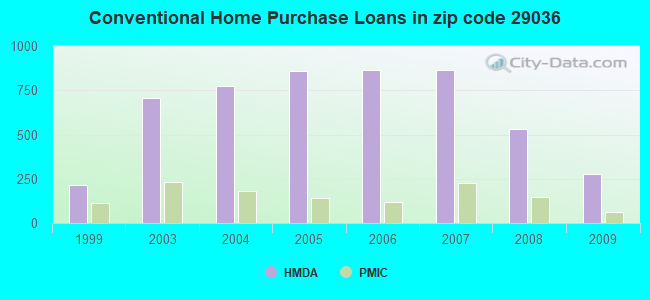
Housing units in zip code 29036 with a mortgage: 6,661 (965 second mortgage, 949 both second mortgage and home equity loan) Houses without a mortgage: 147
Median monthly owner costs for units with a mortgage: $1,861 Median monthly owner costs for units without a mortgage: $537
Residents with income below the poverty level in 2022:
This zip code:
3.7%
Whole state:
14.0%
Residents with income below 50% of the poverty level in 2022:
This zip code:
2.0%
Whole state:
7.3%
Median number of rooms in houses and condos:
Here:
7.2
State:
6.4
Median number of rooms in apartments:
Here:
6.1
State:
4.5
Notable locations in this zip code not listed on our city pages
Notable locations in zip code 29036: Lexington County Fire Service Amicks Ferry (A), Columbia - Richland Fire Department Dutch Fork Spring Hill (B), Lowman Home for the Aged (C), Lexington County Fire Service Chapin (D), Lexington County Fire Service Crossroads (E). Display/hide their locations on the map
Churches in zip code 29036 include: Saint Johns Church (A), Saint Peters Church (B), Stonewall Church (C), Bethel Church (D), Mount Olivet Church (E), Countsville Church (F), Mount Horeb Church (G), Mount Zion Church (H), Saint Thomas Lutheran Church (I). Display/hide their locations on the map
Cemeteries: Eargle Cemetery (1), Bethel Cemetery (2), Threewits Cemetery (3), Hiller Cemetery (4), Henry Eargle Cemetery (5), Bickley Cemetery (6), Hopewell Cemetery (7). Display/hide their locations on the map
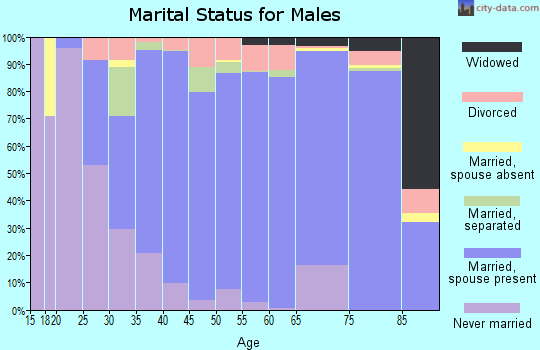
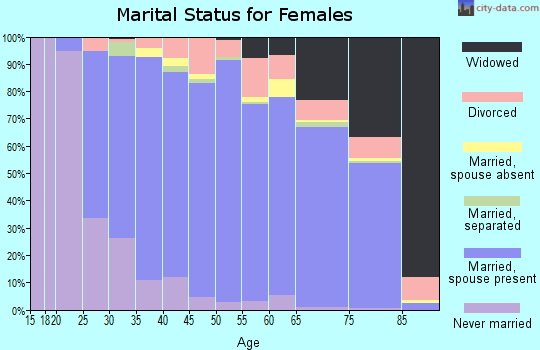
4,913 married couples with children.
895 single-parent households (210 men, 685 women).
94.0% of residents of 29036 zip code speak English at home.
1.9% of residents speak Spanish at home (73% very well, 27% well).
3.1% of residents speak other Indo-European language at home (82% very well, 10% well, 7% not well).
1.3% of residents speak Asian or Pacific Island language at home (70% very well, 19% well, 11% not well).
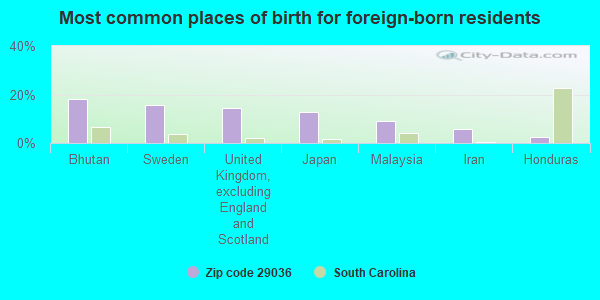
Foreign born population: 1,672 (6.4%) (66.8% of them are naturalized citizens)
This zip code:
6.4%
Whole state:
5.2%
18%Bhutan
16%Sweden
15%United Kingdom, excluding England and Scotland
13%Japan
9%Malaysia
6%Iran
3%Honduras
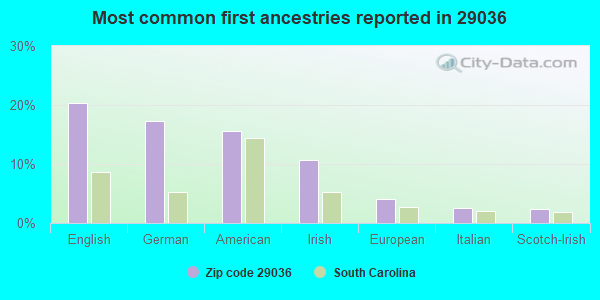
20%English
17%German
16%American
11%Irish
4%European
3%Italian
2%Scotch-Irish
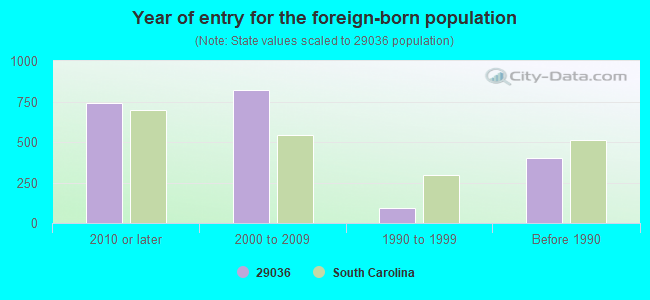
Year of entry for the foreign-born population
7382010 or later
8182000 to 2009
941990 to 1999
401Before 1990
Facilities with environmental interests located in this zip code:
FRED B JOHNSTON COMPANY INCORPORATED THE (300 EAST BOUNDARY STREET in CHAPIN, SC)
AIR SYNTHETIC MINOR (AIRS/AFS) Small Quantity Generators, between 100 kg and 1000 kg of hazardous waste/month (Resource Conservation and Recovery Act (tracking hazardous waste)) STATE MASTER (South Carolina database) - AIR PROGRAM, AIR MAJOR, DRINKING WATER PROGRAM STATE MASTER (South Carolina database) - HAZARDOUS WASTE PROGRAM Business SIC classification: COMMERCIAL PRINTING Business NAICS classification: COMMERCIAL SCREEN PRINTING.; PREPRESS SERVICES. Organizations: ENSR CONSULTING & ENGINEERING (CONTACT/ENGINEERING/CONSULTING FIRM)
, OPERNAME (CONTACT/OPERATOR)
, THE FRED B JOHNSTON CO INC (CONTACT/OPERATOR)
, FRED B JOHNSTON II (CONTACT/OWNER)
Alternative names: F B JOHNSON GROUP SC DIVISION, WEISZ GRAPHICS
CHAPIN ELEMENTARY SCHOOL (940 OLD BUSH RIVER RD in CHAPIN, SC)
(Geographic Names Information System) (National Center for Education Statistics) - STATE ID-3205041 STATE MASTER (South Carolina database) - UNDERGROUND STORAGE TANK PROGRAM, National Pollutant Discharge Elimination System Permit, DRINKING WATER PROGRAM Organizations: LEXINGTON COUNTY SCHOOL DISTRICT 05 (SCHOOL DISTRICT)
CHAPIN CLEANERS (LEXINGTON AVE in CHAPIN, SC)
Conditionally Exempt Small Quantity Generators, less than 100 kg/month of hazardous waste (Resource Conservation and Recovery Act (tracking hazardous waste)) - notification STATE MASTER (South Carolina database) - HAZARDOUS WASTE PROGRAM Organizations: OPERNAME (CONTACT/OPERATOR)
, PRICE LORETTA (CONTACT/OWNER)
CHAPIN HIGH SCHOOL (300 COLUMBIA AVENUE in CHAPIN, SC)
(National Center for Education Statistics) - STATE ID-3205038 Organizations: LEXINGTON COUNTY SCHOOL DISTRICT 05 (SCHOOL DISTRICT)
CHAPIN MIDDLE SCHOOL (1130 OLD LEXINGTON HWY. in CHAPIN, SC)
(National Center for Education Statistics) - STATE ID-3205050 Organizations: LEXINGTON COUNTY SCHOOL DISTRICT 05 (SCHOOL DISTRICT)
DURASTONE-CHAPIN (250 EAST BOUNDARY STREET in CHAPIN, SC)
AIR MINOR (AIRS/AFS) Business SIC classification: SERVICES
CHAPIN SEWAGE SYSTEM (INTERSTATE 26 & WATEREE CREEK in CHAPIN, SC)
National Pollutant Discharge Elimination System MAJOR (Tracking pollutant discharge elimination systems) - permit Business SIC classification: SEWERAGE SYSTEMS Organizations: CHAPIN, TOWN OF (CONTACT/OWNER)
Alternative names: CHAPIN, TOWN OF
Housing units lacking complete kitchen facilities: 0.2%
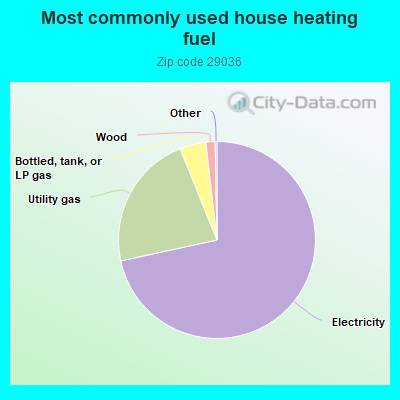
71.6%Electricity
22.3%Utility gas
4.3%Bottled, tank, or LP gas
1.5%Wood
Population in 1990: 8,744. Population change in the 1990s: +3,185 (+36.4%).
Place of birth for U.S.-born residents:
This state: 11,829
Northeast: 2,540
Midwest: 3,002
South: 5,956
West: 1,031
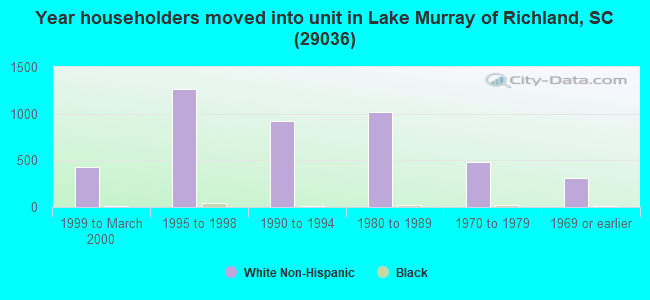
62% of the 29036 zip code residents lived in the same house 5 years ago. Out of people who lived in different houses, 35% lived in this county. Out of people who lived in different counties, 50% lived in South Carolina.
90% of the 29036 zip code residents lived in the same house 1 year ago. Out of people who lived in different houses, 36% moved from this county. Out of people who lived in different houses, 26% moved from different county within same state. Out of people who lived in different houses, 37% moved from different state. Out of people who lived in different houses, 2% moved from abroad.
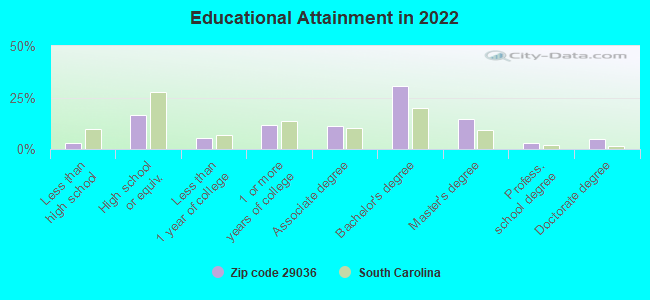
Private vs. public school enrollment:
Students in private schools in grades 1 to 8 (elementary and middle school): 373
Here:
14.1%
South Carolina:
14.4%
Students in private schools in grades 9 to 12 (high school): 119
Here:
6.8%
South Carolina:
11.1%
Students in private undergraduate colleges: 112
Here:
17.0%
South Carolina:
21.9%
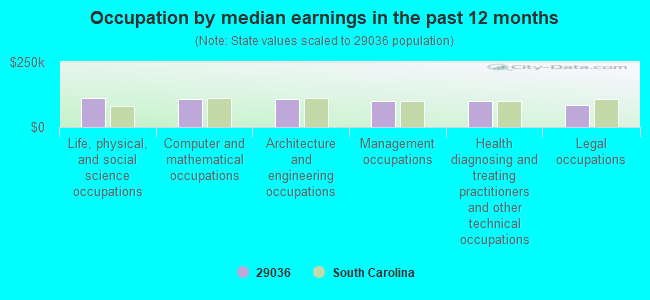
Occupation by median earnings in the past 12 months ($)
111,677Life, physical, and social science occupations
109,512Computer and mathematical occupations
108,655Architecture and engineering occupations
101,720Management occupations
99,206Health diagnosing and treating practitioners and other technical occupations
83,976Legal occupations
Companies with federal contracts located in this zip code (CHAPIN, SC):
CAPITOL PRINTER REPAIR, INC (201 OLD CEDAR PT; small business) : $35,000 in 3 contractsfrom 2004 to 2005
$15,000 with Army for Maintenance, Repair and Rebuilding of Equipment -- Special Industry Machinery. Signed on 2005-01-11. Completion date: 2005-09-30.
$15,000, same as above.Signed on 2004-10-16. Completion date: 2005-09-30.
$5,000, same as above.Signed on 2005-08-01. Completion date: 2005-09-30.
DATA NETWORK SOLUTIONS (629 LAKE TIDE DR; small business) : $23,880 in 5 contractsfrom 2002 to 2005
Contracts for Installation of Equipment -- Cleaning Equipment and Supplies, ADP Software, Maintenance, Repair and Rebuilding of Equipment -- Automatic Data Processing Equipment (Including Firmware), Software, Supplies and Support Equipment by Army Signed by year:2000: $0; 2001: $0; 2002: $12,000; 2003: $0; 2004: $10,755; 2005: $1,125; 2006: $0.
Biggest contracts:
$12,000 with Army for Installation of Equipment -- Cleaning Equipment and Supplies. Signed on 2002-04-17. Completion date: 2002-05-10.
$5,574 with Army for ADP Software. Signed on 2004-12-29. Completion date: 2005-01-12.
$5,181, same as above.Signed on 2004-09-17. Completion date: 2004-09-30.
$1,125 with Army for Maintenance, Repair and Rebuilding of Equipment -- Automatic Data Processing Equipment (Including Firmware), Software, Supplies and Support Equipment. Signed on 2005-12-14. Completion date: 2006-09-30.
HEALTHCARE SOLUTIONS INC (236 EDGEWOOD DRIVE; small business) : $16,750 in 3 contractsfrom 2001 to 2004
$33,600 with Army for Program Management/Support Services. Signed on 2001-03-09. Completion date: 2001-01-24.
$0, same as above.Signed on 2001-03-09. Completion date: 2001-01-24.
-$16,850, same as above.Signed on 2004-07-10. Completion date: 2001-01-24.
KATHERINA LYDEN (134 LAKE VISTA DR; small business) : $16,310 in 4 contractsfrom 2003 to 2004
$8,250 with Army for Other Social Services. Signed on 2003-02-21. Completion date: 2003-09-30.
$6,887 with Army for Chaplain Services. Signed on 2003-10-16. Completion date: 2004-09-30.
$4,160, same as above.Signed on 2004-10-22. Completion date: 2005-09-30.
-$2,987, same as above.Signed on 2003-12-02. Completion date: 2004-09-30.
LANFORD, CHARLENE M (1026 DREHER ISLAND RD; small business) : $3,750 in 2 contractsfrom 2003 to 2004
$3,900 with Army for Chaplain Services. Signed on 2003-11-07. Completion date: 2004-09-30.
-$150, same as above.Signed on 2004-09-10. Completion date: 2004-09-30.
Top industries in this zip code by the number of employees in 2005:
2002 - 2018 National Fire Incident Reporting System (NFIRS) incidents
According to the data from the years 2002 - 2018 the average number of fire incidents per year is 67. The highest number of fires - 102 took place in 2010, and the least - 8 in 2009. The data has a rising trend.
When looking into fire subcategories, the most reports belonged to: Outside Fires (55.4%), and Structure Fires (28.4%).
Fire incident types reported to NFIRS in Zip Code 29036
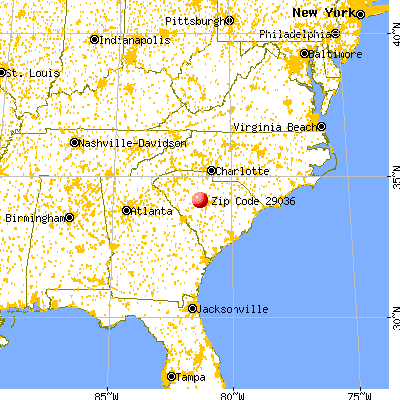


 Nearest zip codes: 29075, 29122, 29063, 29072, 29212, 29065.


 According to the data from the years 2002 - 2018 the average number of fire incidents per year is 67. The highest number of fires - 102 took place in 2010, and the least - 8 in 2009. The data has a rising trend.
 When looking into fire subcategories, the most reports belonged to: Outside Fires (55.4%), and Structure Fires (28.4%).