Estimated zip code population in 2022: 2,325 Zip code population in 2010: 2,448 Zip code population in 2000: 2,851
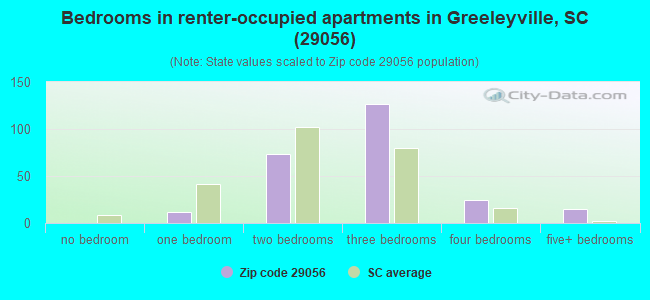
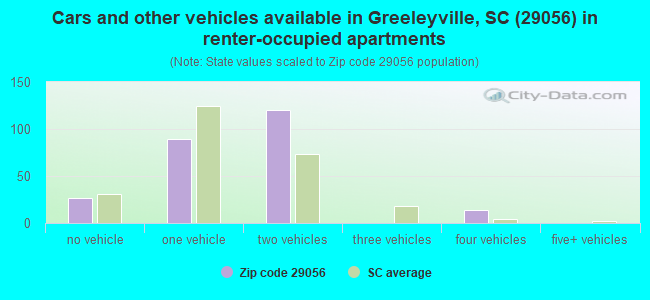
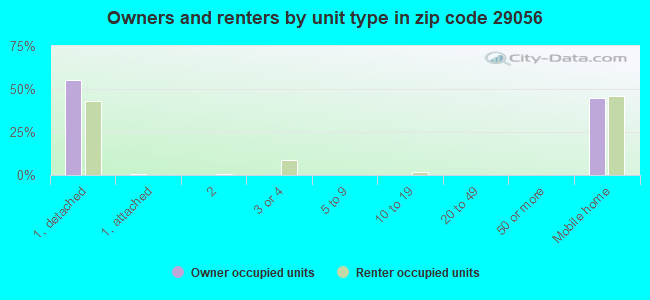
Houses and condos: 1,091 Renter-occupied apartments: 252
% of renters here:
27%
State:
28%
March 2022 cost of living index in zip code 29056: 78.0 (low, U.S. average is 100)
Land area: 104.2 sq. mi. Water area: 0.5 sq. mi.
Population density: 22 people per square mile
(very low).
OSM Map
General Map
Google Map
MSN Map
OSM Map
General Map
Google Map
MSN Map
OSM Map
General Map
Google Map
MSN Map
OSM Map
General Map
Google Map
MSN Map
Please wait while loading the map...
Real estate property taxes paid for housing units in 2022:
This zip code:
0.9% ($566)
South Carolina:
0.5% ($1,185)
Median real estate property taxes paid for housing units with mortgages in 2022: $1,141 (0.9%) Median real estate property taxes paid for housing units with no mortgage in 2022: $515 (0.9%)
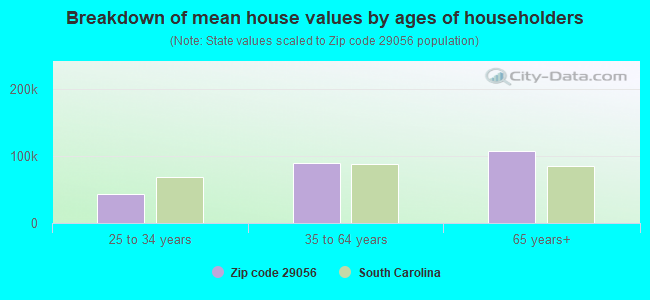
Estimated median house/condo value in 2022: $61,589
29056:
$61,589
South Carolina:
$254,600
According to our research of South Carolina and other state lists, there was 1 registered sex offender living in 29056 zip code as of April 26, 2024. The ratio of all residents to sex offenders in zip code 29056 is 2,250 to 1. The ratio of registered sex offenders to all residents in this zip code is lower than the state average.
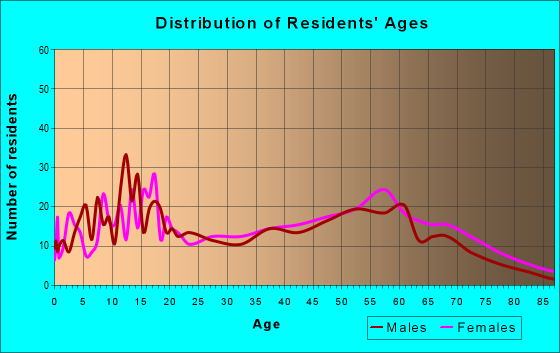
Median resident age:
This zip code:
45.3 years
South Carolina median age:
40.5 years
Average household size:
This zip code:
2.4 people
South Carolina:
2.4 people
Averages for the 2020 tax year for zip code 29056, filed in 2021:
Average Adjusted Gross Income (AGI) in 2020: $38,635 (Individual Income Tax Returns)
Here:
$38,635
State:
$65,754
Salary/wage: $33,092 (reported on 82.5% of returns)
Here:
$33,092
State:
$52,566
(% of AGI for various income ranges: 1507.3% for AGIs below $25k, 4161.1% for AGIs $25k-50k, 7477.1% for AGIs $50k-75k, 11050.0% for AGIs $75k-100k, 27305.0% for AGIs $100k-200k)
Taxable interest for individuals: $677 (reported on 13.4% of returns)
This zip code:
$677
South Carolina:
$1,749
(% of AGI for various income ranges: 2.1% for AGIs below $25k, 2.2% for AGIs $25k-50k, 67.1% for AGIs $50k-75k, 150.0% for AGIs $100k-200k)
Ordinary dividends: $850 (reported on 4.1% of returns)
Here:
$850
State:
$8,783
(% of AGI for various income ranges: 48.6% for AGIs $50k-75k)
Net capital gain/loss in AGI: +$3,575 (reported on 4.1% of returns)
Here:
+$3,575
State:
+$24,194
(% of AGI for various income ranges: 204.3% for AGIs $50k-75k)
Profit/loss from business: +$1,733 (reported on 15.5% of returns)
Here:
+$1,733
State:
+$11,253
(% of AGI for various income ranges: 35.2% for AGIs below $25k, 17.1% for AGIs $50k-75k, 760.0% for AGIs $75k-100k)
Taxable individual retirement arrangement distribution: $12,675 (reported on 4.1% of returns)
29056:
$12,675
South Carolina:
$21,604
(% of AGI for various income ranges: 61.8% for AGIs below $25k, 432.9% for AGIs $50k-75k)
Total itemized deductions: $33,075 (reported on 4.1% of returns)
Here:
$33,075
State:
$35,199
(% of AGI for various income ranges: 4410.0% for AGIs $75k-100k)
Charity contributions: $12,033 (reported on 3.1% of returns)
Here:
$12,033
State:
$14,319
(% of AGI for various income ranges: 1203.3% for AGIs $75k-100k)
Taxes paid: $6,125 (reported on 4.1% of returns)
29056:
$6,125
State:
$7,486
(% of AGI for various income ranges: 816.7% for AGIs $75k-100k)
Earned income credit: $2,596 (reported on 28.9% of returns)
Here:
$2,596
State:
$2,397
(% of AGI for various income ranges: 153.3% for AGIs below $25k, 122.8% for AGIs $25k-50k)
Percentage of individuals using paid preparers for their 2020 taxes: 89.7%
Here:
90%
State:
93%
(% for various income ranges: 91.5% for AGIs below $25k, 88.9% for AGIs $25k-50k, 83.3% for AGIs $50k-75k, 83.3% for AGIs $75k-100k, 100.0% for AGIs $100k-200k)
Averages for the 2012 tax year for zip code 29056, filed in 2013:
Average Adjusted Gross Income (AGI) in 2012: $30,023 (Individual Income Tax Returns)
Here:
$30,023
State:
$51,133
Salary/wage: $26,155 (reported on 84.7% of returns)
Here:
$26,155
State:
$42,173
(% of AGI for various income ranges: 80.2% for AGIs below $25k, 85.4% for AGIs $25k-50k, 73.6% for AGIs $50k-75k, 79.0% for AGIs $75k-100k, 45.7% for AGIs $100k-200k)
Taxable interest for individuals: $586 (reported on 14.3% of returns)
This zip code:
$586
South Carolina:
$1,468
(% of AGI for various income ranges: 0.4% for AGIs below $25k, 0.2% for AGIs $25k-50k, 0.2% for AGIs $50k-75k, 0.9% for AGIs $75k-100k)
Ordinary dividends: $800 (reported on 4.1% of returns)
Here:
$800
State:
$6,511
Net capital gain/loss in AGI: +$600 (reported on 4.1% of returns)
Here:
+$600
State:
+$13,061
Profit/loss from business: +$5,414 (reported on 14.3% of returns)
Here:
+$5,414
State:
+$10,167
(% of AGI for various income ranges: 5.4% for AGIs below $25k, 0.8% for AGIs $25k-50k, 9.4% for AGIs $75k-100k)
Taxable individual retirement arrangement distribution: $9,760 (reported on 5.1% of returns)
29056:
$9,760
South Carolina:
$17,019
Total itemized deductions: $19,233 (29% of AGI, reported on 18.4% of returns)
Here:
$19,233
State:
$22,890
Here:
28.7% of AGI
State:
21.4% of AGI
(% of AGI for various income ranges: 5.1% for AGIs below $25k, 10.2% for AGIs $25k-50k, 26.0% for AGIs $50k-75k, 19.1% for AGIs $100k-200k)
Charity contributions: $5,394 (reported on 16.3% of returns)
Here:
$5,394
State:
$5,169
(% of AGI for various income ranges: 1.0% for AGIs below $25k, 2.3% for AGIs $25k-50k, 6.5% for AGIs $50k-75k, 5.4% for AGIs $100k-200k)
Taxes paid: $4,722 (reported on 18.4% of returns)
29056:
$4,722
State:
$7,644
(% of AGI for various income ranges: 0.7% for AGIs below $25k, 1.9% for AGIs $25k-50k, 6.3% for AGIs $50k-75k, 6.4% for AGIs $100k-200k)
Earned income credit: $2,615 (reported on 41.8% of returns)
Here:
$2,615
State:
$2,418
(% of AGI for various income ranges: 11.7% for AGIs below $25k, 1.6% for AGIs $25k-50k)
Percentage of individuals using paid preparers for their 2012 taxes: 75.5%
Here:
76%
State:
57%
(% for various income ranges: 76.7% for AGIs below $25k, 76.0% for AGIs $25k-50k, 71.4% for AGIs $50k-75k, 66.7% for AGIs $75k-100k, 66.7% for AGIs $100k-200k)
Averages for the 2004 tax year for zip code 29056, filed in 2005:
Average Adjusted Gross Income (AGI) in 2004: $23,816 (Individual Income Tax Returns)
Here:
$23,816
State:
$41,965
Salary/wage: $22,495 (reported on 87.4% of returns)
Here:
$22,495
State:
$35,695
(% of AGI for various income ranges: 121.2% for AGIs below $10k, 89.3% for AGIs $10k-25k, 85.1% for AGIs $25k-50k, 75.1% for AGIs $50k-75k, 87.5% for AGIs $75k-100k, 50.4% for AGIs over 100k)
Taxable interest for individuals: $647 (reported on 16.0% of returns)
This zip code:
$647
South Carolina:
$1,623
(% of AGI for various income ranges: 2.7% for AGIs below $10k, 0.3% for AGIs $10k-25k, 0.3% for AGIs $25k-50k, 0.4% for AGIs $50k-75k, 0.2% for AGIs $75k-100k, 0.8% for AGIs over 100k)
Taxable dividends: $413 (reported on 4.4% of returns)
Here:
$413
State:
$3,999
(% of AGI for various income ranges: 0.5% for AGIs below $10k, 0.1% for AGIs $10k-25k, 0.0% for AGIs $25k-50k, 0.2% for AGIs $50k-75k)
Net capital gain/loss: +$1,149 (reported on 4.5% of returns)
Here:
+$1,149
State:
+$13,100
Profit/loss from business: +$3,385 (reported on 12.9% of returns)
Here:
+$3,385
State:
+$9,144
(% of AGI for various income ranges: 7.7% for AGIs below $10k, 1.8% for AGIs $10k-25k, 2.8% for AGIs $25k-50k, 0.8% for AGIs $50k-75k)
Total itemized deductions: $16,383 (28% of AGI, reported on 14.8% of returns)
Here:
$16,383
State:
$19,039
Here:
28.3% of AGI
State:
22.8% of AGI
(% of AGI for various income ranges: 4.6% for AGIs $10k-25k, 10.9% for AGIs $25k-50k, 14.2% for AGIs $50k-75k, 16.8% for AGIs $75k-100k, 15.9% for AGIs over 100k)
Charity contributions deductions: $4,428 (8% of AGI, reported on 13.2% of returns)
Here:
$4,428
State:
$4,305
Here:
7.6% of AGI
State:
5.0% of AGI
(% of AGI for various income ranges: 1.1% for AGIs $10k-25k, 2.5% for AGIs $25k-50k, 3.5% for AGIs $50k-75k, 3.6% for AGIs $75k-100k, 4.6% for AGIs over 100k)
Total tax: $2,933 (reported on 54.6% of returns)
29056:
$2,933
State:
$6,497
(% of AGI for various income ranges: 3.1% for AGIs below $10k, 2.3% for AGIs $10k-25k, 5.8% for AGIs $25k-50k, 8.3% for AGIs $50k-75k, 9.7% for AGIs $75k-100k, 17.9% for AGIs over 100k)
Earned income credit: $2,058 (reported on 41.6% of returns)
Here:
$2,058
State:
$1,882
Percentage of individuals using paid preparers for their 2004 taxes: 77.8%
Here:
78%
State:
66%
(% for various income ranges: 71.9% for AGIs below $10k, 82.2% for AGIs $10k-25k, 75.3% for AGIs $25k-50k, 78.8% for AGIs $50k-75k, 82.6% for AGIs $75k-100k, 85.7% for AGIs over 100k)
Household received Food Stamps/SNAP in the past 12 months: 290 Household did not receive Food Stamps/SNAP in the past 12 months: 666
Women who had a birth in the past 12 months: 5 (2 now married, 2 unmarried) Women who did not have a birth in the past 12 months: 504 (176 now married, 326 unmarried)
Housing units in zip code 29056 with a mortgage: 139 Median monthly owner costs for units with a mortgage: $1,001 Median monthly owner costs for units without a mortgage: $333
Residents with income below the poverty level in 2022:
This zip code:
22.0%
Whole state:
14.0%
Residents with income below 50% of the poverty level in 2022:
This zip code:
10.4%
Whole state:
7.3%
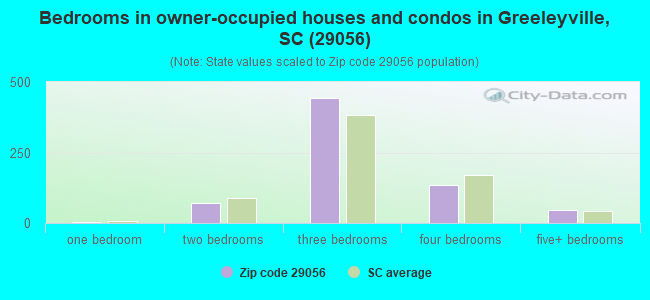
Median number of rooms in houses and condos:
Here:
6.0
State:
6.4
Median number of rooms in apartments:
Here:
6.2
State:
4.5
Notable locations in this zip code not listed on our city pages
Notable locations in zip code 29056: Camp Harmony (A), Swamp Fox Golf Club (B), Kingstree Golf Course (C), Lane Town Hall (D), Williamsburg County Fire Department Mount Vernon (E), Williamsburg County Fire Department Greeleyville (F), Greeleyville Police Department (G). Display/hide their locations on the map
Churches in zip code 29056 include: Richmond Church (A), Saint Agey Church (B), Saint Johns Church (C), Saint Lukes Church (D), Pine Grove Church (E), Saint James Church (F), Mount Zion Church (G), Mount Vernon Church (H), Black River Church (I). Display/hide their locations on the map
Lakes, reservoirs, and swamps: Broad Lake (A), Duke Lake (B), Doctor Hole (C), Little Lake (D), Franks Lake (E), Martins Lake (F), Conyer Lake (G), Longlands Hope Swamp Pond (H). Display/hide their locations on the map
Streams, rivers, and creeks: Clapp Swamp (A), Mount Hope Swamp (B), Walnut Branch (C), Pocotaligo River (D), Pudding Swamp (E), Mill Branch (F), Long Branch (G), Torkiln Branch (H), Highland Creek (I). Display/hide their locations on the map
In group quarters: 17 (-1 institutionalized population)
Size of family households: 354 2-persons, 95 3-persons, 97 4-persons, 46 5-persons, 27 6-persons, 10 7-or-more-persons
Size of nonfamily households: 318 1-person, 3 2-persons
215 married couples with children.
75 single-parent households (24 men, 51 women).
98.1% of residents of 29056 zip code speak English at home.
2.0% of residents speak Spanish at home (57% very well, 11% well, 33% not well).
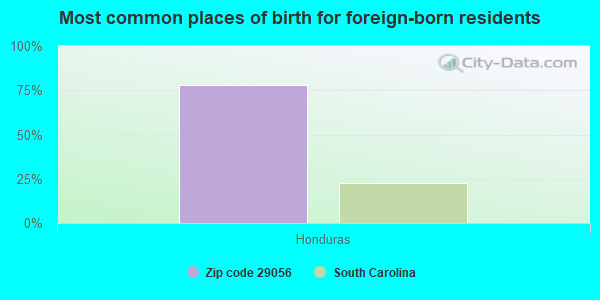
Foreign born population: 19 (0.8%) (90.3% of them are naturalized citizens)
This zip code:
0.8%
Whole state:
5.2%
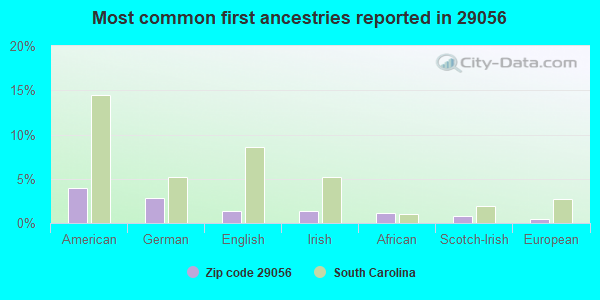
78%Honduras
4%American
3%German
1%English
1%Irish
1%African
1%Scotch-Irish
1%European
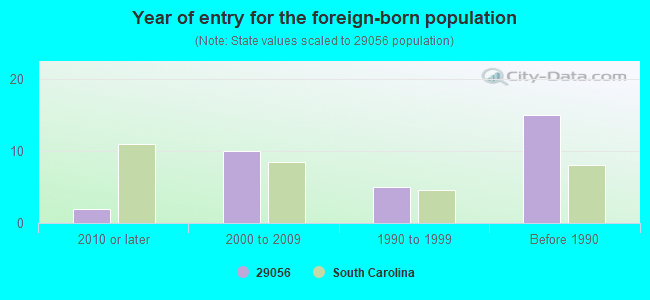
Year of entry for the foreign-born population
22010 or later
102000 to 2009
51990 to 1999
15Before 1990
Facilities with environmental interests located in this zip code:
C E MURRAY HIGH SCHOOL (222 CE MURRAY BLVD. in GREELEYVILLE, SC)
(Geographic Names Information System) (National Center for Education Statistics) - STATE ID-4501012 Organizations: WILLIAMSBURG COUNTY SCHOOL DISTRICT (SCHOOL DISTRICT)
Housing units lacking complete plumbing facilities: 2.6% Housing units lacking complete kitchen facilities: 2.5%
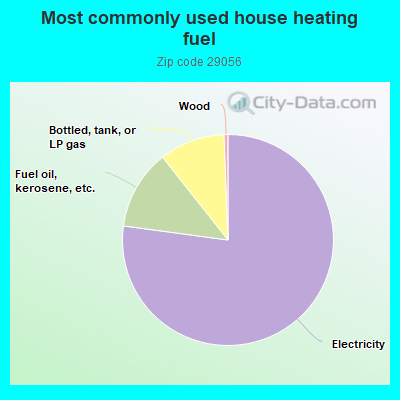
76.9%Electricity
12.2%Fuel oil, kerosene, etc.
10.0%Bottled, tank, or LP gas
0.6%Wood
Population in 1990: 2,773. Population change in the 1990s: +78 (+2.8%).
Place of birth for U.S.-born residents:
This state: 1,888
Northeast: 256
South: 94
West: 13
76% of the 29056 zip code residents lived in the same house 5 years ago. Out of people who lived in different houses, 56% lived in this county. Out of people who lived in different counties, 50% lived in South Carolina.
99% of the 29056 zip code residents lived in the same house 1 year ago. Out of people who lived in different houses, 64% moved from this county. Out of people who lived in different houses, 16% moved from different county within same state. Out of people who lived in different houses, 4% moved from abroad.
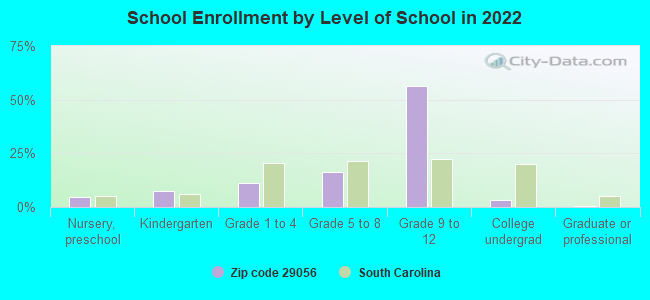
Private vs. public school enrollment:
Students in private schools in grades 1 to 8 (elementary and middle school): 20
Here:
14.9%
South Carolina:
14.4%
Students in private schools in grades 9 to 12 (high school): 7
Here:
2.8%
South Carolina:
11.1%
Students in private undergraduate colleges:
Here:
0.0%
South Carolina:
21.9%
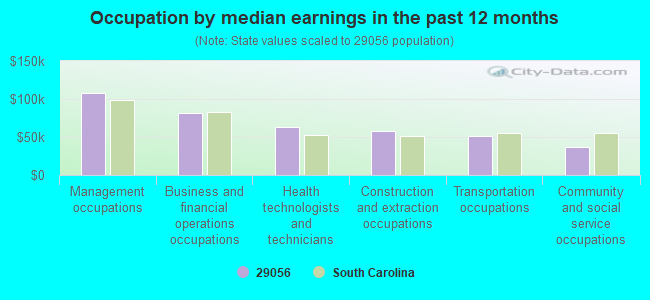
Occupation by median earnings in the past 12 months ($)
107,994Management occupations
81,331Business and financial operations occupations
62,868Health technologists and technicians
57,352Construction and extraction occupations
51,346Transportation occupations
36,592Community and social service occupations
Top industries in this zip code by the number of employees in 2005:
Health Care and Social Assistance: Residential Mental Health and Substance Abuse Facilities (100-249 employees: 1 establishment)
Construction: Poured Concrete Foundation and Structure Contractors (10-19: 1, 1-4: 1)
Finance and Insurance: Commercial Banking (10-19: 1)
Other Services (except Public Administration): Religious Organizations (5-9: 1, 1-4: 1)
Arts, Entertainment, and Recreation: Golf Courses and Country Clubs (5-9: 1)
People in group quarters in 2010:
27 people in residential treatment centers for juveniles (non-correctional)
People in group quarters in 2000:
16 people in other noninstitutional group quarters
Fatal accident statistics in 2014:
Fatal accident count: 1
Vehicles involved in fatal accidents: 2
Fatal accidents caused by drunken drivers: 0
Fatalities: 1
Persons involved in fatal accidents: 3
Pedestrians involved in fatal accidents: 0
Fatal accident statistics in 2013:
Fatal accident count: 1
Vehicles involved in fatal accidents: 1
Fatal accidents caused by drunken drivers: 0
Fatalities: 1
Persons involved in fatal accidents: 1
Pedestrians involved in fatal accidents: 0
2004 - 2018 National Fire Incident Reporting System (NFIRS) incidents
Based on the data from the years 2004 - 2018 the average number of fires per year is 22. The highest number of fire incidents - 65 took place in 2011, and the least - 0 in 2005. The data has a rising trend.
When looking into fire subcategories, the most reports belonged to: Outside Fires (56.4%), and Mobile Property/Vehicle Fires (20.4%).
Fire incident types reported to NFIRS in Zip Code 29056
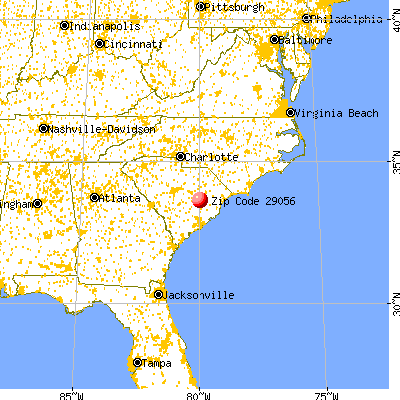


 Nearest zip codes: 29590, 29111, 29102, 29468, 29564, 29518.
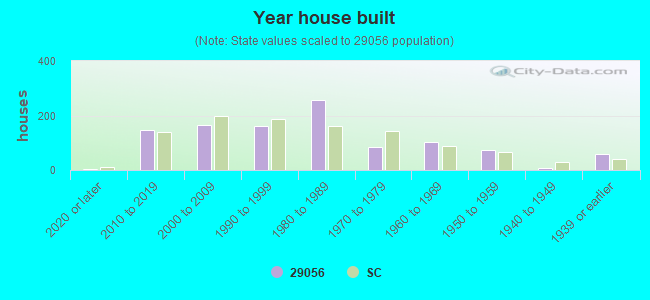


 Based on the data from the years 2004 - 2018 the average number of fires per year is 22. The highest number of fire incidents - 65 took place in 2011, and the least - 0 in 2005. The data has a rising trend.
 When looking into fire subcategories, the most reports belonged to: Outside Fires (56.4%), and Mobile Property/Vehicle Fires (20.4%).