Estimated zip code population in 2022: 8,403 Zip code population in 2010: 8,401 Zip code population in 2000: 7,973
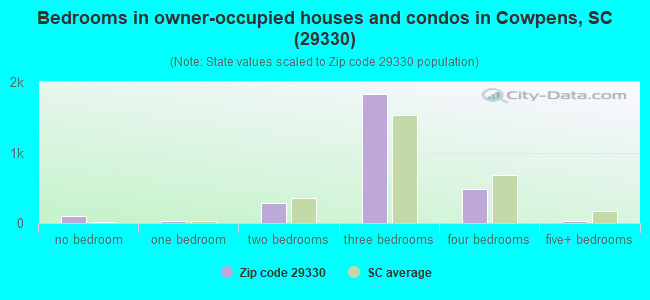
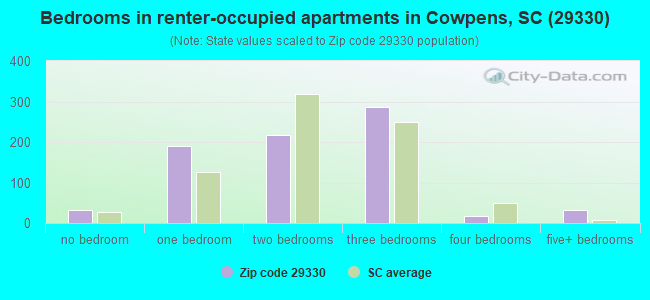
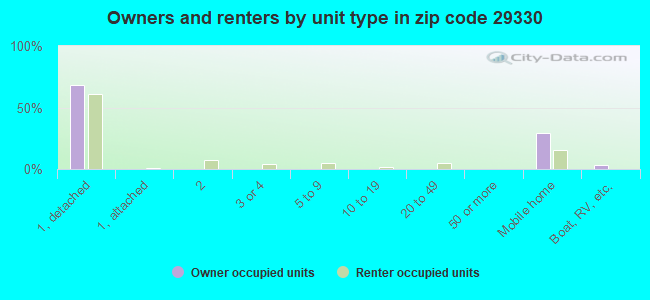
Houses and condos: 3,771 Renter-occupied apartments: 777
% of renters here:
22%
State:
28%
March 2022 cost of living index in zip code 29330: 80.4 (low, U.S. average is 100)
Land area: 36.2 sq. mi. Water area: 0.3 sq. mi.
Population density: 232 people per square mile
(very low).
OSM Map
General Map
Google Map
MSN Map
OSM Map
General Map
Google Map
MSN Map
OSM Map
General Map
Google Map
MSN Map
OSM Map
General Map
Google Map
MSN Map
Please wait while loading the map...
Real estate property taxes paid for housing units in 2022:
This zip code:
0.4% ($727)
South Carolina:
0.5% ($1,185)
Median real estate property taxes paid for housing units with mortgages in 2022: $858 (0.4%) Median real estate property taxes paid for housing units with no mortgage in 2022: $566 (0.5%)
Business Search- 14 Million verified businesses
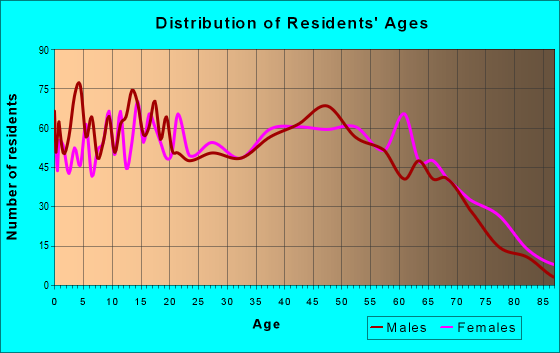
Males: 4,207
(50.1%)
Females: 4,195
(49.9%)
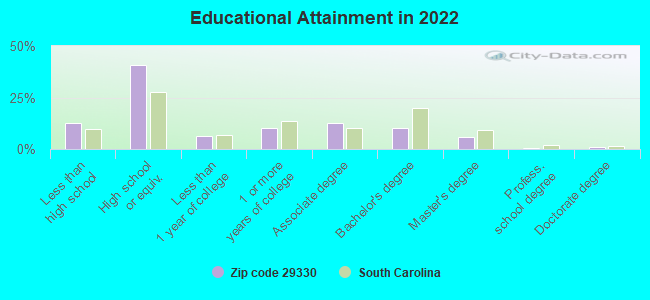
For population 25 years and over in 29330:
High school or higher: 85.2%
Bachelor's degree or higher: 17.4%
Graduate or professional degree: 7.4%
Unemployed: 1.9%
Mean travel time to work (commute): 21.8 minutes
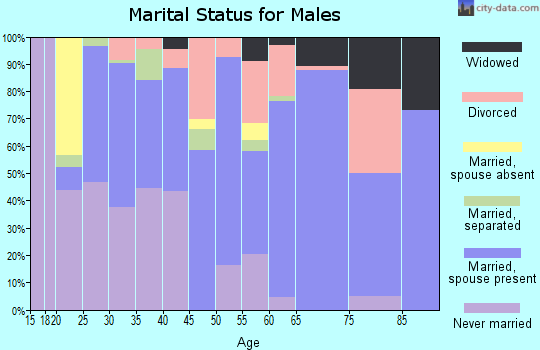
For population 15 years and over in 29330:
Never married: 25.9%
Now married: 50.3%
Separated: 4.9%
Widowed: 7.0%
Divorced: 11.9%
Zip code 29330 compared to state average:
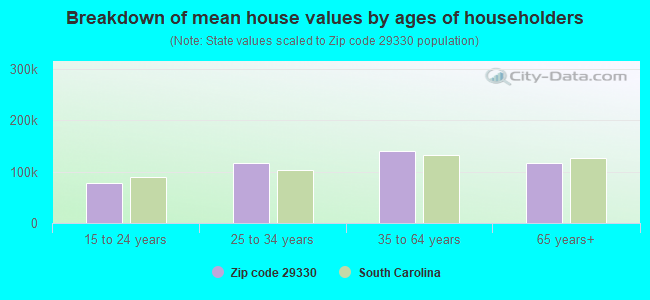
Median house value below state average.
Unemployed percentage below state average.
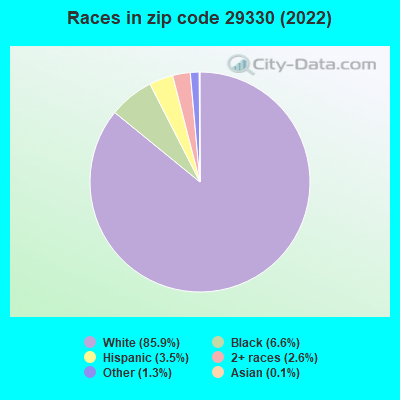
Black race population percentage significantly below state average.
Hispanic race population percentage below state average.
Median age above state average.
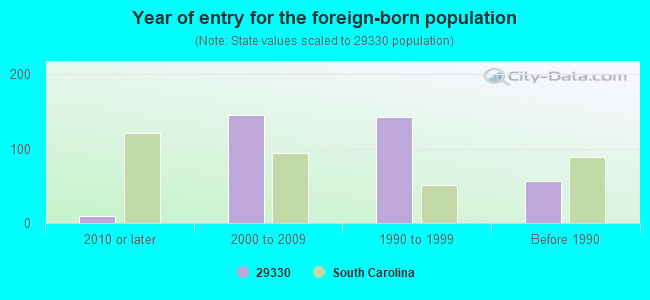
Foreign-born population percentage below state average.
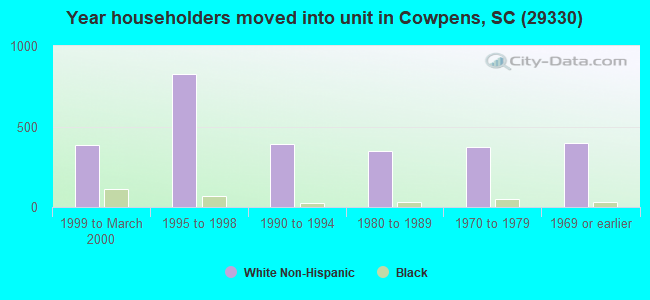
Length of stay since moving in significantly above state average.
Number of college students below state average.
Percentage of population with a bachelor's degree or higher below state average.
Estimated median house/condo value in 2022: $161,804
29330:
$161,804
South Carolina:
$254,600
Median resident age:
This zip code:
46.3 years
South Carolina median age:
40.5 years
Average household size:
This zip code:
2.4 people
South Carolina:
2.4 people
Averages for the 2020 tax year for zip code 29330, filed in 2021:
Average Adjusted Gross Income (AGI) in 2020: $46,655 (Individual Income Tax Returns)
Here:
$46,655
State:
$65,754
Salary/wage: $41,440 (reported on 86.9% of returns)
Here:
$41,440
State:
$52,566
(% of AGI for various income ranges: 1149.7% for AGIs below $25k, 3748.2% for AGIs $25k-50k, 7183.1% for AGIs $50k-75k, 10152.1% for AGIs $75k-100k, 17431.8% for AGIs $100k-200k)
Taxable interest for individuals: $1,127 (reported on 14.2% of returns)
This zip code:
$1,127
South Carolina:
$1,749
(% of AGI for various income ranges: 2.8% for AGIs below $25k, 9.9% for AGIs $25k-50k, 12.2% for AGIs $50k-75k, 11.1% for AGIs $75k-100k, 170.6% for AGIs $100k-200k)
Ordinary dividends: $2,115 (reported on 7.4% of returns)
Here:
$2,115
State:
$8,783
(% of AGI for various income ranges: 7.0% for AGIs below $25k, 11.6% for AGIs $25k-50k, 18.3% for AGIs $50k-75k, 47.4% for AGIs $75k-100k, 70.0% for AGIs $100k-200k)
Net capital gain/loss in AGI: +$10,225 (reported on 6.6% of returns)
Here:
+$10,225
State:
+$24,194
(% of AGI for various income ranges: 4.4% for AGIs below $25k, 5.2% for AGIs $25k-50k, 28.9% for AGIs $50k-75k, 82.6% for AGIs $75k-100k, 379.4% for AGIs $100k-200k)
Profit/loss from business: +$6,463 (reported on 11.7% of returns)
Here:
+$6,463
State:
+$11,253
(% of AGI for various income ranges: 96.7% for AGIs below $25k, 76.7% for AGIs $25k-50k, 130.3% for AGIs $50k-75k, 105.3% for AGIs $75k-100k, 213.5% for AGIs $100k-200k)
Taxable individual retirement arrangement distribution: $16,209 (reported on 6.0% of returns)
29330:
$16,209
South Carolina:
$21,604
(% of AGI for various income ranges: 33.8% for AGIs below $25k, 60.4% for AGIs $25k-50k, 133.3% for AGIs $50k-75k, 454.7% for AGIs $75k-100k, 771.8% for AGIs $100k-200k)
Total itemized deductions: $28,892 (reported on 3.6% of returns)
Here:
$28,892
State:
$35,199
(% of AGI for various income ranges: 36.6% for AGIs below $25k, 240.8% for AGIs $50k-75k, 1462.4% for AGIs $100k-200k)
Charity contributions: $12,750 (reported on 3.3% of returns)
Here:
$12,750
State:
$14,319
(% of AGI for various income ranges: 107.8% for AGIs $50k-75k, 671.8% for AGIs $100k-200k)
Taxes paid: $6,900 (reported on 3.6% of returns)
29330:
$6,900
State:
$7,486
(% of AGI for various income ranges: 6.7% for AGIs below $25k, 53.6% for AGIs $50k-75k, 370.6% for AGIs $100k-200k)
Earned income credit: $2,436 (reported on 25.1% of returns)
Here:
$2,436
State:
$2,397
(% of AGI for various income ranges: 123.6% for AGIs below $25k, 97.9% for AGIs $25k-50k, 2.8% for AGIs $50k-75k)
Percentage of individuals using paid preparers for their 2020 taxes: 94.8%
Here:
95%
State:
93%
(% for various income ranges: 94.3% for AGIs below $25k, 94.6% for AGIs $25k-50k, 96.1% for AGIs $50k-75k, 96.6% for AGIs $75k-100k, 93.3% for AGIs $100k-200k, 100.0% for AGIs over 200k)
Averages for the 2012 tax year for zip code 29330, filed in 2013:
Average Adjusted Gross Income (AGI) in 2012: $38,875 (Individual Income Tax Returns)
Here:
$38,875
State:
$51,133
Salary/wage: $36,112 (reported on 88.2% of returns)
Here:
$36,112
State:
$42,173
(% of AGI for various income ranges: 78.1% for AGIs below $25k, 88.2% for AGIs $25k-50k, 83.6% for AGIs $50k-75k, 82.6% for AGIs $75k-100k, 80.4% for AGIs $100k-200k, 67.5% for AGIs over 200k)
Taxable interest for individuals: $744 (reported on 16.7% of returns)
This zip code:
$744
South Carolina:
$1,468
(% of AGI for various income ranges: 0.4% for AGIs below $25k, 0.2% for AGIs $25k-50k, 0.2% for AGIs $50k-75k, 0.3% for AGIs $75k-100k, 0.3% for AGIs $100k-200k, 0.9% for AGIs over 200k)
Ordinary dividends: $1,657 (reported on 7.1% of returns)
Here:
$1,657
State:
$6,511
(% of AGI for various income ranges: 0.3% for AGIs below $25k, 0.2% for AGIs $25k-50k, 0.3% for AGIs $50k-75k, 0.2% for AGIs $75k-100k, 0.8% for AGIs $100k-200k)
Net capital gain/loss in AGI: +$492 (reported on 4.0% of returns)
Here:
+$492
State:
+$13,061
(% of AGI for various income ranges: 1.3% for AGIs below $25k, 0.9% for AGIs $25k-50k, 0.4% for AGIs $100k-200k)
Profit/loss from business: +$6,824 (reported on 11.8% of returns)
Here:
+$6,824
State:
+$10,167
(% of AGI for various income ranges: 7.3% for AGIs below $25k, 1.6% for AGIs $25k-50k, 1.2% for AGIs $50k-75k, 1.2% for AGIs $75k-100k, 0.9% for AGIs $100k-200k)
Taxable individual retirement arrangement distribution: $8,750 (reported on 5.6% of returns)
29330:
$8,750
South Carolina:
$17,019
(% of AGI for various income ranges: 1.8% for AGIs below $25k, 1.2% for AGIs $25k-50k, 1.1% for AGIs $50k-75k, 2.8% for AGIs $75k-100k)
Total itemized deductions: $19,420 (23% of AGI, reported on 20.1% of returns)
Here:
$19,420
State:
$22,890
Here:
23.2% of AGI
State:
21.4% of AGI
(% of AGI for various income ranges: 3.2% for AGIs below $25k, 5.9% for AGIs $25k-50k, 11.3% for AGIs $50k-75k, 12.9% for AGIs $75k-100k, 16.3% for AGIs $100k-200k, 15.1% for AGIs over 200k)
Charity contributions: $5,834 (reported on 16.4% of returns)
Here:
$5,834
State:
$5,169
(% of AGI for various income ranges: 0.5% for AGIs below $25k, 1.1% for AGIs $25k-50k, 3.1% for AGIs $50k-75k, 3.2% for AGIs $75k-100k, 4.5% for AGIs $100k-200k, 3.1% for AGIs over 200k)
Taxes paid: $5,980 (reported on 20.1% of returns)
29330:
$5,980
State:
$7,644
(% of AGI for various income ranges: 0.4% for AGIs below $25k, 1.0% for AGIs $25k-50k, 2.9% for AGIs $50k-75k, 4.1% for AGIs $75k-100k, 6.1% for AGIs $100k-200k, 7.1% for AGIs over 200k)
Earned income credit: $2,518 (reported on 30.7% of returns)
Here:
$2,518
State:
$2,418
(% of AGI for various income ranges: 10.0% for AGIs below $25k, 2.0% for AGIs $25k-50k)
Percentage of individuals using paid preparers for their 2012 taxes: 59.4%
Here:
59%
State:
57%
(% for various income ranges: 57.3% for AGIs below $25k, 59.1% for AGIs $25k-50k, 59.1% for AGIs $50k-75k, 69.6% for AGIs $75k-100k, 66.7% for AGIs $100k-200k, 66.7% for AGIs over 200k)
Averages for the 2004 tax year for zip code 29330, filed in 2005:
Average Adjusted Gross Income (AGI) in 2004: $32,286 (Individual Income Tax Returns)
Here:
$32,286
State:
$41,965
Salary/wage: $29,837 (reported on 90.4% of returns)
Here:
$29,837
State:
$35,695
(% of AGI for various income ranges: 96.3% for AGIs below $10k, 81.2% for AGIs $10k-25k, 87.7% for AGIs $25k-50k, 89.1% for AGIs $50k-75k, 84.1% for AGIs $75k-100k, 64.4% for AGIs over 100k)
Taxable interest for individuals: $920 (reported on 24.4% of returns)
This zip code:
$920
South Carolina:
$1,623
(% of AGI for various income ranges: 1.4% for AGIs below $10k, 1.0% for AGIs $10k-25k, 0.6% for AGIs $25k-50k, 0.4% for AGIs $50k-75k, 0.5% for AGIs $75k-100k, 0.9% for AGIs over 100k)
Taxable dividends: $1,246 (reported on 10.5% of returns)
Here:
$1,246
State:
$3,999
(% of AGI for various income ranges: 0.4% for AGIs below $10k, 0.5% for AGIs $10k-25k, 0.2% for AGIs $25k-50k, 0.1% for AGIs $50k-75k, 0.5% for AGIs $75k-100k, 1.0% for AGIs over 100k)
Net capital gain/loss: +$2,637 (reported on 5.8% of returns)
Here:
+$2,637
State:
+$13,100
(% of AGI for various income ranges: -0.5% for AGIs below $10k, 0.0% for AGIs $10k-25k, 0.0% for AGIs $25k-50k, 0.0% for AGIs $50k-75k, 0.4% for AGIs $75k-100k, 3.2% for AGIs over 100k)
Profit/loss from business: +$7,489 (reported on 10.5% of returns)
Here:
+$7,489
State:
+$9,144
(% of AGI for various income ranges: -0.4% for AGIs below $10k, 4.6% for AGIs $10k-25k, 1.7% for AGIs $25k-50k, 2.0% for AGIs $50k-75k, 0.3% for AGIs $75k-100k, 4.8% for AGIs over 100k)
IRA payment deduction: $3,387 (reported on 0.9% of returns)
29330:
$3,387
South Carolina:
$2,972
Total itemized deductions: $16,082 (25% of AGI, reported on 23.1% of returns)
Here:
$16,082
State:
$19,039
Here:
25.2% of AGI
State:
22.8% of AGI
(% of AGI for various income ranges: 4.0% for AGIs below $10k, 5.5% for AGIs $10k-25k, 9.6% for AGIs $25k-50k, 13.2% for AGIs $50k-75k, 17.5% for AGIs $75k-100k, 16.9% for AGIs over 100k)
Charity contributions deductions: $4,490 (7% of AGI, reported on 19.6% of returns)
Here:
$4,490
State:
$4,305
Here:
6.7% of AGI
State:
5.0% of AGI
(% of AGI for various income ranges: 0.3% for AGIs below $10k, 1.1% for AGIs $10k-25k, 1.9% for AGIs $25k-50k, 3.0% for AGIs $50k-75k, 4.3% for AGIs $75k-100k, 5.3% for AGIs over 100k)
Total tax: $3,811 (reported on 65.7% of returns)
29330:
$3,811
State:
$6,497
(% of AGI for various income ranges: 1.6% for AGIs below $10k, 3.3% for AGIs $10k-25k, 5.8% for AGIs $25k-50k, 7.9% for AGIs $50k-75k, 9.6% for AGIs $75k-100k, 17.0% for AGIs over 100k)
Earned income credit: $1,841 (reported on 26.9% of returns)
Here:
$1,841
State:
$1,882
Percentage of individuals using paid preparers for their 2004 taxes: 65.3%
Here:
65%
State:
66%
(% for various income ranges: 59.7% for AGIs below $10k, 66.2% for AGIs $10k-25k, 68.3% for AGIs $25k-50k, 63.7% for AGIs $50k-75k, 66.7% for AGIs $75k-100k, 74.7% for AGIs over 100k)
Household received Food Stamps/SNAP in the past 12 months: 453 Household did not receive Food Stamps/SNAP in the past 12 months: 3,091
Women who had a birth in the past 12 months: 90 (85 now married, 9 unmarried) Women who did not have a birth in the past 12 months: 2,022 (784 now married, 1,235 unmarried)
Housing units in zip code 29330 with a mortgage: 1,259 (56 second mortgage, 47 both second mortgage and home equity loan) Houses without a mortgage: 61
Median monthly owner costs for units with a mortgage: $1,057 Median monthly owner costs for units without a mortgage: $394
Residents with income below the poverty level in 2022:
This zip code:
21.2%
Whole state:
14.0%
Residents with income below 50% of the poverty level in 2022:
This zip code:
14.3%
Whole state:
7.3%
Median number of rooms in houses and condos:
Here:
6.2
State:
6.4
Median number of rooms in apartments:
Here:
4.6
State:
4.5
Notable locations in this zip code not listed on our city pages
Churches in zip code 29330 include: Oakdale Church (A), Mount View Church (B), Mount Olive Baptist Church (C), First Baptist Church (D), Central Baptist Church (E), Love Springs Baptist Church (F), Island Creek Baptist Church (G), Graham Chapel (H), Piney Grove Church (I). Display/hide their locations on the map
Cemeteries: Scruggs Cemetery (1), Island Creek Cemetery (2), Love Springs Cemetery (3), Watkins Cemetery (4), Morgan Memorial Gardens (5), Graham Chapel Wesleyan Church Cemetery (6), Waters Cemetery (7). Display/hide their locations on the map
In group quarters: 75 (-1 institutionalized population)
Size of family households: 1,191 2-persons, 644 3-persons, 297 4-persons, 146 5-persons, 14 6-persons
Size of nonfamily households: 1,092 1-person, 153 2-persons
578 married couples with children.
446 single-parent households (99 men, 347 women).
93.1% of residents of 29330 zip code speak English at home.
3.4% of residents speak Spanish at home (71% very well, 9% well, 14% not well, 6% not at all).
1.1% of residents speak Asian or Pacific Island language at home (100% very well).
1.5% of residents speak other language at home (11% very well, 80% well, 9% not well).
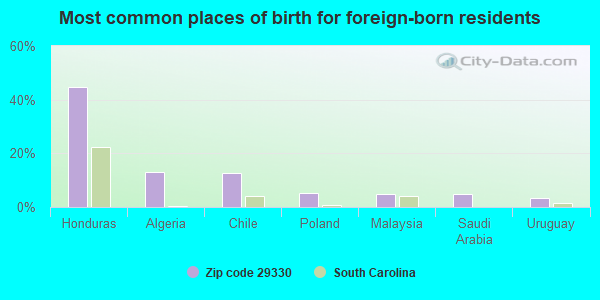
Foreign born population: 214 (2.6%) (50.0% of them are naturalized citizens)
This zip code:
2.6%
Whole state:
5.2%
45%Honduras
13%Algeria
13%Chile
5%Poland
5%Malaysia
5%Saudi Arabia
3%Uruguay
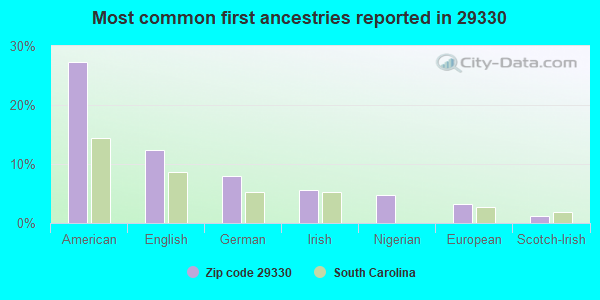
27%American
12%English
8%German
6%Irish
5%Nigerian
3%European
1%Scotch-Irish
Year of entry for the foreign-born population
102010 or later
1452000 to 2009
1421990 to 1999
57Before 1990
Facilities with environmental interests located in this zip code:
FREEDOM TEXTILE CHEMICAL COMPANY (5025 SOUTH MAIN STREET in COWPENS, SC)
AIR MINOR (AIRS/AFS) National Pollutant Discharge Elimination System NON-MAJOR (Tracking pollutant discharge elimination systems) - permit HAZARDOUS WASTE BIENNIAL REPORTER (Resource Conservation and Recovery Act (tracking hazardous waste)) Small Quantity Generators, between 100 kg and 1000 kg of hazardous waste/month (Resource Conservation and Recovery Act (tracking hazardous waste)) STATE MASTER (South Carolina database) - AIR PROGRAM, TRI REPORTER, HAZARDOUS WASTE PROGRAM, AIR PROGRAM TRI REPORTER (Tracking of toxic chemicals releasing facilities) Business SIC classification: SOAP AND OTHER DETERGENTS, EXCEPT SPECIALTY CLEANERS; SURFACE ACTIVE AGENTS, FINISHING AGENTS, SULFONATED OILS, AND ASSISTANTS; INDUSTRIAL ORGANIC CHEMICALS Business NAICS classification: SURFACE ACTIVE AGENT MANUFACTURING. Organizations: ROGERS AND CALLCOTT ENGINEERS INC/L GEORGE MCLEOD (CONTACT/ENGINEERING/CONSULTING FIRM)
, FREEDOM TEXTILE COMPANY SC INC (CONTACT/OPERATOR)
Alternative names: B F GOODRICH , FREEDOM TEXTILE CHEMICAL CO SC, GOODRICH:COWPENS
BROTEX ARMSTRONG LLC (5899 NORTH MAIN STREET in COWPENS, SC)
AIR MINOR (AIRS/AFS) STATE MASTER (South Carolina database) - AIR PROGRAM, REFUSE DISPOSAL, Business SIC classification: SERVICES Alternative names: ARMSTRONG TEXTILES, INTEGRATED RECYCLING GROUP OF SC,LLC
CLARKSON BROTHERS INCORPORATED (HIGHWAY 110 AND I 85 in COWPENS, SC)
(Resource Conservation and Recovery Act (tracking hazardous waste)) STATE MASTER (South Carolina database) - HAZARDOUS WASTE PROGRAM Organizations: OPERNAME (CONTACT/OPERATOR)
, OWNERNAME (CONTACT/OWNER)
Alternative names: CLARKSAN BROS, CLARKSON BROTHERS DEACTIVATED
FOURA ENTERPRISES INC (HIGHWAY 110 in COWPENS, SC)
(Resource Conservation and Recovery Act (tracking hazardous waste)) STATE MASTER (South Carolina database) - HAZARDOUS WASTE PROGRAM Organizations: OPERNAME (CONTACT/OPERATOR)
, FOURA CARL (CONTACT/OWNER)
2K SOUTHERN COWPENS (5920 N MAIN ST in COWPENS, SC)
AIR MINOR (AIRS/AFS) STATE MASTER (South Carolina database) - AIR PROGRAM, Business SIC classification: PLASTICS PRODUCTS; SCRAP AND WASTE MATERIALS Alternative names: 2K SOUTHERN INC - COWPENS
A&J RECYCLING (501 MT OLIVE ROAD in COWPENS, SC)
AIR MINOR (AIRS/AFS) STATE MASTER (South Carolina database) - AIR PROGRAM, Business SIC classification: SECONDARY SMELTING AND REFINING OF NONFERROUS METALS; SERVICES Business NAICS classification: SECONDARY SMELTING AND ALLOYING OF ALUMINUM.
CAROLINA CRANK & CORE (101 DEWBERRY RD in COWPENS, SC)
AIR MINOR (AIRS/AFS) STATE MASTER (South Carolina database) - AIR PROGRAM, Business SIC classification: MOTOR VEHICLE PARTS AND ACCESSORIES
COWPENS ELEMENTARY SCHOOL (341 FOSTER STREET in COWPENS, SC)
(Geographic Names Information System) (National Center for Education Statistics) - STATE ID-4203030 Organizations: SPARTANBURG COUNTY SCHOOL DISTRICT 03 (SCHOOL DISTRICT)
COWPENS MIDDLE SCHOOL (P O BOX 70 in COWPENS, SC)
(National Center for Education Statistics) - STATE ID-4203025 Organizations: SPARTANBURG COUNTY SCHOOL DISTRICT 03 (SCHOOL DISTRICT)
COLLINS & AIKMAN:COWPENS-CLOSED (BANGOR DIV, BOX 100 in COWPENS, SC)
AIR MINOR (AIRS/AFS) Business SIC classification: LACE AND WARP KNIT FABRIC MILLS
FREEDOM TEXTILE: WRONG NEDS (U.S. HIGHWAY 29 in COWPENS, SC)
AIR MINOR (AIRS/AFS) Business SIC classification: INDUSTRIAL ORGANIC CHEMICALS
Housing units lacking complete plumbing facilities: 3.9% Housing units lacking complete kitchen facilities: 2.6%
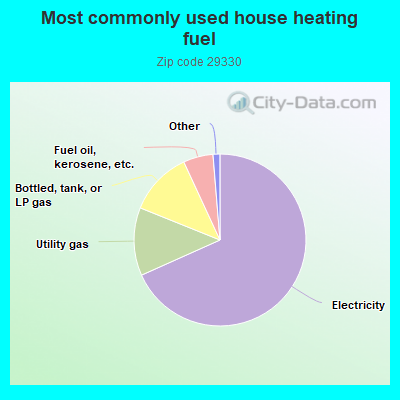
68.3%Electricity
12.8%Utility gas
12.0%Bottled, tank, or LP gas
5.6%Fuel oil, kerosene, etc.
0.6%Wood
0.6%Solar energy
Population in 1990: 5,279. Population change in the 1990s: +2,694 (+51.0%).
Place of birth for U.S.-born residents:
This state: 5,485
Northeast: 570
Midwest: 359
South: 1,496
West: 27
56% of the 29330 zip code residents lived in the same house 5 years ago. Out of people who lived in different houses, 61% lived in this county. Out of people who lived in different counties, 50% lived in South Carolina.
91% of the 29330 zip code residents lived in the same house 1 year ago. Out of people who lived in different houses, 50% moved from this county. Out of people who lived in different houses, 41% moved from different county within same state. Out of people who lived in different houses, 2% moved from different state.
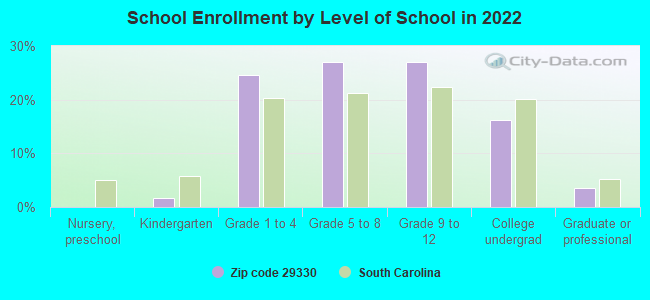
Private vs. public school enrollment:
Students in private schools in grades 1 to 8 (elementary and middle school): 70
Here:
11.7%
South Carolina:
14.4%
Students in private schools in grades 9 to 12 (high school): 69
Here:
21.7%
South Carolina:
11.1%
Students in private undergraduate colleges: 10
Here:
5.5%
South Carolina:
21.9%
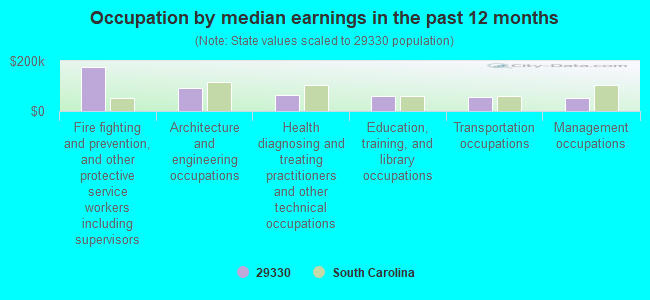
Occupation by median earnings in the past 12 months ($)
176,527Fire fighting and prevention, and other protective service workers including supervisors
90,006Architecture and engineering occupations
62,529Health diagnosing and treating practitioners and other technical occupations
58,862Education, training, and library occupations
54,255Transportation occupations
51,899Management occupations
Top industries in this zip code by the number of employees in 2005:
Management of Companies and Enterprises: Corporate, Subsidiary, and Regional Managing Offices (100-249 employees: 1 establishment)
Wholesale Trade: Piece Goods, Notions, and Other Dry Goods Merchant Wholesalers (50-99: 1)
Other Services (except Public Administration): Religious Organizations (5-9: 7, 1-4: 4)
2003 - 2018 National Fire Incident Reporting System (NFIRS) incidents
Based on the data from the years 2003 - 2018 the average number of fire incidents per year is 79. The highest number of reported fire incidents - 142 took place in 2007, and the least - 19 in 2006. The data has a rising trend.
When looking into fire subcategories, the most reports belonged to: Structure Fires (56.3%), and Outside Fires (29.6%).
Fire incident types reported to NFIRS in Zip Code 29330
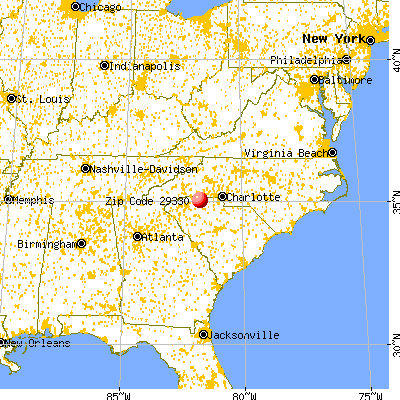


 Nearest zip codes: 29368, 29329, 29324, 29307, 29341, 29346.


 Based on the data from the years 2003 - 2018 the average number of fire incidents per year is 79. The highest number of reported fire incidents - 142 took place in 2007, and the least - 19 in 2006. The data has a rising trend.
 When looking into fire subcategories, the most reports belonged to: Structure Fires (56.3%), and Outside Fires (29.6%).