Estimated zip code population in 2022: 1,968 Zip code population in 2010: 2,380 Zip code population in 2000: 2,106
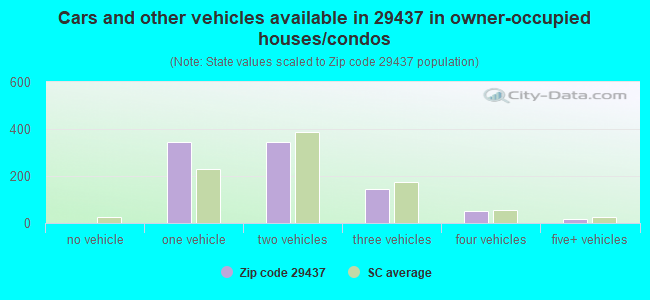
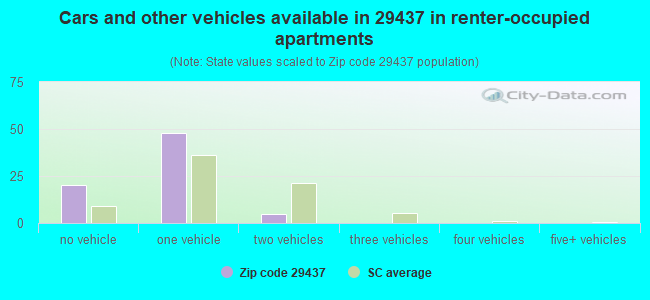
Houses and condos: 1,143 Renter-occupied apartments: 73
% of renters here:
8%
State:
28%
March 2022 cost of living index in zip code 29437: 80.4 (low, U.S. average is 100)
Land area: 93.1 sq. mi. Water area: 0.3 sq. mi.
Population density: 21 people per square mile
(very low).
OSM Map
General Map
Google Map
MSN Map
OSM Map
General Map
Google Map
MSN Map
OSM Map
General Map
Google Map
MSN Map
OSM Map
General Map
Google Map
MSN Map
Please wait while loading the map...
Real estate property taxes paid for housing units in 2022:
This zip code:
0.5% ($905)
South Carolina:
0.5% ($1,185)
Median real estate property taxes paid for housing units with mortgages in 2022: $1,249 (0.5%) Median real estate property taxes paid for housing units with no mortgage in 2022: $822 (0.6%)
Business Search- 14 Million verified businesses
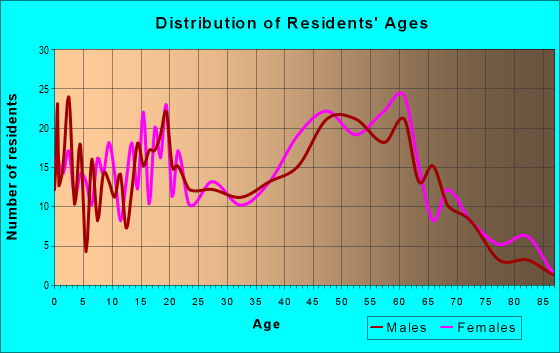
Males: 817
(41.5%)
Females: 1,151
(58.5%)
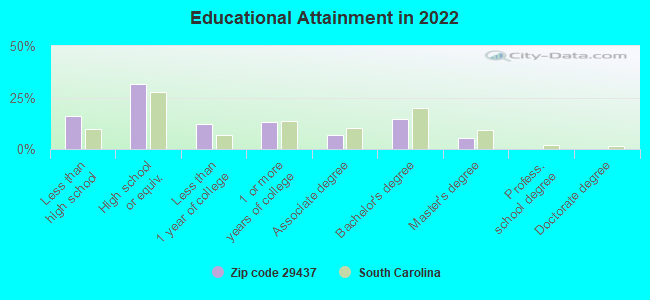
For population 25 years and over in 29437:
High school or higher: 80.9%
Bachelor's degree or higher: 19.4%
Graduate or professional degree: 5.3%
Unemployed: 1.1%
Mean travel time to work (commute): 31.1 minutes
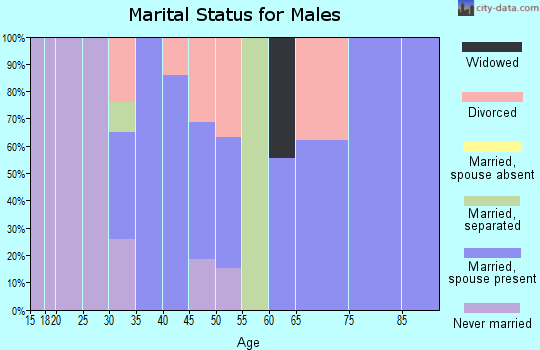
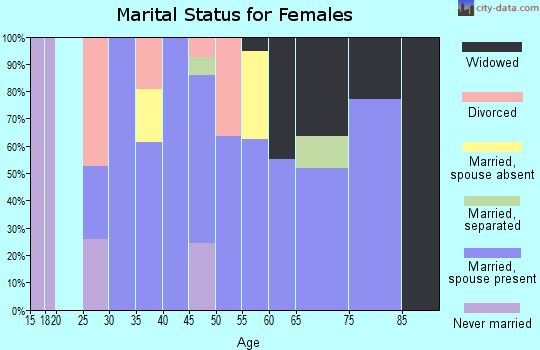
For population 15 years and over in 29437:
Never married: 29.3%
Now married: 42.7%
Separated: 0.3%
Widowed: 19.2%
Divorced: 8.5%
Zip code 29437 compared to state average:
Unemployed percentage significantly below state average.
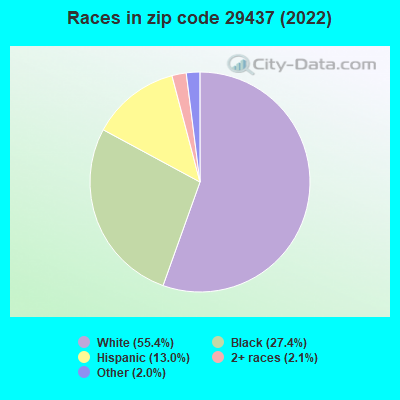
Hispanic race population percentage above state average.
Renting percentage significantly below state average.
Length of stay since moving in significantly above state average.
Number of college students below state average.
Percentage of population with a bachelor's degree or higher below state average.
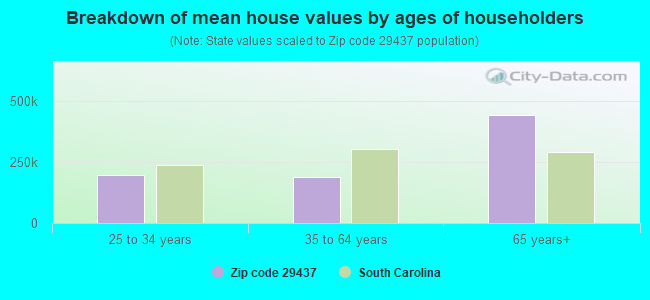
Estimated median house/condo value in 2022: $195,131
29437:
$195,131
South Carolina:
$254,600
Median resident age:
This zip code:
43.0 years
South Carolina median age:
40.5 years
Average household size:
This zip code:
2.1 people
South Carolina:
2.4 people
Averages for the 2020 tax year for zip code 29437, filed in 2021:
Average Adjusted Gross Income (AGI) in 2020: $53,111 (Individual Income Tax Returns)
Here:
$53,111
State:
$65,754
Salary/wage: $45,986 (reported on 82.6% of returns)
Here:
$45,986
State:
$52,566
(% of AGI for various income ranges: 1180.0% for AGIs below $25k, 3878.6% for AGIs $25k-50k, 6905.8% for AGIs $50k-75k, 10496.7% for AGIs $75k-100k, 30234.0% for AGIs $100k-200k)
Taxable interest for individuals: $500 (reported on 18.3% of returns)
This zip code:
$500
South Carolina:
$1,749
(% of AGI for various income ranges: 5.7% for AGIs below $25k, 7.6% for AGIs $25k-50k, 15.8% for AGIs $50k-75k, 33.3% for AGIs $75k-100k, 56.0% for AGIs $100k-200k)
Ordinary dividends: $1,367 (reported on 8.3% of returns)
Here:
$1,367
State:
$8,783
(% of AGI for various income ranges: 10.7% for AGIs below $25k, 35.8% for AGIs $50k-75k, 96.0% for AGIs $100k-200k)
Net capital gain/loss in AGI: +$10,800 (reported on 7.3% of returns)
Here:
+$10,800
State:
+$24,194
(% of AGI for various income ranges: 6.3% for AGIs below $25k, 45.0% for AGIs $50k-75k, 1582.0% for AGIs $100k-200k)
Profit/loss from business: +$8,200 (reported on 15.6% of returns)
Here:
+$8,200
State:
+$11,253
(% of AGI for various income ranges: 128.3% for AGIs below $25k, 91.4% for AGIs $25k-50k, 290.8% for AGIs $50k-75k, 936.0% for AGIs $100k-200k)
Taxable individual retirement arrangement distribution: $12,140 (reported on 4.6% of returns)
29437:
$12,140
South Carolina:
$21,604
(% of AGI for various income ranges: 47.0% for AGIs below $25k, 776.7% for AGIs $75k-100k)
Total itemized deductions: $27,700 (reported on 4.6% of returns)
Here:
$27,700
State:
$35,199
(% of AGI for various income ranges: 293.8% for AGIs $25k-50k, 1536.0% for AGIs $100k-200k)
Charity contributions: $6,825 (reported on 3.7% of returns)
Here:
$6,825
State:
$14,319
(% of AGI for various income ranges: 455.0% for AGIs $75k-100k)
Taxes paid: $7,060 (reported on 4.6% of returns)
29437:
$7,060
State:
$7,486
(% of AGI for various income ranges: 61.9% for AGIs $25k-50k, 446.0% for AGIs $100k-200k)
Earned income credit: $2,625 (reported on 18.3% of returns)
Here:
$2,625
State:
$2,397
(% of AGI for various income ranges: 126.0% for AGIs below $25k, 70.0% for AGIs $25k-50k)
Percentage of individuals using paid preparers for their 2020 taxes: 89.9%
Here:
90%
State:
93%
(% for various income ranges: 87.8% for AGIs below $25k, 96.3% for AGIs $25k-50k, 88.2% for AGIs $50k-75k, 90.0% for AGIs $75k-100k, 83.3% for AGIs $100k-200k, 100.0% for AGIs over 200k)
Averages for the 2012 tax year for zip code 29437, filed in 2013:
Average Adjusted Gross Income (AGI) in 2012: $40,553 (Individual Income Tax Returns)
Here:
$40,553
State:
$51,133
Salary/wage: $36,786 (reported on 87.1% of returns)
Here:
$36,786
State:
$42,173
(% of AGI for various income ranges: 79.7% for AGIs below $25k, 80.5% for AGIs $25k-50k, 79.6% for AGIs $50k-75k, 79.8% for AGIs $75k-100k, 76.1% for AGIs $100k-200k)
Taxable interest for individuals: $406 (reported on 17.8% of returns)
This zip code:
$406
South Carolina:
$1,468
(% of AGI for various income ranges: 0.3% for AGIs below $25k, 0.1% for AGIs $25k-50k, 0.2% for AGIs $50k-75k, 0.3% for AGIs $75k-100k)
Ordinary dividends: $886 (reported on 6.9% of returns)
Here:
$886
State:
$6,511
(% of AGI for various income ranges: 0.2% for AGIs below $25k, 0.3% for AGIs $50k-75k, 0.3% for AGIs $100k-200k)
Net capital gain/loss in AGI: +$1,767 (reported on 5.9% of returns)
Here:
+$1,767
State:
+$13,061
Profit/loss from business: +$4,386 (reported on 13.9% of returns)
Here:
+$4,386
State:
+$10,167
(% of AGI for various income ranges: 4.9% for AGIs below $25k, 2.1% for AGIs $25k-50k, 1.6% for AGIs $75k-100k)
Taxable individual retirement arrangement distribution: $9,800 (reported on 6.9% of returns)
29437:
$9,800
South Carolina:
$17,019
Total itemized deductions: $18,388 (24% of AGI, reported on 25.7% of returns)
Here:
$18,388
State:
$22,890
Here:
24.0% of AGI
State:
21.4% of AGI
(% of AGI for various income ranges: 6.4% for AGIs below $25k, 8.4% for AGIs $25k-50k, 8.9% for AGIs $50k-75k, 16.3% for AGIs $75k-100k, 16.7% for AGIs $100k-200k)
Charity contributions: $3,555 (reported on 21.8% of returns)
Here:
$3,555
State:
$5,169
(% of AGI for various income ranges: 0.9% for AGIs below $25k, 1.6% for AGIs $25k-50k, 1.3% for AGIs $50k-75k, 2.8% for AGIs $75k-100k, 2.6% for AGIs $100k-200k)
Taxes paid: $5,719 (reported on 25.7% of returns)
29437:
$5,719
State:
$7,644
(% of AGI for various income ranges: 0.8% for AGIs below $25k, 2.0% for AGIs $25k-50k, 2.6% for AGIs $50k-75k, 5.1% for AGIs $75k-100k, 6.6% for AGIs $100k-200k)
Earned income credit: $2,531 (reported on 25.7% of returns)
Here:
$2,531
State:
$2,418
(% of AGI for various income ranges: 9.0% for AGIs below $25k, 1.2% for AGIs $25k-50k)
Percentage of individuals using paid preparers for their 2012 taxes: 57.4%
Here:
57%
State:
57%
(% for various income ranges: 55.6% for AGIs below $25k, 53.8% for AGIs $25k-50k, 57.1% for AGIs $50k-75k, 66.7% for AGIs $75k-100k, 71.4% for AGIs $100k-200k)
Averages for the 2004 tax year for zip code 29437, filed in 2005:
Average Adjusted Gross Income (AGI) in 2004: $32,268 (Individual Income Tax Returns)
Here:
$32,268
State:
$41,965
Salary/wage: $30,126 (reported on 88.9% of returns)
Here:
$30,126
State:
$35,695
(% of AGI for various income ranges: 92.6% for AGIs below $10k, 82.8% for AGIs $10k-25k, 86.5% for AGIs $25k-50k, 84.4% for AGIs $50k-75k, 85.3% for AGIs $75k-100k, 66.9% for AGIs over 100k)
Taxable interest for individuals: $540 (reported on 27.3% of returns)
This zip code:
$540
South Carolina:
$1,623
(% of AGI for various income ranges: 0.8% for AGIs below $10k, 0.7% for AGIs $10k-25k, 0.3% for AGIs $25k-50k, 0.8% for AGIs $50k-75k, 0.3% for AGIs $75k-100k, 0.1% for AGIs over 100k)
Taxable dividends: $326 (reported on 8.6% of returns)
Here:
$326
State:
$3,999
(% of AGI for various income ranges: 0.8% for AGIs below $10k, 0.0% for AGIs $25k-50k, 0.1% for AGIs $50k-75k, 0.0% for AGIs $75k-100k, 0.1% for AGIs over 100k)
Net capital gain/loss: +$3,292 (reported on 4.8% of returns)
Here:
+$3,292
State:
+$13,100
Profit/loss from business: +$1,932 (reported on 11.8% of returns)
Here:
+$1,932
State:
+$9,144
(% of AGI for various income ranges: 0.3% for AGIs below $10k, 2.5% for AGIs $10k-25k, -0.2% for AGIs $25k-50k, -0.8% for AGIs $50k-75k, 3.0% for AGIs $75k-100k)
Total itemized deductions: $15,591 (26% of AGI, reported on 25.8% of returns)
Here:
$15,591
State:
$19,039
Here:
26.5% of AGI
State:
22.8% of AGI
(% of AGI for various income ranges: 7.7% for AGIs $10k-25k, 11.8% for AGIs $25k-50k, 13.3% for AGIs $50k-75k, 18.6% for AGIs $75k-100k, 14.3% for AGIs over 100k)
Charity contributions deductions: $3,136 (5% of AGI, reported on 24.3% of returns)
Here:
$3,136
State:
$4,305
Here:
5.3% of AGI
State:
5.0% of AGI
(% of AGI for various income ranges: 1.4% for AGIs $10k-25k, 2.5% for AGIs $25k-50k, 1.8% for AGIs $50k-75k, 3.6% for AGIs $75k-100k, 3.3% for AGIs over 100k)
Total tax: $3,711 (reported on 64.9% of returns)
29437:
$3,711
State:
$6,497
(% of AGI for various income ranges: 1.4% for AGIs below $10k, 2.9% for AGIs $10k-25k, 6.1% for AGIs $25k-50k, 8.6% for AGIs $50k-75k, 10.2% for AGIs $75k-100k, 13.1% for AGIs over 100k)
Earned income credit: $1,792 (reported on 29.0% of returns)
Here:
$1,792
State:
$1,882
Percentage of individuals using paid preparers for their 2004 taxes: 67.0%
Here:
67%
State:
66%
(% for various income ranges: 62.6% for AGIs below $10k, 65.0% for AGIs $10k-25k, 72.5% for AGIs $25k-50k, 62.5% for AGIs $50k-75k, 68.9% for AGIs $75k-100k, 77.4% for AGIs over 100k)
Household received Food Stamps/SNAP in the past 12 months: 77 Household did not receive Food Stamps/SNAP in the past 12 months: 879
Women who had a birth in the past 12 months: 85 (78 now married, 10 unmarried) Women who did not have a birth in the past 12 months: 340 (64 now married, 273 unmarried)
Housing units in zip code 29437 with a mortgage: 290 (26 second mortgage, 21 both second mortgage and home equity loan) Houses without a mortgage: 16
Median monthly owner costs for units with a mortgage: $1,023 Median monthly owner costs for units without a mortgage: $357
Residents with income below the poverty level in 2022:
This zip code:
7.1%
Whole state:
14.0%
Residents with income below 50% of the poverty level in 2022:
This zip code:
6.3%
Whole state:
7.3%
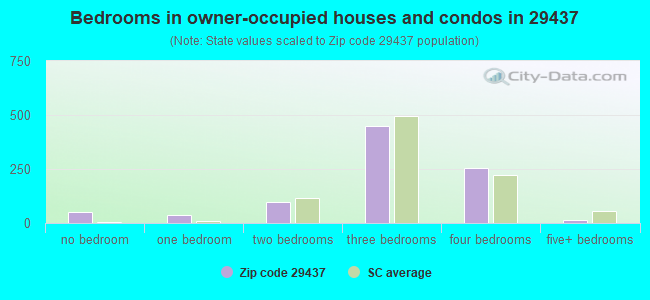
Median number of rooms in houses and condos:
Here:
6.2
State:
6.4
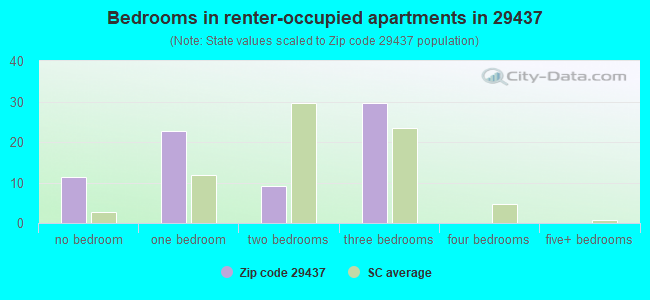
Median number of rooms in apartments:
Here:
4.8
State:
4.5
Notable locations in this zip code not listed on our city pages
Churches in zip code 29437 include: Saint Joans Church (A), Surprise Church (B), Bethel Church (C), Zion Church (D), Brown Temple (E), Bryant Temple Church (F), Calvary Church (G), Shiloh Church (H), Elam Church (I). Display/hide their locations on the map
Cemeteries: Harleyville Cemetery (1), Limestone Cemetery (2), Rumph Cemetery (3), Calvary Cemetery (4), Dorchester Cemetery (5). Display/hide their locations on the map
Streams, rivers, and creeks: Four Hole Swamp (A), Spring Branch (B), Poorly Branch (C), Walnut Branch (D), Pineland Branch (E), Powderhorn Creek (F), Millpond Branch (G), Marshall Branch (H), Lang Branch (I). Display/hide their locations on the map
Size of family households: 191 2-persons, 97 3-persons, 75 4-persons, 55 5-persons, 10 6-persons
Size of nonfamily households: 494 1-person, 21 2-persons, 5 4-persons
293 married couples with children.
63 single-parent households (24 men, 39 women).
91.2% of residents of 29437 zip code speak English at home.
5.8% of residents speak Spanish at home (32% very well, 41% well, 27% not at all).
1.8% of residents speak Asian or Pacific Island language at home (69% very well, 31% well).
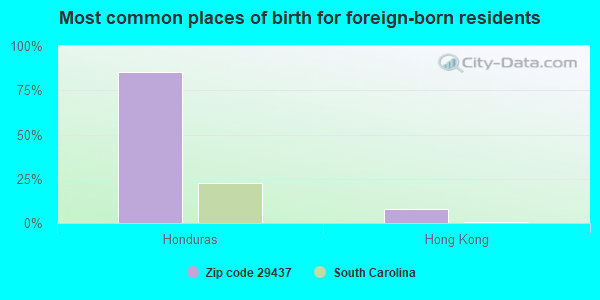
Foreign born population: 82 (4.2%) (9.3% of them are naturalized citizens)
This zip code:
4.2%
Whole state:
5.2%
85%Honduras
8%Hong Kong
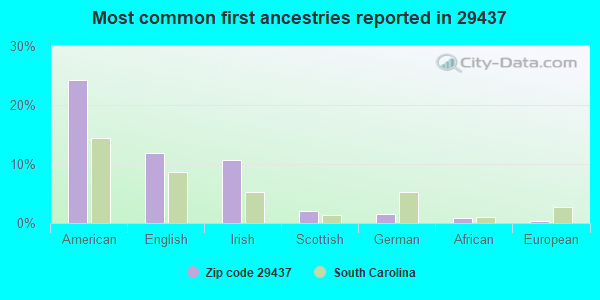
24%American
12%English
11%Irish
2%Scottish
1%German
1%African
0%European
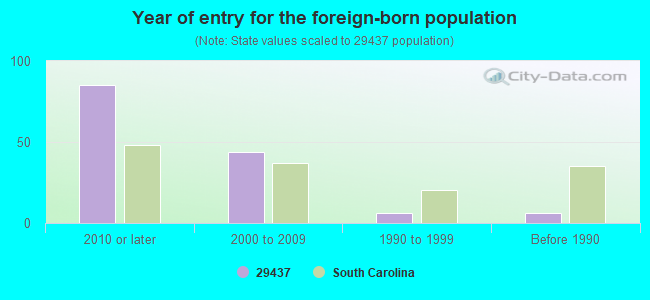
Year of entry for the foreign-born population
852010 or later
442000 to 2009
61990 to 1999
6Before 1990
Facilities with environmental interests located in this zip code:
DORCHESTER COUNTY PUBLIC WORKS DEPARTMENT (2120 EAST MAIN ST in DORCHESTER, SC)
(Resource Conservation and Recovery Act (tracking hazardous waste)) STATE MASTER (South Carolina database) - 401 CERTIFICATION, HAZARDOUS WASTE PROGRAM STATE MASTER (South Carolina database) - SCRAP TIRE MANAGEMENT, MATERIAL RECYCLING, MINE OPERATING PERMIT, OIL CONTROL, DRINKING WATER PROGRAM Alternative names: DORCHESTER CTY PUBLIC WORKS
DORCHESTER CO CAREER SCH (507 SCHOOL HOUSE RD in DORCHESTER, SC)
COMPLIANCE ACTIVITY (Tracking inspections of insecticide, fungicide, and rodenticide, and toxic substances) (National Center for Education Statistics) - STATE ID-1880995 STATE MASTER (South Carolina database) - DRINKING WATER SYSTEM Organizations: DORCHESTER CAREER SCHOOL (SCHOOL DISTRICT)
Alternative names: DORCHESTER COUNTY CAREER SCHOOL
AIR MINOR (AIRS/AFS) Conditionally Exempt Small Quantity Generators, less than 100 kg/month of hazardous waste (Resource Conservation and Recovery Act (tracking hazardous waste)) - notification STATE MASTER (South Carolina database) - AIR PROGRAM, REFUSE DISPOSAL, HAZARDOUS WASTE PROGRAM, MATERIAL RECYCLING, ASBESTOS ABATEMENT PROGRAM, AIR PROGRAM, DRINKING WATER SYSTEM Business SIC classification: MANUFACTURING INDUSTRIES Organizations: EAGLE ENVIRONMENTAL SERVICES INC (CONTACT/OWNER)
Alternative names: VEXOR TECHNOLOGY OF SOUTH CAROLINA, INC
D&A PARTNERSHIP/CARTER PIT (229 LIMESTONE ROAD in DORCHESTER, SC)
National Pollutant Discharge Elimination System NON-MAJOR (Tracking pollutant discharge elimination systems) - permit STATE MASTER (South Carolina database) - National Pollutant Discharge Elimination System Permit Business SIC classification: CONSTRUCTION SAND AND GRAVEL Organizations: D & A LLC/CARTER PIT (CONTACT/OWNER)
Alternative names: D & A LLC/CARTER PIT
D&A PARTNERSHIP/GIVENS PIT (ZION ROAD in DORCHESTER, SC)
National Pollutant Discharge Elimination System NON-MAJOR (Tracking pollutant discharge elimination systems) - permit STATE MASTER (South Carolina database) - National Pollutant Discharge Elimination System Permit Business SIC classification: MISCELLANEOUS NONMETALLIC MINERALS, EXCEPT FUELS Organizations: D & A LLC/GIVENS PIT (CONTACT/OWNER)
Alternative names: D & A LLC/GIVENS PIT
DORCHESTER CPW HARTZOG PIT (2120 E MAIN ST in DORCHESTER, SC)
National Pollutant Discharge Elimination System NON-MAJOR (Tracking pollutant discharge elimination systems) - permit STATE MASTER (South Carolina database) Business SIC classification: MISCELLANEOUS NONMETALLIC MINERALS, EXCEPT FUELS Organizations: R WHALEY DURR/HARTZOG PIT (CONTACT/OWNER)
Alternative names: R WHALEY DURR/HARTZOG PIT
BUTLER WARE TR/DORCHESTER MINE (NEW ZION RD in DORCHESTER, SC)
National Pollutant Discharge Elimination System NON-MAJOR (Tracking pollutant discharge elimination systems) - permit Business SIC classification: MISCELLANEOUS NONMETALLIC MINERALS, EXCEPT FUELS
BUTLER WARE TRK/DIRTY MONEY MN (SC 18247 in DORCHESTER, SC)
National Pollutant Discharge Elimination System NON-MAJOR (Tracking pollutant discharge elimination systems) - permit Business SIC classification: MISCELLANEOUS NONMETALLIC MINERALS, EXCEPT FUELS
D&A LLC/SILVER MINE (POWDER HORN RD in DORCHESTER, SC)
National Pollutant Discharge Elimination System NON-MAJOR (Tracking pollutant discharge elimination systems) - permit Business SIC classification: MISCELLANEOUS NONMETALLIC MINERALS, EXCEPT FUELS
D&A LLC/TOMMY MINE (SANDRIDGE RD in DORCHESTER, SC)
National Pollutant Discharge Elimination System NON-MAJOR (Tracking pollutant discharge elimination systems) - permit Business SIC classification: MISCELLANEOUS NONMETALLIC MINERALS, EXCEPT FUELS
DORCHESTER CO/LOWER DORCHESTER (OFF D.CHESTER RD OFF SC 542 in DORCHESTER, SC)
CRITERIA AND HAZARDOUS AIR POLLUTANT INVENTORY (Inventory of air pollution sources) National Pollutant Discharge Elimination System MAJOR (Tracking pollutant discharge elimination systems) - permit STATE MASTER (South Carolina database) Business SIC classification: SEWERAGE SYSTEMS
DORCHESTER LDFL (WEST OF HWY 78 in DORCHESTER, SC)
SUPERFUND (Superfund database)
Housing units lacking complete plumbing facilities: 7.4% Housing units lacking complete kitchen facilities: 7.6%
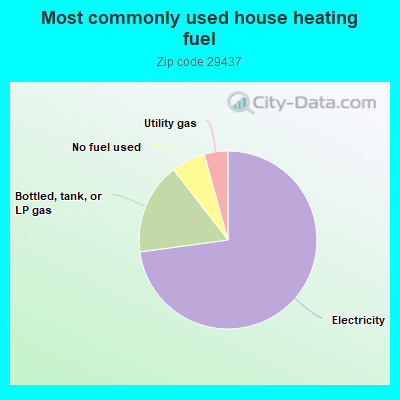
73.0%Electricity
16.7%Bottled, tank, or LP gas
6.2%No fuel used
4.3%Utility gas
Population in 1990: 928. Population change in the 1990s: +1,178 (+126.9%).
Place of birth for U.S.-born residents:
This state: 1,204
Northeast: 251
Midwest: 172
South: 122
West: 78
72% of the 29437 zip code residents lived in the same house 5 years ago. Out of people who lived in different houses, 44% lived in this county. Out of people who lived in different counties, 50% lived in South Carolina.
97% of the 29437 zip code residents lived in the same house 1 year ago. Out of people who lived in different houses, 53% moved from this county. Out of people who lived in different houses, 40% moved from different state.
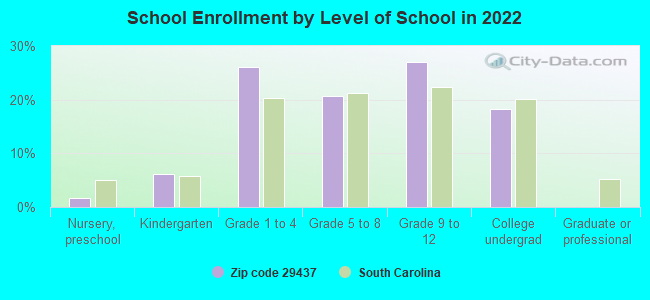
Private vs. public school enrollment:
Students in private schools in grades 1 to 8 (elementary and middle school): 10
Here:
9.4%
South Carolina:
14.4%
Students in private schools in grades 9 to 12 (high school): 46
Here:
68.1%
South Carolina:
11.1%
Students in private undergraduate colleges: 5
Here:
13.2%
South Carolina:
21.9%
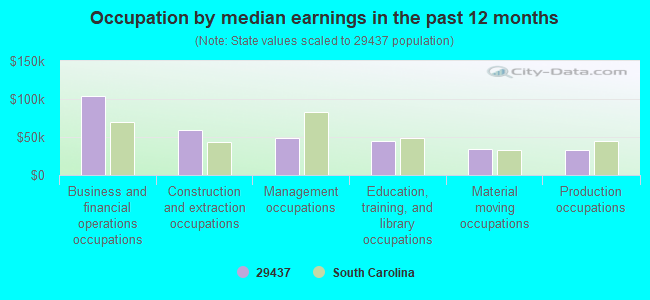
Occupation by median earnings in the past 12 months ($)
103,478Business and financial operations occupations
58,587Construction and extraction occupations
48,761Management occupations
44,150Education, training, and library occupations
34,844Material moving occupations
32,734Production occupations
Top industries in this zip code by the number of employees in 2005:
Administrative and Support and Waste Management and Remediation Services: Solid Waste Landfill (20-49 employees: 1 establishment, 10-19 employees: 1 establishment)
Construction: Framing Contractors (5-9: 1)
Construction: Residential Remodelers (1-4: 2)
Professional, Scientific, and Technical Services: Surveying and Mapping (except Geophysical) Services (1-4: 1)
Construction: All Other Specialty Trade Contractors (1-4: 1)
Construction: Painting and Wall Covering Contractors (1-4: 1)
Fatal accident statistics in 2014:
Fatal accident count: 3
Vehicles involved in fatal accidents: 4
Fatal accidents caused by drunken drivers: 1
Fatalities: 4
Persons involved in fatal accidents: 5
Pedestrians involved in fatal accidents: 0
Fatal accident statistics in 2013:
Fatal accident count: 2
Vehicles involved in fatal accidents: 2
Fatal accidents caused by drunken drivers: 0
Fatalities: 2
Persons involved in fatal accidents: 2
Pedestrians involved in fatal accidents: 0
Home Mortgage Disclosure Act Aggregated Statistics For Year 2009 (Based on 2 partial tracts)
A) FHA, FSA/RHS & VA Home Purchase Loans
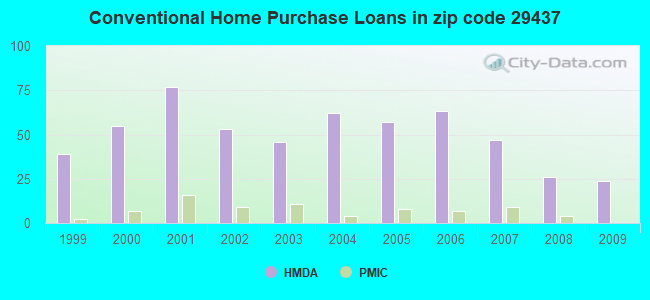
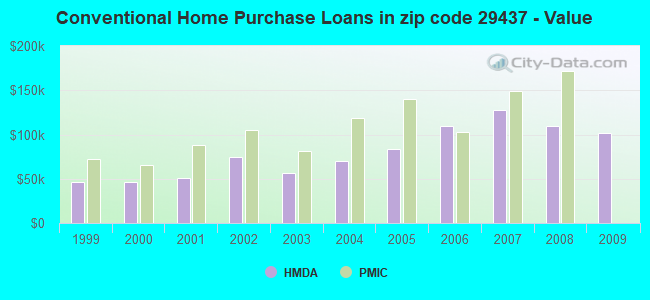
B) Conventional Home Purchase Loans
C) Refinancings
D) Home Improvement Loans
F) Non-occupant Loans on < 5 Family Dwellings (A B C & D)
G) Loans On Manufactured Home Dwelling (A B C & D)
Number
Average Value
Number
Average Value
Number
Average Value
Number
Average Value
Number
Average Value
Number
Average Value
LOANS ORIGINATED
5
$125,926
24
$101,519
100
$115,402
18
$37,981
15
$93,233
34
$53,814
APPLICATIONS APPROVED, NOT ACCEPTED
1
$76,890
3
$49,180
6
$138,187
1
$81,040
0
$0
3
$38,097
APPLICATIONS DENIED
2
$150,655
17
$74,502
36
$130,366
3
$20,780
3
$57,490
20
$72,886
APPLICATIONS WITHDRAWN
1
$140,270
2
$46,755
16
$148,122
2
$122,085
1
$141,300
4
$63,120
FILES CLOSED FOR INCOMPLETENESS
0
$0
1
$33,250
8
$128,056
0
$0
0
$0
3
$85,197
Aggregated Statistics For Year 2008 (Based on 2 partial tracts)
A) FHA, FSA/RHS & VA Home Purchase Loans
B) Conventional Home Purchase Loans
C) Refinancings
D) Home Improvement Loans
F) Non-occupant Loans on < 5 Family Dwellings (A B C & D)
G) Loans On Manufactured Home Dwelling (A B C & D)
Number
Average Value
Number
Average Value
Number
Average Value
Number
Average Value
Number
Average Value
Number
Average Value
LOANS ORIGINATED
4
$90,392
26
$109,655
71
$134,514
27
$25,783
9
$204,337
36
$53,364
APPLICATIONS APPROVED, NOT ACCEPTED
0
$0
2
$129,875
7
$190,731
2
$19,220
1
$170,400
2
$49,870
APPLICATIONS DENIED
3
$178,707
22
$70,085
50
$122,934
16
$76,237
5
$78,132
37
$64,446
APPLICATIONS WITHDRAWN
0
$0
1
$35,330
26
$151,374
1
$3,120
2
$72,730
3
$83,120
FILES CLOSED FOR INCOMPLETENESS
0
$0
0
$0
8
$207,280
0
$0
0
$0
0
$0
Aggregated Statistics For Year 2007 (Based on 2 partial tracts)
A) FHA, FSA/RHS & VA Home Purchase Loans
B) Conventional Home Purchase Loans
C) Refinancings
D) Home Improvement Loans
F) Non-occupant Loans on < 5 Family Dwellings (A B C & D)
G) Loans On Manufactured Home Dwelling (A B C & D)
Number
Average Value
Number
Average Value
Number
Average Value
Number
Average Value
Number
Average Value
Number
Average Value
LOANS ORIGINATED
6
$123,815
47
$128,062
96
$115,026
32
$36,625
15
$76,609
39
$48,460
APPLICATIONS APPROVED, NOT ACCEPTED
2
$72,730
10
$112,420
19
$104,556
2
$23,895
5
$97,458
12
$95,848
APPLICATIONS DENIED
2
$73,250
21
$78,568
91
$121,243
27
$66,419
6
$89,873
45
$62,732
APPLICATIONS WITHDRAWN
2
$69,615
1
$69,610
34
$145,766
4
$87,535
0
$0
4
$88,835
FILES CLOSED FOR INCOMPLETENESS
1
$61,300
5
$86,030
7
$192,809
0
$0
0
$0
0
$0
Aggregated Statistics For Year 2006 (Based on 2 partial tracts)
A) FHA, FSA/RHS & VA Home Purchase Loans
B) Conventional Home Purchase Loans
C) Refinancings
D) Home Improvement Loans
F) Non-occupant Loans on < 5 Family Dwellings (A B C & D)
G) Loans On Manufactured Home Dwelling (A B C & D)
Number
Average Value
Number
Average Value
Number
Average Value
Number
Average Value
Number
Average Value
Number
Average Value
LOANS ORIGINATED
3
$63,033
63
$109,788
75
$95,200
26
$33,368
20
$74,236
55
$58,184
APPLICATIONS APPROVED, NOT ACCEPTED
0
$0
16
$57,924
18
$102,111
4
$24,935
3
$121,910
16
$50,132
APPLICATIONS DENIED
3
$79,657
53
$68,339
45
$105,978
15
$41,352
4
$109,355
49
$51,017
APPLICATIONS WITHDRAWN
0
$0
6
$165,547
22
$86,143
5
$69,406
0
$0
10
$59,846
FILES CLOSED FOR INCOMPLETENESS
0
$0
2
$83,120
12
$100,697
0
$0
0
$0
3
$99,050
Aggregated Statistics For Year 2005 (Based on 2 partial tracts)
A) FHA, FSA/RHS & VA Home Purchase Loans
B) Conventional Home Purchase Loans
C) Refinancings
D) Home Improvement Loans
F) Non-occupant Loans on < 5 Family Dwellings (A B C & D)
G) Loans On Manufactured Home Dwelling (A B C & D)
Number
Average Value
Number
Average Value
Number
Average Value
Number
Average Value
Number
Average Value
Number
Average Value
LOANS ORIGINATED
7
$155,999
57
$83,248
68
$92,059
27
$25,321
11
$60,262
51
$50,157
APPLICATIONS APPROVED, NOT ACCEPTED
0
$0
19
$69,723
10
$98,186
4
$26,235
0
$0
12
$65,111
APPLICATIONS DENIED
6
$113,425
44
$65,504
76
$99,539
22
$49,825
4
$57,145
62
$53,777
APPLICATIONS WITHDRAWN
1
$95,590
14
$69,687
33
$100,311
8
$83,899
3
$83,813
15
$84,990
FILES CLOSED FOR INCOMPLETENESS
0
$0
3
$95,587
9
$156,773
1
$83,120
0
$0
1
$66,500
Aggregated Statistics For Year 2004 (Based on 2 partial tracts)
A) FHA, FSA/RHS & VA Home Purchase Loans
B) Conventional Home Purchase Loans
C) Refinancings
D) Home Improvement Loans
F) Non-occupant Loans on < 5 Family Dwellings (A B C & D)
G) Loans On Manufactured Home Dwelling (A B C & D)
Number
Average Value
Number
Average Value
Number
Average Value
Number
Average Value
Number
Average Value
Number
Average Value
LOANS ORIGINATED
6
$102,862
62
$70,501
101
$91,206
17
$22,186
17
$49,994
53
$47,284
APPLICATIONS APPROVED, NOT ACCEPTED
0
$0
17
$54,211
12
$126,412
4
$16,885
0
$0
17
$46,083
APPLICATIONS DENIED
1
$44,680
55
$53,008
76
$86,305
19
$16,405
3
$21,473
59
$58,026
APPLICATIONS WITHDRAWN
0
$0
4
$78,705
35
$114,082
4
$48,572
0
$0
6
$70,652
FILES CLOSED FOR INCOMPLETENESS
0
$0
0
$0
10
$109,822
0
$0
0
$0
0
$0
Aggregated Statistics For Year 2003 (Based on 2 partial tracts)
A) FHA, FSA/RHS & VA Home Purchase Loans
B) Conventional Home Purchase Loans
C) Refinancings
D) Home Improvement Loans
F) Non-occupant Loans on < 5 Family Dwellings (A B C & D)
Number
Average Value
Number
Average Value
Number
Average Value
Number
Average Value
Number
Average Value
LOANS ORIGINATED
3
$105,287
46
$56,309
158
$92,096
21
$11,874
8
$46,365
APPLICATIONS APPROVED, NOT ACCEPTED
1
$40,520
5
$57,146
27
$80,041
4
$43,638
2
$40,520
APPLICATIONS DENIED
4
$67,015
55
$53,272
106
$76,004
19
$6,179
4
$48,055
APPLICATIONS WITHDRAWN
1
$48,830
8
$73,899
28
$88,798
1
$25,980
1
$51,950
FILES CLOSED FOR INCOMPLETENESS
0
$0
0
$0
7
$131,953
0
$0
0
$0
Aggregated Statistics For Year 2002 (Based on 2 partial tracts)
A) FHA, FSA/RHS & VA Home Purchase Loans
B) Conventional Home Purchase Loans
C) Refinancings
D) Home Improvement Loans
F) Non-occupant Loans on < 5 Family Dwellings (A B C & D)
Number
Average Value
Number
Average Value
Number
Average Value
Number
Average Value
Number
Average Value
LOANS ORIGINATED
1
$62,340
53
$75,043
113
$82,053
26
$18,023
10
$39,482
APPLICATIONS APPROVED, NOT ACCEPTED
0
$0
22
$45,858
22
$74,619
0
$0
0
$0
APPLICATIONS DENIED
2
$47,275
46
$67,580
95
$66,387
14
$14,769
4
$72,990
APPLICATIONS WITHDRAWN
2
$52,990
5
$94,342
42
$71,122
0
$0
1
$37,400
FILES CLOSED FOR INCOMPLETENESS
0
$0
4
$91,952
5
$83,952
0
$0
0
$0
Aggregated Statistics For Year 2001 (Based on 2 partial tracts)
A) FHA, FSA/RHS & VA Home Purchase Loans
B) Conventional Home Purchase Loans
C) Refinancings
D) Home Improvement Loans
F) Non-occupant Loans on < 5 Family Dwellings (A B C & D)
Number
Average Value
Number
Average Value
Number
Average Value
Number
Average Value
Number
Average Value
LOANS ORIGINATED
5
$102,654
77
$50,763
86
$82,613
20
$11,273
11
$40,049
APPLICATIONS APPROVED, NOT ACCEPTED
0
$0
24
$41,950
15
$74,739
1
$3,120
1
$45,720
APPLICATIONS DENIED
2
$64,420
70
$52,410
82
$62,961
17
$21,941
2
$24,415
APPLICATIONS WITHDRAWN
0
$0
11
$76,130
31
$65,457
2
$8,830
0
$0
FILES CLOSED FOR INCOMPLETENESS
0
$0
1
$102,860
9
$68,690
0
$0
1
$49,870
Aggregated Statistics For Year 2000 (Based on 2 partial tracts)
A) FHA, FSA/RHS & VA Home Purchase Loans
B) Conventional Home Purchase Loans
C) Refinancings
D) Home Improvement Loans
F) Non-occupant Loans on < 5 Family Dwellings (A B C & D)
Number
Average Value
Number
Average Value
Number
Average Value
Number
Average Value
Number
Average Value
LOANS ORIGINATED
5
$85,822
55
$46,868
58
$62,537
20
$10,546
6
$38,097
APPLICATIONS APPROVED, NOT ACCEPTED
4
$33,768
26
$50,991
22
$43,544
4
$16,885
1
$25,980
APPLICATIONS DENIED
5
$51,950
138
$41,319
106
$49,843
10
$25,144
11
$43,165
APPLICATIONS WITHDRAWN
1
$33,250
9
$43,292
35
$66,080
2
$11,950
2
$50,910
FILES CLOSED FOR INCOMPLETENESS
0
$0
0
$0
6
$50,218
0
$0
0
$0
Aggregated Statistics For Year 1999 (Based on 1 partial tract)
A) FHA, FSA/RHS & VA Home Purchase Loans
B) Conventional Home Purchase Loans
C) Refinancings
D) Home Improvement Loans
E) Loans on Dwellings For 5+ Families
F) Non-occupant Loans on < 5 Family Dwellings (A B C & D)
Detailed PMIC statistics for the following Tracts:0103.00
2002 - 2018 National Fire Incident Reporting System (NFIRS) incidents
According to the data from the years 2002 - 2018 the average number of fire incidents per year is 14. The highest number of reported fires - 52 took place in 2011, and the least - 0 in 2003. The data has a rising trend.
When looking into fire subcategories, the most reports belonged to: Outside Fires (53.2%), and Structure Fires (26.4%).
Fire incident types reported to NFIRS in Zip Code 29437


 Nearest zip codes: 29448, 29477, 29472, 29435, 29059, 29471.
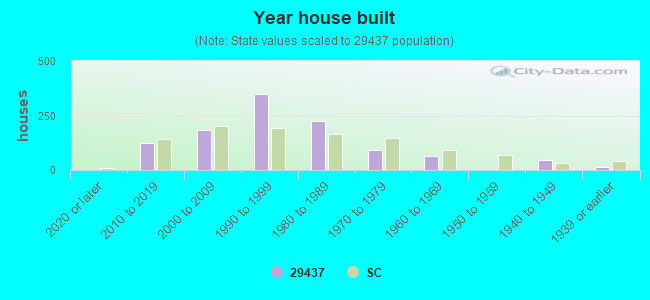


 According to the data from the years 2002 - 2018 the average number of fire incidents per year is 14. The highest number of reported fires - 52 took place in 2011, and the least - 0 in 2003. The data has a rising trend.
 When looking into fire subcategories, the most reports belonged to: Outside Fires (53.2%), and Structure Fires (26.4%).