Estimated zip code population in 2022: 17,461 Zip code population in 2010: 14,779 Zip code population in 2000: 27,164
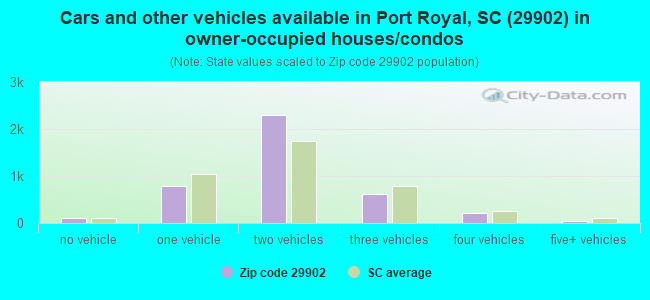
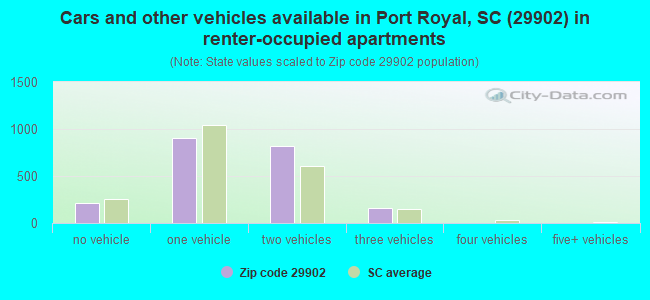
Houses and condos: 7,135 Renter-occupied apartments: 2,101
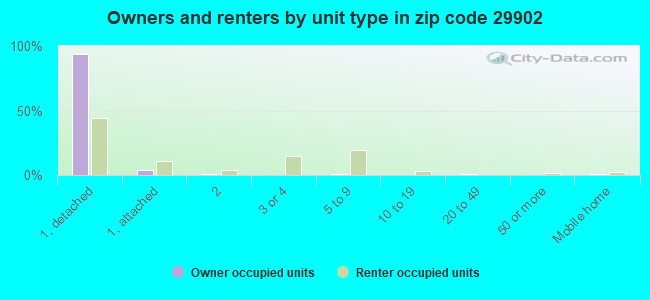
% of renters here:
34%
State:
28%
March 2022 cost of living index in zip code 29902: 84.8 (less than average, U.S. average is 100)
Land area: 18.7 sq. mi. Water area: 11.3 sq. mi.
Population density: 934 people per square mile
(low).
OSM Map
General Map
Google Map
MSN Map
OSM Map
General Map
Google Map
MSN Map
OSM Map
General Map
Google Map
MSN Map
OSM Map
General Map
Google Map
MSN Map
Please wait while loading the map...
Real estate property taxes paid for housing units in 2022:
This zip code:
0.5% ($1,740)
South Carolina:
0.5% ($1,185)
Median real estate property taxes paid for housing units with mortgages in 2022: $1,918 (0.5%) Median real estate property taxes paid for housing units with no mortgage in 2022: $1,472 (0.5%)
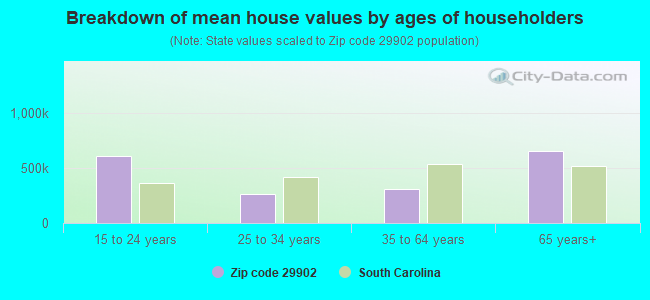
Estimated median house/condo value in 2022: $360,350
29902:
$360,350
South Carolina:
$254,600
According to our research of South Carolina and other state lists, there was 1 registered sex offender living in 29902 zip code as of April 27, 2024. The ratio of all residents to sex offenders in zip code 29902 is 15,899 to 1. The ratio of registered sex offenders to all residents in this zip code is much lower than the state average.
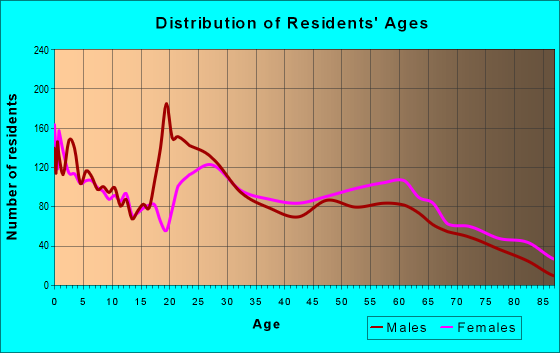
Median resident age:
This zip code:
33.7 years
South Carolina median age:
40.5 years
Average household size:
This zip code:
2.5 people
South Carolina:
2.4 people
Averages for the 2020 tax year for zip code 29902, filed in 2021:
Average Adjusted Gross Income (AGI) in 2020: $74,426 (Individual Income Tax Returns)
Here:
$74,426
State:
$65,754
Salary/wage: $55,743 (reported on 77.8% of returns)
Here:
$55,743
State:
$52,566
(% of AGI for various income ranges: 1201.9% for AGIs below $25k, 3679.6% for AGIs $25k-50k, 6298.6% for AGIs $50k-75k, 9009.5% for AGIs $75k-100k, 17037.0% for AGIs $100k-200k, 94913.8% for AGIs over 200k)
Taxable interest for individuals: $1,953 (reported on 30.6% of returns)
This zip code:
$1,953
South Carolina:
$1,749
(% of AGI for various income ranges: 17.5% for AGIs below $25k, 25.6% for AGIs $25k-50k, 52.8% for AGIs $50k-75k, 101.4% for AGIs $75k-100k, 201.7% for AGIs $100k-200k, 2300.0% for AGIs over 200k)
Ordinary dividends: $7,782 (reported on 22.5% of returns)
Here:
$7,782
State:
$8,783
(% of AGI for various income ranges: 34.1% for AGIs below $25k, 45.6% for AGIs $25k-50k, 163.9% for AGIs $50k-75k, 303.8% for AGIs $75k-100k, 829.8% for AGIs $100k-200k, 6063.8% for AGIs over 200k)
Net capital gain/loss in AGI: +$29,746 (reported on 21.3% of returns)
Here:
+$29,746
State:
+$24,194
(% of AGI for various income ranges: 27.4% for AGIs below $25k, 29.9% for AGIs $25k-50k, 163.6% for AGIs $50k-75k, 238.9% for AGIs $75k-100k, 1204.6% for AGIs $100k-200k, 44185.0% for AGIs over 200k)
Profit/loss from business: +$15,803 (reported on 18.7% of returns)
Here:
+$15,803
State:
+$11,253
(% of AGI for various income ranges: 132.2% for AGIs below $25k, 144.7% for AGIs $25k-50k, 224.6% for AGIs $50k-75k, 440.0% for AGIs $75k-100k, 808.9% for AGIs $100k-200k, 11873.8% for AGIs over 200k)
Taxable individual retirement arrangement distribution: $22,958 (reported on 10.4% of returns)
29902:
$22,958
South Carolina:
$21,604
(% of AGI for various income ranges: 42.4% for AGIs below $25k, 107.6% for AGIs $25k-50k, 215.4% for AGIs $50k-75k, 487.6% for AGIs $75k-100k, 1548.3% for AGIs $100k-200k, 5031.2% for AGIs over 200k)
Self-employed (Keogh) retirement plans: $29,950 (reported on 0.6% of returns)
29902:
$29,950
South Carolina:
$25,038
(% of AGI for various income ranges: 1497.5% for AGIs over 200k)
Total itemized deductions: $33,456 (reported on 10.3% of returns)
Here:
$33,456
State:
$35,199
(% of AGI for various income ranges: 75.3% for AGIs below $25k, 106.6% for AGIs $25k-50k, 403.6% for AGIs $50k-75k, 564.6% for AGIs $75k-100k, 1480.4% for AGIs $100k-200k, 11846.2% for AGIs over 200k)
Charity contributions: $12,534 (reported on 8.4% of returns)
Here:
$12,534
State:
$14,319
(% of AGI for various income ranges: 6.2% for AGIs below $25k, 18.6% for AGIs $25k-50k, 61.2% for AGIs $50k-75k, 158.1% for AGIs $75k-100k, 378.3% for AGIs $100k-200k, 5223.8% for AGIs over 200k)
Taxes paid: $7,396 (reported on 10.2% of returns)
29902:
$7,396
State:
$7,486
(% of AGI for various income ranges: 8.3% for AGIs below $25k, 19.2% for AGIs $25k-50k, 91.9% for AGIs $50k-75k, 131.9% for AGIs $75k-100k, 422.6% for AGIs $100k-200k, 2156.2% for AGIs over 200k)
Earned income credit: $2,265 (reported on 17.6% of returns)
Here:
$2,265
State:
$2,397
(% of AGI for various income ranges: 112.3% for AGIs below $25k, 73.4% for AGIs $25k-50k, 1.9% for AGIs $50k-75k)
Percentage of individuals using paid preparers for their 2020 taxes: 92.5%
Here:
92%
State:
93%
(% for various income ranges: 90.7% for AGIs below $25k, 93.1% for AGIs $25k-50k, 93.1% for AGIs $50k-75k, 91.9% for AGIs $75k-100k, 93.9% for AGIs $100k-200k, 94.6% for AGIs over 200k)
Averages for the 2012 tax year for zip code 29902, filed in 2013:
Average Adjusted Gross Income (AGI) in 2012: $52,008 (Individual Income Tax Returns)
Here:
$52,008
State:
$51,133
Salary/wage: $41,159 (reported on 81.9% of returns)
Here:
$41,159
State:
$42,173
(% of AGI for various income ranges: 78.6% for AGIs below $25k, 81.5% for AGIs $25k-50k, 69.3% for AGIs $50k-75k, 69.0% for AGIs $75k-100k, 61.4% for AGIs $100k-200k, 37.9% for AGIs over 200k)
Taxable interest for individuals: $1,519 (reported on 31.5% of returns)
This zip code:
$1,519
South Carolina:
$1,468
(% of AGI for various income ranges: 0.9% for AGIs below $25k, 0.4% for AGIs $25k-50k, 1.0% for AGIs $50k-75k, 0.5% for AGIs $75k-100k, 0.7% for AGIs $100k-200k, 2.0% for AGIs over 200k)
Ordinary dividends: $6,197 (reported on 19.4% of returns)
Here:
$6,197
State:
$6,511
(% of AGI for various income ranges: 1.4% for AGIs below $25k, 1.3% for AGIs $25k-50k, 1.3% for AGIs $50k-75k, 1.6% for AGIs $75k-100k, 2.4% for AGIs $100k-200k, 5.1% for AGIs over 200k)
Net capital gain/loss in AGI: +$14,871 (reported on 15.2% of returns)
Here:
+$14,871
State:
+$13,061
(% of AGI for various income ranges: 0.2% for AGIs $25k-50k, 0.8% for AGIs $50k-75k, 0.8% for AGIs $75k-100k, 2.3% for AGIs $100k-200k, 19.6% for AGIs over 200k)
Profit/loss from business: +$12,684 (reported on 16.5% of returns)
Here:
+$12,684
State:
+$10,167
(% of AGI for various income ranges: 6.9% for AGIs below $25k, 3.0% for AGIs $25k-50k, 1.9% for AGIs $50k-75k, 2.4% for AGIs $75k-100k, 2.2% for AGIs $100k-200k, 9.0% for AGIs over 200k)
Taxable individual retirement arrangement distribution: $19,733 (reported on 9.9% of returns)
29902:
$19,733
South Carolina:
$17,019
(% of AGI for various income ranges: 2.3% for AGIs below $25k, 1.5% for AGIs $25k-50k, 2.5% for AGIs $50k-75k, 3.4% for AGIs $75k-100k, 4.5% for AGIs $100k-200k, 7.1% for AGIs over 200k)
Self-employment retirement plans: $20,200 (reported on 0.5% of returns)
29902:
$20,200
South Carolina:
$21,023
Total itemized deductions: $24,103 (24% of AGI, reported on 31.1% of returns)
Here:
$24,103
State:
$22,890
Here:
24.1% of AGI
State:
21.4% of AGI
(% of AGI for various income ranges: 8.8% for AGIs below $25k, 10.0% for AGIs $25k-50k, 13.4% for AGIs $50k-75k, 14.6% for AGIs $75k-100k, 17.1% for AGIs $100k-200k, 19.2% for AGIs over 200k)
Charity contributions: $5,437 (reported on 26.5% of returns)
Here:
$5,437
State:
$5,169
(% of AGI for various income ranges: 0.9% for AGIs below $25k, 1.2% for AGIs $25k-50k, 2.3% for AGIs $50k-75k, 2.4% for AGIs $75k-100k, 3.4% for AGIs $100k-200k, 5.3% for AGIs over 200k)
Taxes paid: $7,455 (reported on 31.0% of returns)
29902:
$7,455
State:
$7,644
(% of AGI for various income ranges: 1.4% for AGIs below $25k, 2.0% for AGIs $25k-50k, 3.5% for AGIs $50k-75k, 4.3% for AGIs $75k-100k, 6.0% for AGIs $100k-200k, 7.3% for AGIs over 200k)
Earned income credit: $2,327 (reported on 23.4% of returns)
Here:
$2,327
State:
$2,418
(% of AGI for various income ranges: 7.9% for AGIs below $25k, 1.5% for AGIs $25k-50k)
Percentage of individuals using paid preparers for their 2012 taxes: 47.4%
Here:
47%
State:
57%
(% for various income ranges: 43.3% for AGIs below $25k, 44.1% for AGIs $25k-50k, 50.0% for AGIs $50k-75k, 50.0% for AGIs $75k-100k, 60.7% for AGIs $100k-200k, 78.6% for AGIs over 200k)
Averages for the 2004 tax year for zip code 29902, filed in 2005:
Average Adjusted Gross Income (AGI) in 2004: $45,780 (Individual Income Tax Returns)
Here:
$45,780
State:
$41,965
Salary/wage: $36,723 (reported on 82.3% of returns)
Here:
$36,723
State:
$35,695
(% of AGI for various income ranges: 112.5% for AGIs below $10k, 78.2% for AGIs $10k-25k, 79.9% for AGIs $25k-50k, 73.2% for AGIs $50k-75k, 73.6% for AGIs $75k-100k, 46.5% for AGIs over 100k)
Taxable interest for individuals: $1,532 (reported on 40.9% of returns)
This zip code:
$1,532
South Carolina:
$1,623
(% of AGI for various income ranges: 3.7% for AGIs below $10k, 1.8% for AGIs $10k-25k, 1.1% for AGIs $25k-50k, 1.4% for AGIs $50k-75k, 1.2% for AGIs $75k-100k, 1.4% for AGIs over 100k)
Taxable dividends: $4,842 (reported on 24.6% of returns)
Here:
$4,842
State:
$3,999
(% of AGI for various income ranges: 5.0% for AGIs below $10k, 1.7% for AGIs $10k-25k, 1.5% for AGIs $25k-50k, 1.5% for AGIs $50k-75k, 1.5% for AGIs $75k-100k, 4.3% for AGIs over 100k)
Net capital gain/loss: +$15,907 (reported on 19.2% of returns)
Here:
+$15,907
State:
+$13,100
(% of AGI for various income ranges: -1.9% for AGIs below $10k, -0.2% for AGIs $10k-25k, 0.9% for AGIs $25k-50k, 1.1% for AGIs $50k-75k, 1.7% for AGIs $75k-100k, 16.8% for AGIs over 100k)
Profit/loss from business: +$13,994 (reported on 15.9% of returns)
Here:
+$13,994
State:
+$9,144
(% of AGI for various income ranges: -2.9% for AGIs below $10k, 4.5% for AGIs $10k-25k, 2.1% for AGIs $25k-50k, 2.9% for AGIs $50k-75k, 3.4% for AGIs $75k-100k, 8.3% for AGIs over 100k)
IRA payment deduction: $3,079 (reported on 3.0% of returns)
29902:
$3,079
South Carolina:
$2,972
(% of AGI for various income ranges: 0.2% for AGIs $10k-25k, 0.2% for AGIs $25k-50k, 0.3% for AGIs $50k-75k, 0.3% for AGIs $75k-100k, 0.1% for AGIs over 100k)
Self-employed pension: $17,103 (reported on 1.1% of returns)
Here:
$17,103
South Carolina:
$15,117
Total itemized deductions: $20,544 (24% of AGI, reported on 34.2% of returns)
Here:
$20,544
State:
$19,039
Here:
23.6% of AGI
State:
22.8% of AGI
(% of AGI for various income ranges: 10.2% for AGIs below $10k, 8.8% for AGIs $10k-25k, 13.0% for AGIs $25k-50k, 17.3% for AGIs $50k-75k, 17.5% for AGIs $75k-100k, 16.8% for AGIs over 100k)
Charity contributions deductions: $4,518 (5% of AGI, reported on 30.4% of returns)
Here:
$4,518
State:
$4,305
Here:
5.0% of AGI
State:
5.0% of AGI
(% of AGI for various income ranges: 0.6% for AGIs below $10k, 1.3% for AGIs $10k-25k, 1.8% for AGIs $25k-50k, 2.8% for AGIs $50k-75k, 3.0% for AGIs $75k-100k, 4.3% for AGIs over 100k)
Total tax: $7,098 (reported on 71.4% of returns)
29902:
$7,098
State:
$6,497
(% of AGI for various income ranges: 3.0% for AGIs below $10k, 3.7% for AGIs $10k-25k, 6.3% for AGIs $25k-50k, 8.6% for AGIs $50k-75k, 10.3% for AGIs $75k-100k, 17.6% for AGIs over 100k)
Earned income credit: $1,759 (reported on 20.0% of returns)
Here:
$1,759
State:
$1,882
Percentage of individuals using paid preparers for their 2004 taxes: 63.7%
Here:
64%
State:
66%
(% for various income ranges: 58.8% for AGIs below $10k, 68.3% for AGIs $10k-25k, 62.9% for AGIs $25k-50k, 60.5% for AGIs $50k-75k, 56.5% for AGIs $75k-100k, 74.4% for AGIs over 100k)
Likely homosexual households (counted as self-reported same-sex unmarried-partner households)
Lesbian couples: 0.1% of all households
Gay men: 0.0% of all households
Household received Food Stamps/SNAP in the past 12 months: 608 Household did not receive Food Stamps/SNAP in the past 12 months: 5,555
Women who had a birth in the past 12 months: 135 (84 now married, 50 unmarried) Women who did not have a birth in the past 12 months: 3,545 (1,884 now married, 1,674 unmarried)
Housing units in zip code 29902 with a mortgage: 2,417 (143 second mortgage, 23 home equity loan, 116 both second mortgage and home equity loan) Median monthly owner costs for units with a mortgage: $1,649 Median monthly owner costs for units without a mortgage: $568
Residents with income below the poverty level in 2022:
This zip code:
13.6%
Whole state:
14.0%
Residents with income below 50% of the poverty level in 2022:
This zip code:
7.4%
Whole state:
7.3%
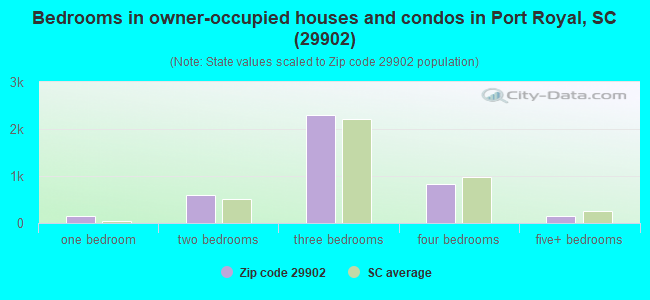
Median number of rooms in houses and condos:
Here:
6.3
State:
6.4
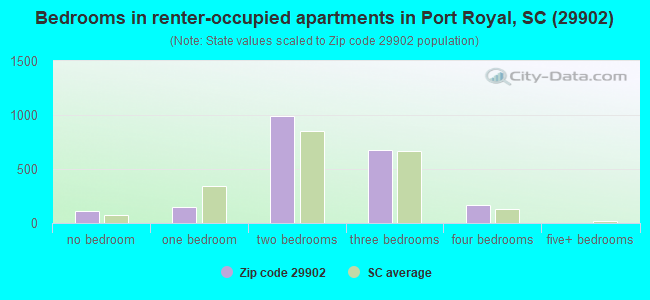
Median number of rooms in apartments:
Here:
5.0
State:
4.5
Notable locations in this zip code not listed on our city pages
In group quarters: 2,250 (-1 institutionalized population)
Size of family households: 2,305 2-persons, 1,082 3-persons, 611 4-persons, 275 5-persons, 67 6-persons, 8 7-or-more-persons
Size of nonfamily households: 1,514 1-person, 252 2-persons, 51 3-persons
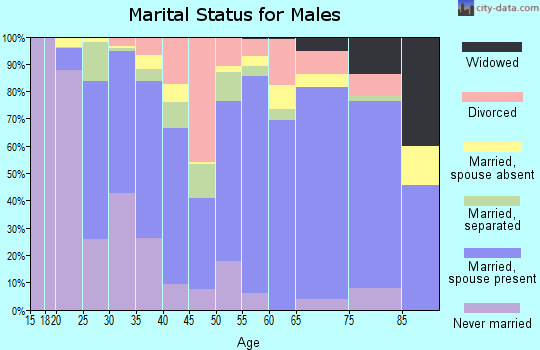
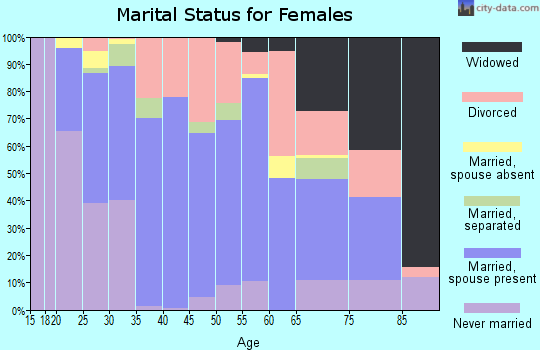
2,098 married couples with children.
847 single-parent households (77 men, 770 women).
90.1% of residents of 29902 zip code speak English at home.
6.0% of residents speak Spanish at home (74% very well, 16% well, 11% not well).
1.0% of residents speak other Indo-European language at home (100% very well).
2.2% of residents speak Asian or Pacific Island language at home (57% very well, 27% well, 16% not well).
0.3% of residents speak other language at home (92% very well, 8% well).
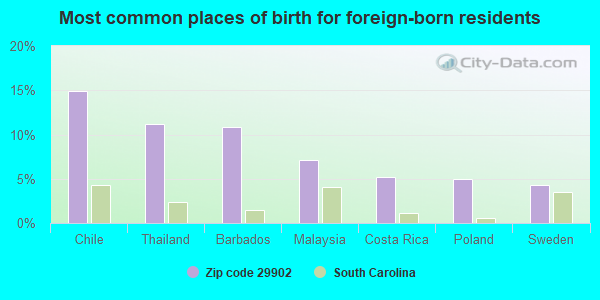
Foreign born population: 979 (5.6%) (32.3% of them are naturalized citizens)
This zip code:
5.6%
Whole state:
5.2%
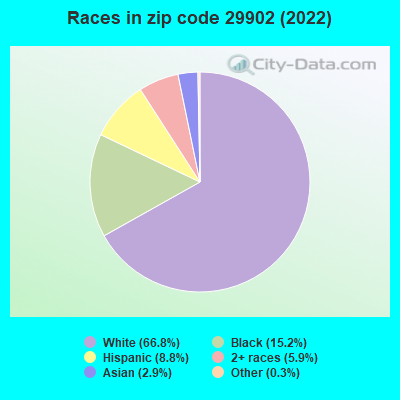
15%Chile
11%Thailand
11%Barbados
7%Malaysia
5%Costa Rica
5%Poland
4%Sweden
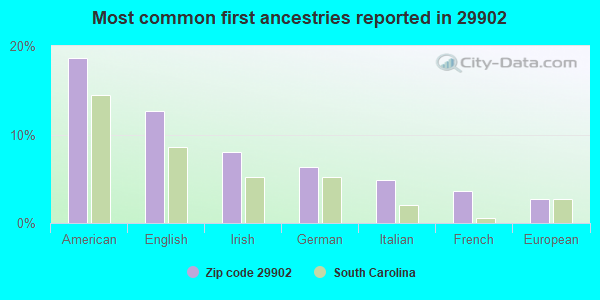
19%American
13%English
8%Irish
6%German
5%Italian
4%French
3%European
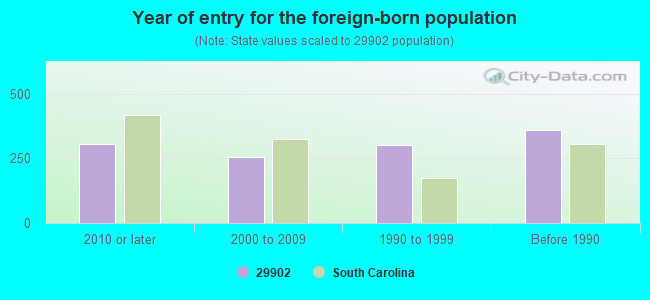
Year of entry for the foreign-born population
3072010 or later
2572000 to 2009
3011990 to 1999
360Before 1990
Major facilities with environmental interests located in this zip code:
BARON YACHTS INCORPORATED (2999 LAUREL BAY RD in BEAUFORT, SC)
AIR MINOR (AIRS/AFS) (Resource Conservation and Recovery Act (tracking hazardous waste)) STATE MASTER (South Carolina database) - AIR PROGRAM, HAZARDOUS WASTE PROGRAM, Business SIC classification: BOAT BUILDING AND REPAIRING Organizations: OPERNAME (CONTACT/OPERATOR)
, BARON YACHTS INC. (CONTACT/OWNER)
Alternative names: BARON YACHTS - CLOSD
BEAUFORT MEMORIAL HOSPITAL (955 RIBAUT RD in BEAUFORT, SC)
AIR MINOR (AIRS/AFS) COMPLIANCE ACTIVITY (Tracking inspections of insecticide, fungicide, and rodenticide, and toxic substances) Conditionally Exempt Small Quantity Generators, less than 100 kg/month of hazardous waste (Resource Conservation and Recovery Act (tracking hazardous waste)) - notification STATE MASTER (South Carolina database) - X-RAY EQUIPMENT, AIR PROGRAM, UNDERGROUND STORAGE TANK PROGRAM, RADIOACTIVE MATERIALS, National Pollutant Discharge Elimination System Permit, HAZARDOUS WASTE PROGRAM, DRINKING WATER PROGRAM Business SIC classification: GENERAL MEDICAL AND SURGICAL HOSPITALS Organizations: SWYGERT CROWDER CONSULTING ENGINEERS (CONTACT/ENGINEERING/CONSULTING FIRM)
, OPERNAME (CONTACT/OPERATOR)
BEAUFORT HIGH SCHOOL (2501 MOSSY OAKS RD in BEAUFORT, SC)
(National Center for Education Statistics) - STATE ID-0701002 STATE MASTER (South Carolina database) - UNDERGROUND STORAGE TANK PROGRAM Organizations: BEAUFORT COUNTY SCHOOL DISTRICT (SCHOOL DISTRICT)
ATHENA CORPORATION (4300 SALT CREEK DR. E. in BURTON, SC)
National Pollutant Discharge Elimination System NON-MAJOR (Tracking pollutant discharge elimination systems) - permit Conditionally Exempt Small Quantity Generators, less than 100 kg/month of hazardous waste (Resource Conservation and Recovery Act (tracking hazardous waste)) - notification STATE MASTER (South Carolina database) - TRI REPORTER, HAZARDOUS WASTE PROGRAM TRI REPORTER (Tracking of toxic chemicals releasing facilities) Business SIC classification: PLASTICS PLUMBING FIXTURES; CUT STONE AND STONE PRODUCTS Alternative names: ATHENA CORP - SALT CREEK
GARRETT DRY CLEANING (ISLAND SQUARE HWY 21 in BEAUFORT, SC)
(Resource Conservation and Recovery Act (tracking hazardous waste)) STATE MASTER (South Carolina database) - HAZARDOUS WASTE PROGRAM Organizations: OPERNAME (CONTACT/OPERATOR)
, JOHNSON GROUP INC (CONTACT/OWNER)
Alternative names: GARRETT DRY CLEANING DEACTIVATED
ACTION AUTO BODY (1561 JERICHO RD in BEAUFORT, SC)
(Resource Conservation and Recovery Act (tracking hazardous waste)) STATE MASTER (South Carolina database) - HAZARDOUS WASTE PROGRAM Organizations: OPERNAME (CONTACT/OPERATOR)
, BOB BRINKS (CONTACT/OWNER)
A-1 COLLISION CENTER (HIGHWAY 802 & CLEVELAND STREET in BEAUFORT, SC)
(Resource Conservation and Recovery Act (tracking hazardous waste)) STATE MASTER (South Carolina database) - HAZARDOUS WASTE PROGRAM Organizations: FRANCIS A BIRCKBICHLER (CONTACT/OWNER)
Alternative names: A "1" COLLISION CENTER DEACTIVATED
CAROLINA WOODLORE (RT 1 BOX 200 GRAYS HILL in BURTON, SC)
(Resource Conservation and Recovery Act (tracking hazardous waste)) STATE MASTER (South Carolina database) - HAZARDOUS WASTE PROGRAM Organizations: JAMES R EDDY (CONTACT/OWNER)
CITY OF BEAUFORT (302 CARTERET STREET in BEAUFORT, SC)
(Resource Conservation and Recovery Act (tracking hazardous waste)) STATE MASTER (South Carolina database) - 401 CERTIFICATION, WOOD WASTE RECYCLING, UNDERGROUND STORAGE TANK PROGRAM, DRINKING WATER PROGRAM, DRINKING WATER SYSTEM Alternative names: BEAUFORT CITY HALL , BEAUFORT CITY HALL DEACT, BEAUFORT CITY OF
DEN OF ANTIQUITY INCORPORATED (330 OKATIE RD in BEAUFORT, SC)
(Resource Conservation and Recovery Act (tracking hazardous waste)) STATE MASTER (South Carolina database) - HAZARDOUS WASTE PROGRAM Organizations: NICHOLAS SANTERAMO (CONTACT/OWNER)
BEAUFORT BODY & PAINT WORKS (1555B SALEM RD in BURTON, SC)
(Resource Conservation and Recovery Act (tracking hazardous waste)) STATE MASTER (South Carolina database) - HAZARDOUS WASTE PROGRAM Organizations: DONALD L MADDREN (CONTACT/OWNER)
EARLS BODY SHOP (1301 BOUNDARY ST in BEAUFORT, SC)
Conditionally Exempt Small Quantity Generators, less than 100 kg/month of hazardous waste (Resource Conservation and Recovery Act (tracking hazardous waste)) - notification STATE MASTER (South Carolina database) - HAZARDOUS WASTE PROGRAM Organizations: PAUL R BAZEMORE JR (CONTACT/OPERATOR)
FACULTY HOUSE (1007 CARTERET in BEAUFORT, SC)
(Resource Conservation and Recovery Act (tracking hazardous waste)) STATE MASTER (South Carolina database) - HAZARDOUS WASTE PROGRAM Organizations: UNIVERSITY OF SOUTH CAROLINA (CONTACT/OWNER)
Housing units lacking complete plumbing facilities: 0.7% Housing units lacking complete kitchen facilities: 0.1%
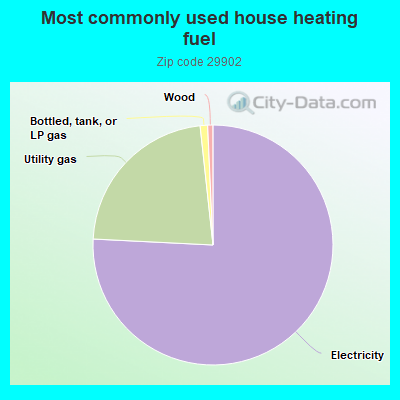
75.5%Electricity
22.4%Utility gas
1.0%Bottled, tank, or LP gas
0.7%Wood
Population in 1990: 43,849.
Place of birth for U.S.-born residents:
This state: 6,516
Northeast: 2,555
Midwest: 1,770
South: 4,288
West: 1,271
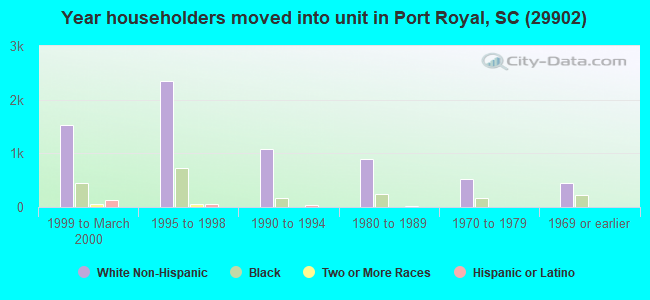
42% of the 29902 zip code residents lived in the same house 5 years ago. Out of people who lived in different houses, 30% lived in this county. Out of people who lived in different counties, 50% lived in South Carolina.
85% of the 29902 zip code residents lived in the same house 1 year ago. Out of people who lived in different houses, 46% moved from this county. Out of people who lived in different houses, 6% moved from different county within same state. Out of people who lived in different houses, 47% moved from different state. Out of people who lived in different houses, 1% moved from abroad.
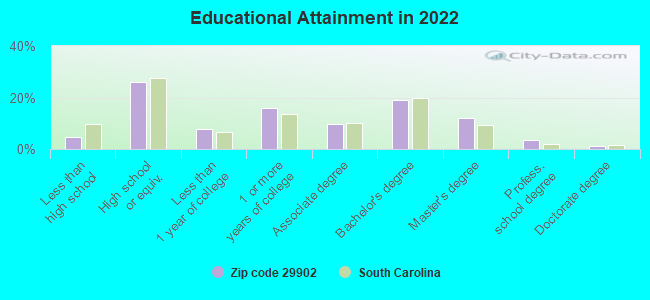
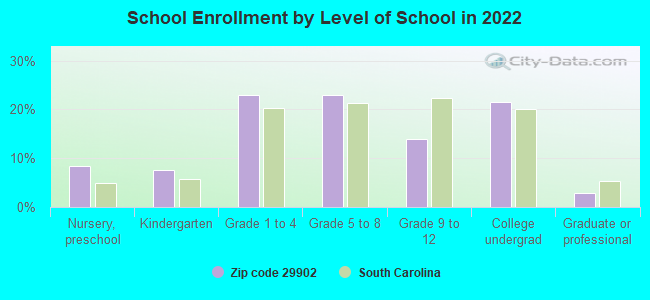
Private vs. public school enrollment:
Students in private schools in grades 1 to 8 (elementary and middle school): 345
Here:
28.9%
South Carolina:
14.4%
Students in private schools in grades 9 to 12 (high school): 54
Here:
15.5%
South Carolina:
11.1%
Students in private undergraduate colleges: 135
Here:
25.4%
South Carolina:
21.9%
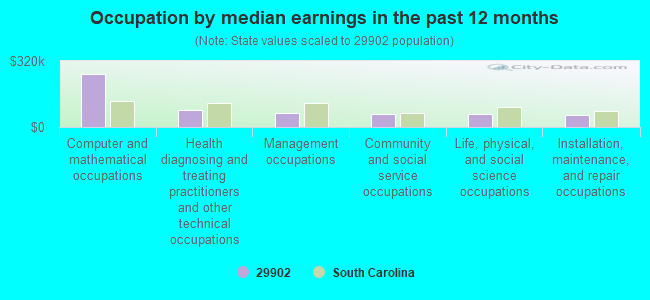
Occupation by median earnings in the past 12 months ($)
258,763Computer and mathematical occupations
83,967Health diagnosing and treating practitioners and other technical occupations
69,001Management occupations
64,525Community and social service occupations
63,545Life, physical, and social science occupations
59,290Installation, maintenance, and repair occupations
Companies with biggest federal contracts located in this zip code (BEAUFORT, SC):
PLAIR ENTERPRISES INC. (2724 DEPOT RD; small business) : $2,324,614 in 152 contractsfrom 2000 to 2006
Contracts for Packing/Crating Services, Lease or Rental of Equipment -- Office Machines, Text Processing Systems and Visible Record Equipment, Relocation Services by Navy Signed by year:2000: $1,102,106; 2001: $0; 2002: $627,701; 2003: $0; 2004: $460,435; 2005: $88,389; 2006: $45,983.
Biggest contracts:
$627,701 with Navy for Packing/Crating Services. Signed on 2002-01-01. Completion date: 2002-12-31.
$551,053, same as above.Signed on 2000-01-01. Completion date: 2005-12-31.
$551,053, same as above.Signed on 2000-01-01. Completion date: 2005-12-31.
$182,385 with Navy for Lease or Rental of Equipment -- Office Machines, Text Processing Systems and Visible Record Equipment. Signed on 2004-11-02. Completion date: 2005-09-30.
BEAUFORT RADIOLOGY ASSOCIATES (1200 BROTHERHOOD WAY; small business) : $1,996,075 in 5 contractsfrom 2001 to 2005
Contracts for Radiology Services by Navy Signed by year:2000: $0; 2001: $398,700; 2002: $797,400; 2003: $0; 2004: $0; 2005: $799,975; 2006: $0.
Biggest contracts:
$399,994 with Navy for Radiology Services. Signed on 2005-02-05. Completion date: 2005-09-29.
$399,981, same as above.Signed on 2005-08-17. Completion date: 2005-09-29.
$398,700, same as above.Signed on 2002-10-01. Completion date: 2002-09-30.
$398,700, same as above.Signed on 2002-10-01. Completion date: 2002-09-30.
PEPSI-COLA METROPOLITAN BOTTLI (287 BROAD RIVER BLVD) : $619,213 in 8 contractsfrom 2002 to 2006
Contracts for Food Items For Resale, Non-Food Items For Resale by Defense Commissary Agency, Department of Defense Signed by year:2000: $0; 2001: $0; 2002: $56,467; 2003: $68,579; 2004: $63,109; 2005: $340,511; 2006: $90,547.
Biggest contracts:
$180,626 with Defense Commissary Agency for Food Items For Resale. Signed on 2005-04-01. Completion date: 2005-08-31.
$90,547 with Defense Commissary Agency for Non-Food Items For Resale. Signed on 2006-01-01. Completion date: 2006-03-31.
$79,191 with Defense Commissary Agency for Food Items For Resale. Signed on 2005-01-01. Completion date: 2005-03-31.
$68,579 with Department of Defense for Food Items For Resale. Signed on 2003-04-01. Completion date: 2003-04-30.
THURMAN RAY SHERBERT, MD (1200 BROTHERHOOD WAY; small business) : $362,668 in 3 contractsfrom 2000 to 2001
$279,468 with Navy for Radiology Services. Signed on 2001-01-11. Completion date: 2002-03-31.
$83,200, same as above.Signed on 2000-11-21. Completion date: 2001-01-20.
$0, same as above.Signed on 2000-11-21. Completion date: 2001-01-20.
HAROLD D CROSS (2809 W ROYAL OAKS DR; small business) : $316,416 in 6 contractsfrom 2000 to 2002
Contracts for General Health Care Services by Navy Signed by year:2000: $151,424; 2001: $78,208; 2002: $86,784; 2003: $0; 2004: $0; 2005: $0; 2006: $0.
Biggest contracts:
$79,872 with Navy for General Health Care Services. Signed on 2002-10-01. Completion date: 2001-09-30.
$78,208, same as above.Signed on 2001-10-01. Completion date: 2001-09-30.
$76,544, same as above.Signed on 2000-10-01. Completion date: 2001-09-30.
$74,880, same as above.Signed on 2000-02-02. Completion date: 2000-09-30.
LOUANNE VICKERY GLACCUM (2509 HERMITAGE ROAD; small business) : $133,894 in 3 contractsin 2000
$67,600 with Navy for Nursing Services. Signed on 2000-10-01. Completion date: 2001-09-30.
$66,294, same as above.Signed on 2000-02-02. Completion date: 2000-09-30.
$0, same as above.Signed on 2000-02-02. Completion date: 2000-09-30.
ROSSIS LANDSCAPE SERVICES (2410 WAVERLY WAY; small business) : $123,746 in 11 contractsfrom 2004 to 2005
Contracts for Landscaping/Groundskeeping Services, Miscellaneous Items, Maintenance, Repair or Alteration of Real Property -- Unimproved Real Property (Land) by Navy Signed by year:2000: $0; 2001: $0; 2002: $0; 2003: $0; 2004: $117,516; 2005: $6,230; 2006: $0.
Biggest contracts:
$58,789 with Navy for Landscaping/Groundskeeping Services. Signed on 2004-10-01. Completion date: 2005-09-30.
$33,377 with Navy for Miscellaneous Items. Signed on 2004-10-01. Completion date: 2004-09-30.
$16,800 with Navy for Landscaping/Groundskeeping Services. Signed on 2005-10-31. Completion date: 2006-09-30.
$14,000, same as above.Signed on 2004-08-27. Completion date: 2005-08-26.
BEAUFORT COUNTY SCHOOL DISTRIC (1300 KING ST)
$101,798 with Navy for Construction of Structures and Facilities -- Waste Treatment and Storage Facilities. Signed on 2001-10-01. Completion date: 2001-09-30.
PORT-O-CALL COMPANY INC (417 MERITTA AVE) : $81,600 in 2 contractsin 1999
$81,600 with Navy for Lease or Rental of Equipment -- Miscellaneous. Signed on 1999-11-15. Completion date: 2000-09-30.
$0, same as above.Signed on 1999-11-15. Completion date: 2000-09-30.
A C HARVEY SCREEN PRINTING (1905 BAGGETT ST; small business) : $49,526 in 7 contractsfrom 2004 to 2006
Contracts for Clothing, Special Purpose, Miscellaneous Items, Outerwear, Men's by Navy Signed by year:2000: $0; 2001: $0; 2002: $0; 2003: $0; 2004: $5,800; 2005: $31,683; 2006: $12,043.
Biggest contracts:
$14,560 with Navy for Clothing, Special Purpose. Signed on 2005-06-07. Completion date: 2005-07-07.
$7,446, same as above.Signed on 2005-12-14. Completion date: 2006-01-15.
$6,355, same as above.Signed on 2006-03-07. Completion date: 2006-04-15.
$5,906, same as above.Signed on 2005-08-18. Completion date: 2005-09-09.
Top industries in this zip code by the number of employees in 2005:
Health Care and Social Assistance: General Medical and Surgical Hospitals (500-999 employees: 2 establishments)
Health Care and Social Assistance: Offices of Physicians (except Mental Health Specialists) (20-49: 4, 10-19: 8, 5-9: 11, 1-4: 12)
Accommodation and Food Services: Food Service Contractors (100-249: 2, 10-19: 1, 1-4: 1)
Professional, Scientific, and Technical Services: Offices of Lawyers (50-99: 1, 20-49: 1, 10-19: 4, 5-9: 9, 1-4: 28)
Accommodation and Food Services: Hotels (except Casino Hotels) and Motels (20-49: 3, 10-19: 4, 5-9: 4, 1-4: 5)
Health Care and Social Assistance: Nursing Care Facilities (100-249: 1, 1-4: 1)
Wholesale Trade: Stationery and Office Supplies Merchant Wholesalers (100-249: 1)
People in group quarters in 2010:
521 people in military barracks and dormitories (nondisciplinary)
195 people in local jails and other municipal confinement facilities
155 people in nursing facilities/skilled-nursing facilities
79 people in hospitals with patients who have no usual home elsewhere
39 people in emergency and transitional shelters (with sleeping facilities) for people experiencing homelessness
17 people in workers' group living quarters and job corps centers
5 people in mental (psychiatric) hospitals and psychiatric units in other hospitals
4 people in residential treatment centers for adults
People in group quarters in 2000:
3,788 people in military barracks, etc.
200 people in nursing homes
162 people in local jails and other confinement facilities (including police lockups)
19 people in homes for the mentally ill
15 people in other noninstitutional group quarters
6 people in homes for the mentally retarded
2004 - 2018 National Fire Incident Reporting System (NFIRS) incidents
According to the data from the years 2004 - 2018 the average number of fire incidents per year is 36. The highest number of reported fire incidents - 68 took place in 2004, and the least - 0 in 2007. The data has a dropping trend.
When looking into fire subcategories, the most incidents belonged to: Structure Fires (49.0%), and Outside Fires (27.2%).
Fire incident types reported to NFIRS in Zip Code 29902


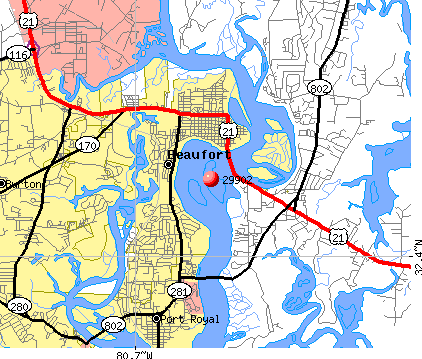 Nearest zip codes: 29905, 29935, 29926, 29904, 29906, 29920.


 According to the data from the years 2004 - 2018 the average number of fire incidents per year is 36. The highest number of reported fire incidents - 68 took place in 2004, and the least - 0 in 2007. The data has a dropping trend.
 When looking into fire subcategories, the most incidents belonged to: Structure Fires (49.0%), and Outside Fires (27.2%).