Estimated zip code population in 2022: 27,158 Zip code population in 2010: 21,989 Zip code population in 2000: 24,374
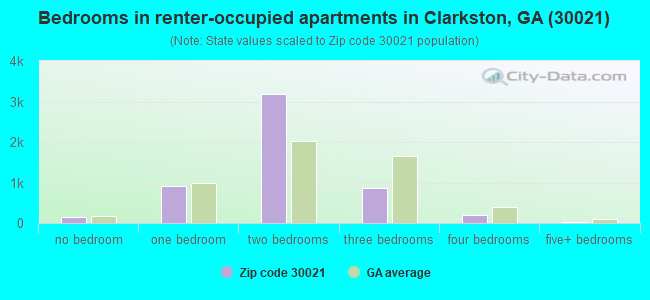
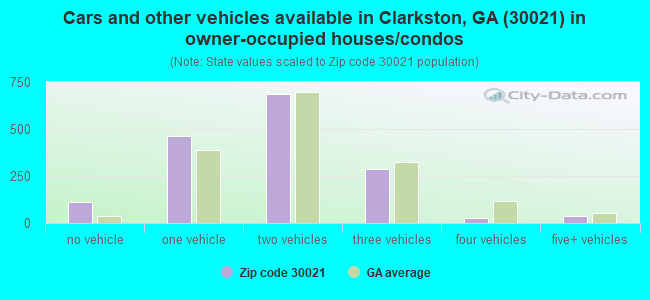
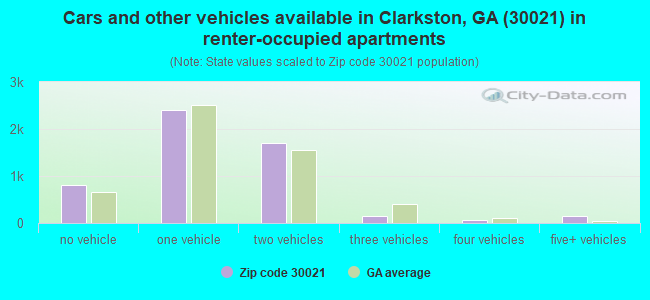
Houses and condos: 8,483 Renter-occupied apartments: 5,289
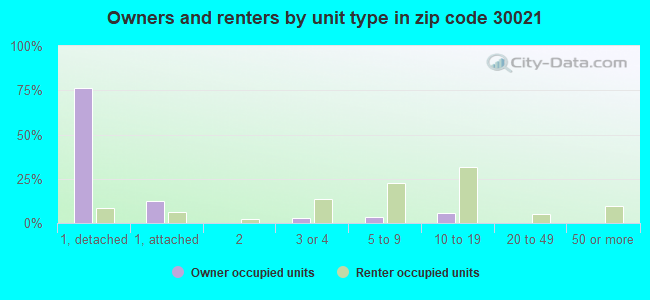
% of renters here:
77%
State:
34%
March 2022 cost of living index in zip code 30021: 102.3 (near average, U.S. average is 100)
Land area: 3.5 sq. mi. Water area: 0.0 sq. mi.
Population density: 7,679 people per square mile
(high).
OSM Map
General Map
Google Map
MSN Map
OSM Map
General Map
Google Map
MSN Map
OSM Map
General Map
Google Map
MSN Map
OSM Map
General Map
Google Map
MSN Map
Please wait while loading the map...
Real estate property taxes paid for housing units in 2022:
This zip code:
0.9% ($2,519)
Georgia:
0.7% ($2,160)
Median real estate property taxes paid for housing units with mortgages in 2022: $2,548 (0.9%) Median real estate property taxes paid for housing units with no mortgage in 2022: $2,453 (1.1%)
Business Search- 14 Million verified businesses
Males: 13,972
(51.5%)
Females: 13,181
(48.5%)
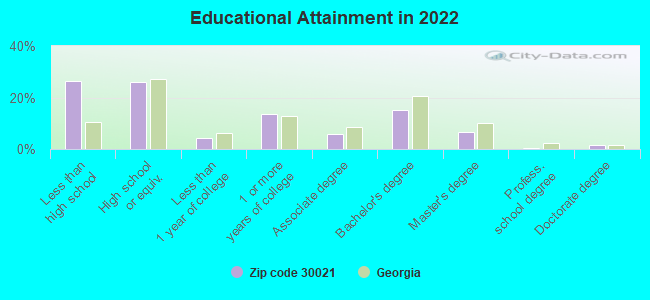
For population 25 years and over in 30021:
High school or higher: 73.0%
Bachelor's degree or higher: 23.8%
Graduate or professional degree: 8.8%
Unemployed: 7.4%
Mean travel time to work (commute): 38.4 minutes
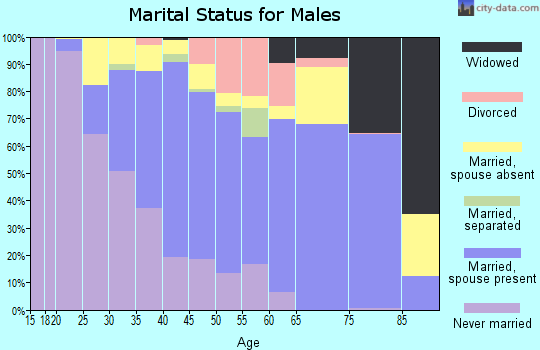
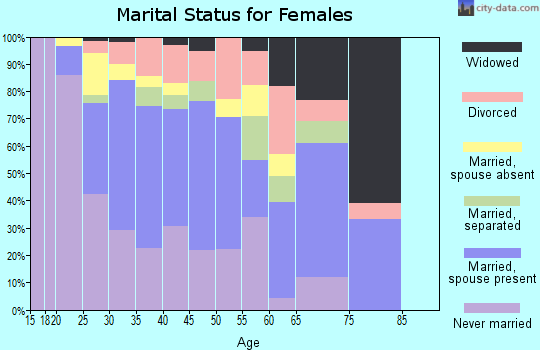
For population 15 years and over in 30021:
Never married: 43.7%
Now married: 44.7%
Separated: 1.9%
Widowed: 3.7%
Divorced: 5.9%
Zip code 30021 compared to state average:
Unemployed percentage above state average.
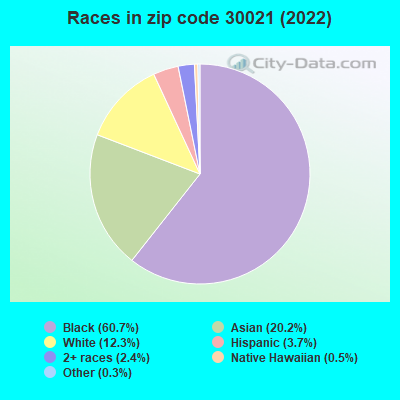
Black race population percentage above state average.
Hispanic race population percentage below state average.
Median age significantly below state average.
Foreign-born population percentage significantly above state average.
Renting percentage above state average.
Length of stay since moving in significantly above state average.
Number of rooms per house below state average.
Number of college students below state average.
Percentage of population with a bachelor's degree or higher below state average.
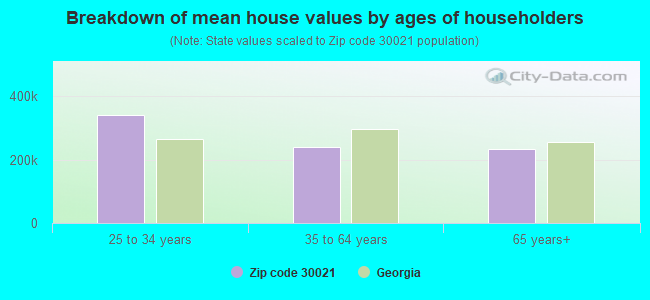
Estimated median house/condo value in 2022: $268,736
30021:
$268,736
Georgia:
$297,400
According to our research of Georgia and other state lists, there were 21 registered sex offenders living in 30021 zip code as of April 26, 2024. The ratio of all residents to sex offenders in zip code 30021 is 1,149 to 1. The ratio of registered sex offenders to all residents in this zip code is much lower than the state average.
Median resident age:
This zip code:
26.0 years
Georgia median age:
37.6 years
Average household size:
This zip code:
3.9 people
Georgia:
2.6 people
Averages for the 2020 tax year for zip code 30021, filed in 2021:
Average Adjusted Gross Income (AGI) in 2020: $32,371 (Individual Income Tax Returns)
Here:
$32,371
State:
$70,847
Salary/wage: $30,159 (reported on 85.9% of returns)
Here:
$30,159
State:
$59,126
(% of AGI for various income ranges: 1205.7% for AGIs below $25k, 3504.8% for AGIs $25k-50k, 6741.5% for AGIs $50k-75k, 11626.8% for AGIs $75k-100k, 16311.2% for AGIs $100k-200k)
Taxable interest for individuals: $560 (reported on 7.9% of returns)
This zip code:
$560
Georgia:
$2,011
(% of AGI for various income ranges: 1.1% for AGIs below $25k, 2.1% for AGIs $25k-50k, 14.5% for AGIs $50k-75k, 34.2% for AGIs $75k-100k, 82.4% for AGIs $100k-200k)
Ordinary dividends: $1,766 (reported on 4.1% of returns)
Here:
$1,766
State:
$8,996
(% of AGI for various income ranges: 2.1% for AGIs below $25k, 4.1% for AGIs $25k-50k, 13.9% for AGIs $50k-75k, 68.4% for AGIs $75k-100k, 185.9% for AGIs $100k-200k)
Net capital gain/loss in AGI: +$5,238 (reported on 4.4% of returns)
Here:
+$5,238
State:
+$28,402
(% of AGI for various income ranges: 2.3% for AGIs below $25k, 6.5% for AGIs $25k-50k, 54.1% for AGIs $50k-75k, 223.7% for AGIs $75k-100k, 774.1% for AGIs $100k-200k)
Profit/loss from business: +$3,509 (reported on 26.6% of returns)
Here:
+$3,509
State:
+$6,707
(% of AGI for various income ranges: 105.2% for AGIs below $25k, 90.7% for AGIs $25k-50k, 155.9% for AGIs $50k-75k, 498.9% for AGIs $75k-100k, 291.8% for AGIs $100k-200k)
Taxable individual retirement arrangement distribution: $10,205 (reported on 1.9% of returns)
30021:
$10,205
Georgia:
$20,525
(% of AGI for various income ranges: 6.0% for AGIs below $25k, 13.7% for AGIs $25k-50k, 33.9% for AGIs $50k-75k, 174.2% for AGIs $75k-100k, 433.5% for AGIs $100k-200k)
Total itemized deductions: $22,581 (reported on 6.9% of returns)
Here:
$22,581
State:
$34,001
(% of AGI for various income ranges: 48.0% for AGIs below $25k, 245.0% for AGIs $25k-50k, 363.2% for AGIs $50k-75k, 706.3% for AGIs $75k-100k, 1270.0% for AGIs $100k-200k)
Charity contributions: $4,242 (reported on 5.3% of returns)
Here:
$4,242
State:
$14,164
(% of AGI for various income ranges: 3.2% for AGIs below $25k, 19.7% for AGIs $25k-50k, 47.3% for AGIs $50k-75k, 190.0% for AGIs $75k-100k, 521.8% for AGIs $100k-200k)
Taxes paid: $7,246 (reported on 6.9% of returns)
30021:
$7,246
State:
$7,540
(% of AGI for various income ranges: 15.7% for AGIs below $25k, 79.9% for AGIs $25k-50k, 113.6% for AGIs $50k-75k, 223.2% for AGIs $75k-100k, 391.8% for AGIs $100k-200k)
Earned income credit: $2,759 (reported on 41.5% of returns)
Here:
$2,759
State:
$2,530
(% of AGI for various income ranges: 168.2% for AGIs below $25k, 156.6% for AGIs $25k-50k, 5.4% for AGIs $50k-75k)
Percentage of individuals using paid preparers for their 2020 taxes: 95.6%
Here:
96%
State:
93%
(% for various income ranges: 95.7% for AGIs below $25k, 95.7% for AGIs $25k-50k, 95.0% for AGIs $50k-75k, 93.8% for AGIs $75k-100k, 96.2% for AGIs $100k-200k, 100.0% for AGIs over 200k)
Averages for the 2012 tax year for zip code 30021, filed in 2013:
Average Adjusted Gross Income (AGI) in 2012: $24,364 (Individual Income Tax Returns)
Here:
$24,364
State:
$56,131
Salary/wage: $23,835 (reported on 90.1% of returns)
Here:
$23,835
State:
$47,942
(% of AGI for various income ranges: 88.4% for AGIs below $25k, 94.0% for AGIs $25k-50k, 85.5% for AGIs $50k-75k, 80.0% for AGIs $75k-100k, 77.6% for AGIs $100k-200k)
Taxable interest for individuals: $648 (reported on 7.8% of returns)
This zip code:
$648
Georgia:
$1,706
(% of AGI for various income ranges: 0.1% for AGIs below $25k, 0.1% for AGIs $25k-50k, 0.1% for AGIs $50k-75k, 0.3% for AGIs $75k-100k, 0.8% for AGIs $100k-200k)
Ordinary dividends: $4,414 (reported on 4.1% of returns)
Here:
$4,414
State:
$7,265
(% of AGI for various income ranges: 0.1% for AGIs below $25k, 0.2% for AGIs $25k-50k, 2.4% for AGIs $50k-75k, 1.6% for AGIs $75k-100k, 2.2% for AGIs $100k-200k)
Net capital gain/loss in AGI: +$152 (reported on 2.2% of returns)
Here:
+$152
State:
+$16,323
(% of AGI for various income ranges: 0.1% for AGIs $75k-100k)
Profit/loss from business: +$4,330 (reported on 21.3% of returns)
Here:
+$4,330
State:
+$7,583
(% of AGI for various income ranges: 7.6% for AGIs below $25k, 1.1% for AGIs $25k-50k, 2.0% for AGIs $50k-75k, 0.8% for AGIs $75k-100k, 0.7% for AGIs $100k-200k)
Taxable individual retirement arrangement distribution: $9,014 (reported on 2.0% of returns)
30021:
$9,014
Georgia:
$17,199
(% of AGI for various income ranges: 0.3% for AGIs below $25k, 0.6% for AGIs $25k-50k, 1.2% for AGIs $50k-75k, 1.1% for AGIs $75k-100k, 2.0% for AGIs $100k-200k)
Total itemized deductions: $15,144 (35% of AGI, reported on 21.0% of returns)
Here:
$15,144
State:
$23,886
Here:
35.1% of AGI
State:
21.5% of AGI
(% of AGI for various income ranges: 11.4% for AGIs below $25k, 13.3% for AGIs $25k-50k, 15.8% for AGIs $50k-75k, 15.7% for AGIs $75k-100k, 13.5% for AGIs $100k-200k)
Charity contributions: $2,777 (reported on 12.9% of returns)
Here:
$2,777
State:
$5,507
(% of AGI for various income ranges: 0.6% for AGIs below $25k, 1.6% for AGIs $25k-50k, 2.5% for AGIs $50k-75k, 2.8% for AGIs $75k-100k, 2.2% for AGIs $100k-200k)
Taxes paid: $2,990 (reported on 20.9% of returns)
30021:
$2,990
State:
$7,838
(% of AGI for various income ranges: 1.2% for AGIs below $25k, 2.3% for AGIs $25k-50k, 4.0% for AGIs $50k-75k, 5.0% for AGIs $75k-100k, 5.5% for AGIs $100k-200k)
Earned income credit: $2,944 (reported on 53.2% of returns)
Here:
$2,944
State:
$2,589
(% of AGI for various income ranges: 13.8% for AGIs below $25k, 2.6% for AGIs $25k-50k)
Percentage of individuals using paid preparers for their 2012 taxes: 72.0%
Here:
72%
State:
55%
(% for various income ranges: 76.3% for AGIs below $25k, 65.9% for AGIs $25k-50k, 54.9% for AGIs $50k-75k, 50.0% for AGIs $75k-100k, 50.0% for AGIs $100k-200k)
Averages for the 2004 tax year for zip code 30021, filed in 2005:
Average Adjusted Gross Income (AGI) in 2004: $23,519 (Individual Income Tax Returns)
Here:
$23,519
State:
$47,553
Salary/wage: $23,840 (reported on 90.9% of returns)
Here:
$23,840
State:
$42,178
(% of AGI for various income ranges: 87.9% for AGIs below $10k, 94.0% for AGIs $10k-25k, 95.2% for AGIs $25k-50k, 90.3% for AGIs $50k-75k, 83.6% for AGIs $75k-100k, 80.1% for AGIs over 100k)
Taxable interest for individuals: $557 (reported on 14.7% of returns)
This zip code:
$557
Georgia:
$1,772
(% of AGI for various income ranges: 0.4% for AGIs below $10k, 0.3% for AGIs $10k-25k, 0.2% for AGIs $25k-50k, 0.7% for AGIs $50k-75k, 0.5% for AGIs $75k-100k, 0.6% for AGIs over 100k)
Taxable dividends: $1,143 (reported on 5.3% of returns)
Here:
$1,143
State:
$4,283
(% of AGI for various income ranges: 0.4% for AGIs below $10k, 0.2% for AGIs $10k-25k, 0.2% for AGIs $25k-50k, 0.5% for AGIs $50k-75k, 0.6% for AGIs $75k-100k, 0.4% for AGIs over 100k)
Net capital gain/loss: +$401 (reported on 3.8% of returns)
Here:
+$401
State:
+$16,461
(% of AGI for various income ranges: -0.4% for AGIs below $10k, 0.1% for AGIs $10k-25k, -0.1% for AGIs $25k-50k, -0.1% for AGIs $50k-75k, 1.1% for AGIs $75k-100k, 0.4% for AGIs over 100k)
Profit/loss from business: +$3,499 (reported on 15.7% of returns)
Here:
+$3,499
State:
+$8,201
(% of AGI for various income ranges: 15.6% for AGIs below $10k, 3.7% for AGIs $10k-25k, 1.0% for AGIs $25k-50k, 0.0% for AGIs $50k-75k, 0.2% for AGIs $75k-100k, 0.3% for AGIs over 100k)
IRA payment deduction: $1,981 (reported on 1.2% of returns)
30021:
$1,981
Georgia:
$2,969
Self-employed pension: $2,538 (reported on 0.1% of returns)
Here:
$2,538
Georgia:
$16,203
Total itemized deductions: $12,772 (32% of AGI, reported on 24.7% of returns)
Here:
$12,772
State:
$19,944
Here:
31.6% of AGI
State:
22.6% of AGI
(% of AGI for various income ranges: 4.8% for AGIs below $10k, 9.3% for AGIs $10k-25k, 15.7% for AGIs $25k-50k, 17.5% for AGIs $50k-75k, 17.3% for AGIs $75k-100k, 13.8% for AGIs over 100k)
Charity contributions deductions: $2,571 (6% of AGI, reported on 22.3% of returns)
Here:
$2,571
State:
$4,354
Here:
6.2% of AGI
State:
4.7% of AGI
(% of AGI for various income ranges: 0.4% for AGIs below $10k, 1.6% for AGIs $10k-25k, 3.0% for AGIs $25k-50k, 3.0% for AGIs $50k-75k, 3.2% for AGIs $75k-100k, 2.9% for AGIs over 100k)
Total tax: $2,534 (reported on 57.1% of returns)
30021:
$2,534
State:
$8,223
(% of AGI for various income ranges: 3.3% for AGIs below $10k, 2.8% for AGIs $10k-25k, 5.4% for AGIs $25k-50k, 9.3% for AGIs $50k-75k, 11.7% for AGIs $75k-100k, 16.8% for AGIs over 100k)
Earned income credit: $2,022 (reported on 43.7% of returns)
Here:
$2,022
State:
$1,986
Percentage of individuals using paid preparers for their 2004 taxes: 66.7%
Here:
67%
State:
62%
(% for various income ranges: 65.9% for AGIs below $10k, 72.3% for AGIs $10k-25k, 63.5% for AGIs $25k-50k, 53.2% for AGIs $50k-75k, 49.0% for AGIs $75k-100k, 40.4% for AGIs over 100k)
Likely homosexual households (counted as self-reported same-sex unmarried-partner households)
Lesbian couples: 0.6% of all households
Gay men: 0.1% of all households
Household received Food Stamps/SNAP in the past 12 months: 2,221 Household did not receive Food Stamps/SNAP in the past 12 months: 4,916
Women who had a birth in the past 12 months: 695 (578 now married, 116 unmarried) Women who did not have a birth in the past 12 months: 5,933 (2,308 now married, 3,626 unmarried)
Housing units in zip code 30021 with a mortgage: 1,150 (72 second mortgage, 66 both second mortgage and home equity loan) Houses without a mortgage: 35
Median monthly owner costs for units with a mortgage: $1,407 Median monthly owner costs for units without a mortgage: $494
Residents with income below the poverty level in 2022:
This zip code:
24.6%
Whole state:
12.7%
Residents with income below 50% of the poverty level in 2022:
This zip code:
17.5%
Whole state:
6.3%
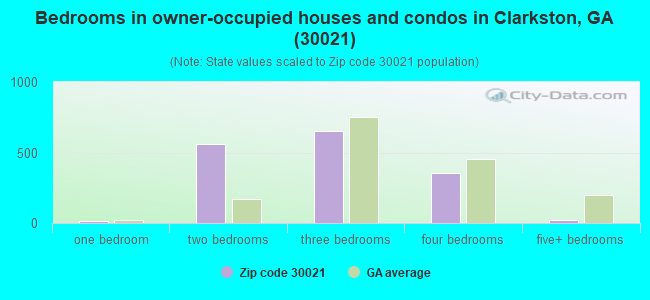
Median number of rooms in houses and condos:
Here:
6.0
State:
6.8
Median number of rooms in apartments:
Here:
4.8
State:
4.6
Notable locations in this zip code not listed on our city pages
Notable locations in zip code 30021: DeKalb County Fire and Rescue Department Station 32 (A), Clarkston Police Station (B), Clarkston City Hall (C). Display/hide their locations on the map
Shopping Centers: Clarkston Plaza Shopping Center (1), Clarkston Village Shopping Center (2), Tahoe Village Shopping Center (3). Display/hide their locations on the map
6,129 married couples with children.
2,812 single-parent households (612 men, 2,200 women).
40.9% of residents of 30021 zip code speak English at home.
3.8% of residents speak Spanish at home (91% very well, 4% well, 5% not well).
13.4% of residents speak other Indo-European language at home (34% very well, 24% well, 26% not well, 16% not at all).
10.5% of residents speak Asian or Pacific Island language at home (38% very well, 24% well, 25% not well, 13% not at all).
31.7% of residents speak other language at home (62% very well, 21% well, 15% not well, 2% not at all).
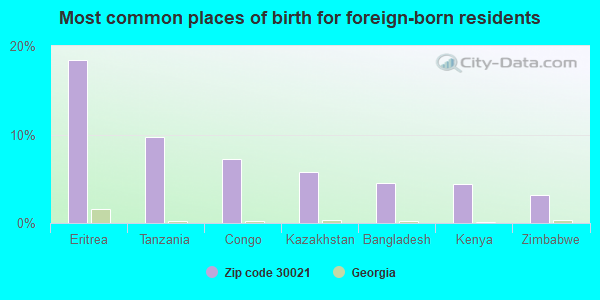
Foreign born population: 12,327 (45.4%) (28.3% of them are naturalized citizens)
This zip code:
45.4%
Whole state:
10.7%
18%Eritrea
10%Tanzania
7%Congo
6%Kazakhstan
4%Bangladesh
4%Kenya
3%Zimbabwe
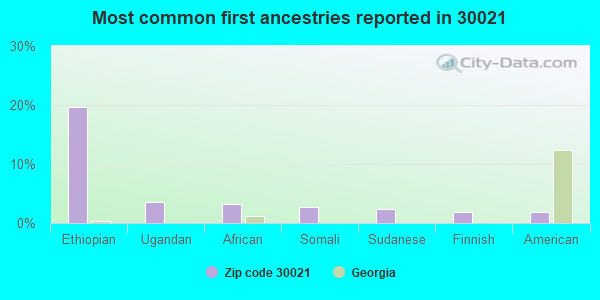
20%Ethiopian
4%Ugandan
3%African
3%Somali
2%Sudanese
2%Finnish
2%American
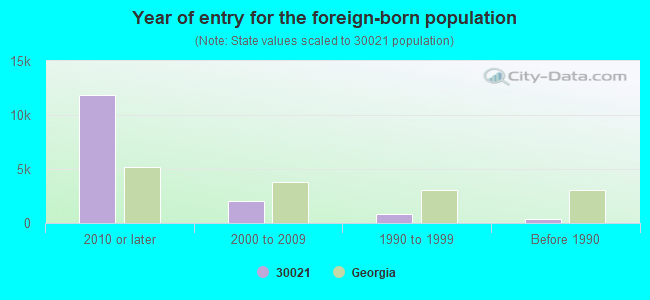
Year of entry for the foreign-born population
11,8652010 or later
1,9972000 to 2009
8711990 to 1999
393Before 1990
Major facilities with environmental interests located in this zip code:
BST ATLNGAIC01 F1206 (467 N INDIAN CREEK RD in CLARKSTON, GA)
STATE MASTER (Georgia's Geographic Environmental Information) - UST-1, UNDERGROUND STORAGE TANK PROGRAM, UST-2, (Resource Conservation and Recovery Act (tracking hazardous waste)) Organizations: OPERNAME (CONTACT/OPERATOR)
, BELLSOUTH TELECOMMUNICATIONS (CONTACT/OPERATOR)
, U S CONTRACTING (INSTALLER)
Alternative names: BST/INDIAN CREEK/F1206
AMOCO FOOD SHOP (4556 E PONCE DE LEON AV in CLARKSTON, GA)
STATE MASTER (Georgia's Geographic Environmental Information) - UST-2, UNDERGROUND STORAGE TANK PROGRAM, UST-3, UST-1, (Resource Conservation and Recovery Act (tracking hazardous waste)) Organizations: MANSOORALI KARIMI (CONTACT/OWNER)
Alternative names: CLARKSTON AMOCO
CLARKSTON HIGH SCHOOL (618 NORTH INDIAN CREEK DRIVE in CLARKSTON, GA)
(Geographic Names Information System) (National Center for Education Statistics) - STATE ID-4053 Organizations: DEKALB COUNTY (SCHOOL DISTRICT)
JOLLY ELEMENTARY SCHOOL (1070 OTELLO AVENUE in CLARKSTON, GA)
(National Center for Education Statistics) - STATE ID-3059 Organizations: DEKALB COUNTY (SCHOOL DISTRICT)
ADT 25 (815 PARK NORTH BLVD in CLARKSTON, GA)
(Integrated Compliance Information System) - ICIS-HQ-2002-6000, FORMAL ENFORCEMENT ACTION
CABINETRY MADE SIMPLE (799 PARK NORTH BLVD in CLARKSTON, GA)
Large Quantity Generators, more that 1000 kg of hazardous waste/month (Resource Conservation and Recovery Act (tracking hazardous waste)) Organizations: CABINETRY MADE SIMPLE INC (CONTACT/OPERATOR)
, JOHN POSSCHL (CONTACT/OWNER)
PARTNERS DRY CLEANERS (1303 BROCKETT RD in CLARKSTON, GA)
(Resource Conservation and Recovery Act (tracking hazardous waste)) Organizations: OPERNAME (CONTACT/OPERATOR)
, X (CONTACT/OWNER)
MOUNTAIN SOUTH INNOVATIONS (3519-G CHURCH STREET in CLARKSTON, GA)
PARSONS & WHITTEMORE ENG (735 PARK NORTH BLVD SUITE 130 in CLARKSTON, GA)
(Resource Conservation and Recovery Act (tracking hazardous waste))
REVOLUTIONS ENVIRONMENTAL INC (3529E CHURCH ST in CLARKSTON, GA)
USED OIL PROGRAM (Resource Conservation and Recovery Act (tracking hazardous waste)) Organizations: MICHAEL HERZOG (CONTACT/OPERATOR)
, PATTILLO CONSTRUCTION COMPANY (CONTACT/OWNER)
LANCE ENGINEERING INC (4007-B CHURCH ST in CLARKSTON, GA)
(Resource Conservation and Recovery Act (tracking hazardous waste)) Organizations: CHRIS HULEN (CONTACT/OWNER)
MAJOR BRAND INCORPORATED (3550 EAST CLARKSTON INDUSTRIAL BOULEVARD in CLARKSTON, GA)
COMPLIANCE ACTIVITY (Tracking inspections of insecticide, fungicide, and rodenticide, and toxic substances) Alternative names: MAJOR BRANDS INC
CERADYNE INC (696 PARK NORTH BLVD,SUITE 100 in CLARKSTON, GA)
AIR MINOR (AIRS/AFS) Business SIC classification: NONCLAY REFRACTORIES Alternative names: CERADYNE INC CRUCIBLE PLT
Housing units lacking complete plumbing facilities: 0.2% Housing units lacking complete kitchen facilities: 1.5%
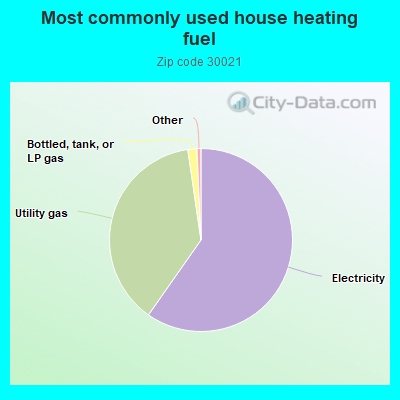
59.8%Electricity
38.0%Utility gas
1.6%Bottled, tank, or LP gas
Population in 1990: 17,325. Population change in the 1990s: +7,049 (+40.7%).
Place of birth for U.S.-born residents:
This state: 8,999
Northeast: 840
Midwest: 1,110
South: 2,651
West: 196
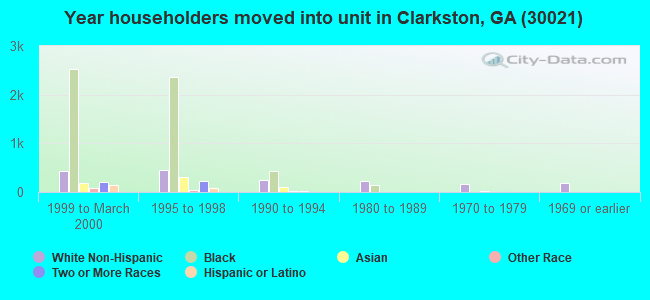
29% of the 30021 zip code residents lived in the same house 5 years ago. Out of people who lived in different houses, 44% lived in this county. Out of people who lived in different counties, 50% lived in Georgia.
83% of the 30021 zip code residents lived in the same house 1 year ago. Out of people who lived in different houses, 52% moved from this county. Out of people who lived in different houses, 16% moved from different county within same state. Out of people who lived in different houses, 12% moved from different state. Out of people who lived in different houses, 19% moved from abroad.
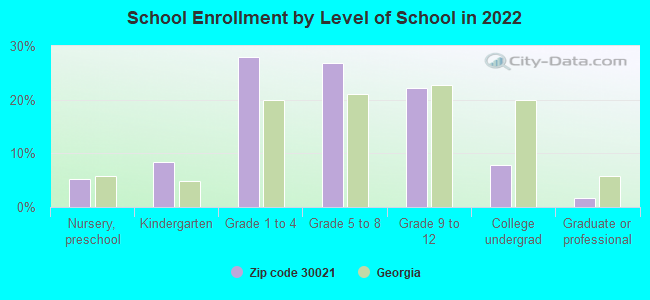
Private vs. public school enrollment:
Students in private schools in grades 1 to 8 (elementary and middle school): 396
Here:
8.2%
Georgia:
12.1%
Students in private schools in grades 9 to 12 (high school): 50
Here:
2.6%
Georgia:
10.8%
Students in private undergraduate colleges: 39
Here:
5.6%
Georgia:
17.1%
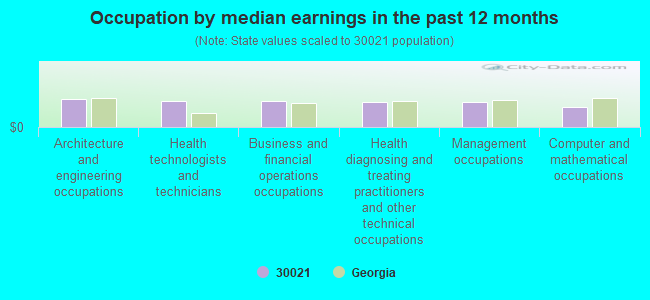
Occupation by median earnings in the past 12 months ($)
82,890Architecture and engineering occupations
76,743Health technologists and technicians
76,139Business and financial operations occupations
75,173Health diagnosing and treating practitioners and other technical occupations
74,832Management occupations
58,768Computer and mathematical occupations
Top industries in this zip code by the number of employees in 2005:
Administrative and Support and Waste Management and Remediation Services: Security Guards and Patrol Services (100-249 employees: 1 establishment, 10-19 employees: 1 establishment)
Information: Data Processing, Hosting, and Related Services (100-249: 1, 1-4: 1)
Management of Companies and Enterprises: Corporate, Subsidiary, and Regional Managing Offices (100-249: 1)
Accommodation and Food Services: Drinking Places (Alcoholic Beverages) (50-99: 1)
Arts, Entertainment, and Recreation: Golf Courses and Country Clubs (50-99: 1)
2002 - 2018 National Fire Incident Reporting System (NFIRS) incidents
Based on the data from the years 2002 - 2018 the average number of fire incidents per year is 95. The highest number of reported fire incidents - 146 took place in 2010, and the least - 0 in 2004. The data has a decreasing trend.
When looking into fire subcategories, the most incidents belonged to: Structure Fires (43.4%), and Outside Fires (33.8%).
Fire incident types reported to NFIRS in Zip Code 30021

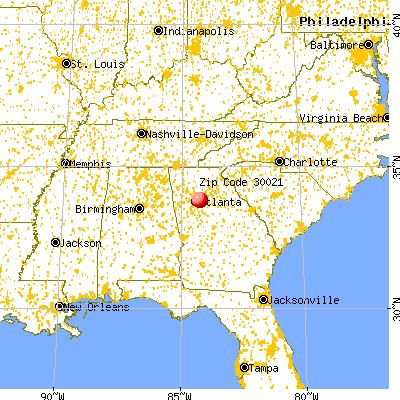


 Nearest zip codes: 30079, 30072, 30083, 30002, 30033, 30084.


 Based on the data from the years 2002 - 2018 the average number of fire incidents per year is 95. The highest number of reported fire incidents - 146 took place in 2010, and the least - 0 in 2004. The data has a decreasing trend.
 When looking into fire subcategories, the most incidents belonged to: Structure Fires (43.4%), and Outside Fires (33.8%).