Estimated zip code population in 2022: 43,364 Zip code population in 2010: 43,113 Zip code population in 2000: 44,917
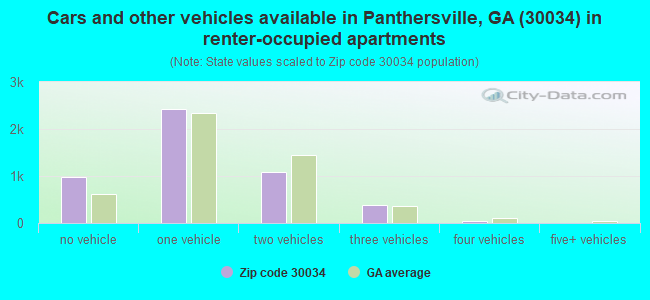
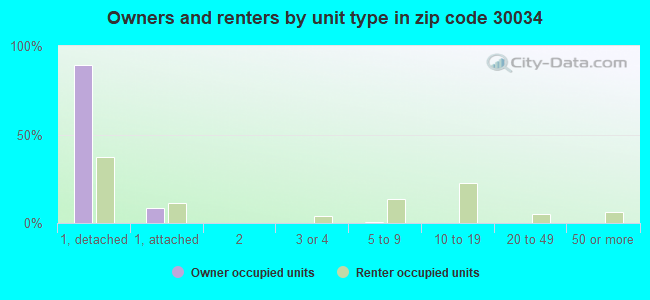
Houses and condos: 20,588 Renter-occupied apartments: 4,950
% of renters here:
29%
State:
34%
March 2022 cost of living index in zip code 30034: 101.0 (near average, U.S. average is 100)
Land area: 17.0 sq. mi. Water area: 0.2 sq. mi.
Population density: 2,558 people per square mile
(average).
OSM Map
General Map
Google Map
MSN Map
OSM Map
General Map
Google Map
MSN Map
OSM Map
General Map
Google Map
MSN Map
OSM Map
General Map
Google Map
MSN Map
Please wait while loading the map...
Real estate property taxes paid for housing units in 2022:
This zip code:
0.8% ($1,806)
Georgia:
0.7% ($2,160)
Median real estate property taxes paid for housing units with mortgages in 2022: $1,877 (0.8%) Median real estate property taxes paid for housing units with no mortgage in 2022: $1,516 (0.6%)
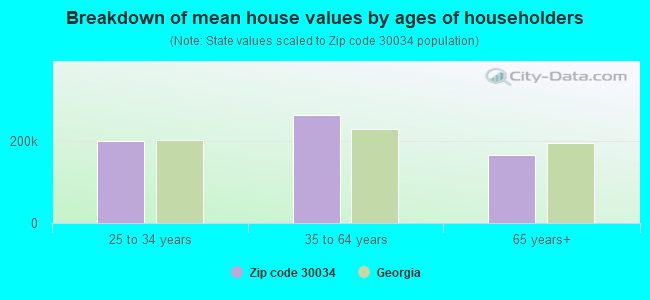
Estimated median house/condo value in 2022: $235,235
30034:
$235,235
Georgia:
$297,400
According to our research of Georgia and other state lists, there were 130 registered sex offenders living in 30034 zip code as of April 27, 2024. The ratio of all residents to sex offenders in zip code 30034 is 345 to 1. The ratio of registered sex offenders to all residents in this zip code is near the state average.
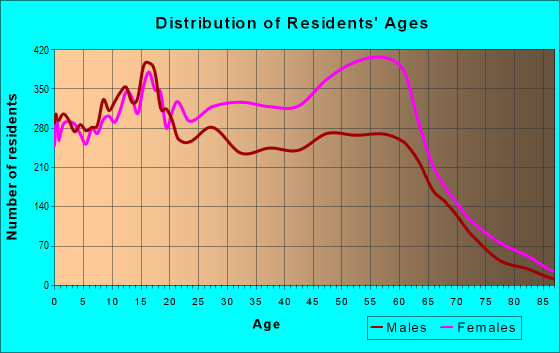
Median resident age:
This zip code:
45.1 years
Georgia median age:
37.6 years
Average household size:
This zip code:
2.5 people
Georgia:
2.6 people
Averages for the 2020 tax year for zip code 30034, filed in 2021:
Average Adjusted Gross Income (AGI) in 2020: $38,684 (Individual Income Tax Returns)
Here:
$38,684
State:
$70,847
Salary/wage: $35,391 (reported on 82.6% of returns)
Here:
$35,391
State:
$59,126
(% of AGI for various income ranges: 1176.3% for AGIs below $25k, 3734.3% for AGIs $25k-50k, 7310.5% for AGIs $50k-75k, 11328.8% for AGIs $75k-100k, 19819.3% for AGIs $100k-200k, 74852.5% for AGIs over 200k)
Taxable interest for individuals: $536 (reported on 11.6% of returns)
This zip code:
$536
Georgia:
$2,011
(% of AGI for various income ranges: 2.8% for AGIs below $25k, 3.9% for AGIs $25k-50k, 11.3% for AGIs $50k-75k, 25.1% for AGIs $75k-100k, 60.9% for AGIs $100k-200k, 600.0% for AGIs over 200k)
Ordinary dividends: $1,587 (reported on 5.9% of returns)
Here:
$1,587
State:
$8,996
(% of AGI for various income ranges: 2.3% for AGIs below $25k, 5.6% for AGIs $25k-50k, 15.9% for AGIs $50k-75k, 46.7% for AGIs $75k-100k, 96.8% for AGIs $100k-200k, 1115.0% for AGIs over 200k)
Net capital gain/loss in AGI: +$4,732 (reported on 4.8% of returns)
Here:
+$4,732
State:
+$28,402
(% of AGI for various income ranges: 1.9% for AGIs below $25k, 3.8% for AGIs $25k-50k, 12.0% for AGIs $50k-75k, 96.3% for AGIs $75k-100k, 352.9% for AGIs $100k-200k, 5082.5% for AGIs over 200k)
Taxable individual retirement arrangement distribution: $13,153 (reported on 4.4% of returns)
30034:
$13,153
Georgia:
$20,525
(% of AGI for various income ranges: 16.7% for AGIs below $25k, 41.2% for AGIs $25k-50k, 136.1% for AGIs $50k-75k, 314.5% for AGIs $75k-100k, 840.9% for AGIs $100k-200k)
Total itemized deductions: $24,346 (reported on 9.7% of returns)
Here:
$24,346
State:
$34,001
(% of AGI for various income ranges: 30.0% for AGIs below $25k, 209.7% for AGIs $25k-50k, 689.6% for AGIs $50k-75k, 1295.3% for AGIs $75k-100k, 2513.0% for AGIs $100k-200k, 8975.0% for AGIs over 200k)
Charity contributions: $9,503 (reported on 8.7% of returns)
Here:
$9,503
State:
$14,164
(% of AGI for various income ranges: 6.8% for AGIs below $25k, 58.6% for AGIs $25k-50k, 225.8% for AGIs $50k-75k, 465.2% for AGIs $75k-100k, 1090.9% for AGIs $100k-200k, 3275.0% for AGIs over 200k)
Taxes paid: $5,765 (reported on 9.6% of returns)
30034:
$5,765
State:
$7,540
(% of AGI for various income ranges: 5.5% for AGIs below $25k, 39.6% for AGIs $25k-50k, 165.8% for AGIs $50k-75k, 342.1% for AGIs $75k-100k, 662.1% for AGIs $100k-200k, 1737.5% for AGIs over 200k)
Earned income credit: $2,603 (reported on 31.5% of returns)
Here:
$2,603
State:
$2,530
(% of AGI for various income ranges: 155.5% for AGIs below $25k, 99.3% for AGIs $25k-50k)
Percentage of individuals using paid preparers for their 2020 taxes: 89.9%
Here:
90%
State:
93%
(% for various income ranges: 91.2% for AGIs below $25k, 89.9% for AGIs $25k-50k, 88.2% for AGIs $50k-75k, 87.5% for AGIs $75k-100k, 85.6% for AGIs $100k-200k, 92.3% for AGIs over 200k)
Averages for the 2012 tax year for zip code 30034, filed in 2013:
Average Adjusted Gross Income (AGI) in 2012: $33,956 (Individual Income Tax Returns)
Here:
$33,956
State:
$56,131
Salary/wage: $31,913 (reported on 85.3% of returns)
Here:
$31,913
State:
$47,942
(% of AGI for various income ranges: 82.4% for AGIs below $25k, 87.1% for AGIs $25k-50k, 79.3% for AGIs $50k-75k, 73.2% for AGIs $75k-100k, 72.9% for AGIs $100k-200k, 72.2% for AGIs over 200k)
Taxable interest for individuals: $499 (reported on 13.2% of returns)
This zip code:
$499
Georgia:
$1,706
(% of AGI for various income ranges: 0.3% for AGIs below $25k, 0.2% for AGIs $25k-50k, 0.2% for AGIs $50k-75k, 0.2% for AGIs $75k-100k, 0.2% for AGIs $100k-200k, 0.2% for AGIs over 200k)
Ordinary dividends: $1,609 (reported on 6.6% of returns)
Here:
$1,609
State:
$7,265
(% of AGI for various income ranges: 0.5% for AGIs below $25k, 0.2% for AGIs $25k-50k, 0.2% for AGIs $50k-75k, 0.4% for AGIs $75k-100k, 0.4% for AGIs $100k-200k, 0.3% for AGIs over 200k)
Net capital gain/loss in AGI: +$41 (reported on 3.4% of returns)
Here:
+$41
State:
+$16,323
(% of AGI for various income ranges: 0.1% for AGIs $100k-200k)
Profit/loss from business: +$379 (reported on 24.9% of returns)
Here:
+$379
State:
+$7,583
(% of AGI for various income ranges: 5.6% for AGIs below $25k, 0.3% for AGIs $100k-200k, 0.6% for AGIs over 200k)
Taxable individual retirement arrangement distribution: $13,146 (reported on 4.8% of returns)
30034:
$13,146
Georgia:
$17,199
(% of AGI for various income ranges: 1.1% for AGIs below $25k, 1.3% for AGIs $25k-50k, 1.8% for AGIs $50k-75k, 2.6% for AGIs $75k-100k, 2.8% for AGIs $100k-200k, 4.6% for AGIs over 200k)
Self-employment retirement plans: $8,600 (reported on 0.1% of returns)
30034:
$8,600
Georgia:
$23,277
Total itemized deductions: $17,685 (30% of AGI, reported on 33.9% of returns)
Here:
$17,685
State:
$23,886
Here:
30.2% of AGI
State:
21.5% of AGI
(% of AGI for various income ranges: 9.1% for AGIs below $25k, 19.4% for AGIs $25k-50k, 21.6% for AGIs $50k-75k, 19.8% for AGIs $75k-100k, 19.3% for AGIs $100k-200k, 15.0% for AGIs over 200k)
Charity contributions: $5,005 (reported on 30.8% of returns)
Here:
$5,005
State:
$5,507
(% of AGI for various income ranges: 1.8% for AGIs below $25k, 4.4% for AGIs $25k-50k, 5.5% for AGIs $50k-75k, 5.6% for AGIs $75k-100k, 6.3% for AGIs $100k-200k, 5.2% for AGIs over 200k)
Taxes paid: $3,898 (reported on 33.7% of returns)
30034:
$3,898
State:
$7,838
(% of AGI for various income ranges: 1.2% for AGIs below $25k, 3.5% for AGIs $25k-50k, 4.7% for AGIs $50k-75k, 4.9% for AGIs $75k-100k, 5.7% for AGIs $100k-200k, 5.6% for AGIs over 200k)
Earned income credit: $2,662 (reported on 37.1% of returns)
Here:
$2,662
State:
$2,589
(% of AGI for various income ranges: 12.3% for AGIs below $25k, 1.4% for AGIs $25k-50k)
Percentage of individuals using paid preparers for their 2012 taxes: 51.6%
Here:
52%
State:
55%
(% for various income ranges: 50.9% for AGIs below $25k, 51.6% for AGIs $25k-50k, 52.3% for AGIs $50k-75k, 53.3% for AGIs $75k-100k, 55.6% for AGIs $100k-200k, 55.6% for AGIs over 200k)
Averages for the 2004 tax year for zip code 30034, filed in 2005:
Average Adjusted Gross Income (AGI) in 2004: $34,475 (Individual Income Tax Returns)
Here:
$34,475
State:
$47,553
Salary/wage: $33,553 (reported on 91.1% of returns)
Here:
$33,553
State:
$42,178
(% of AGI for various income ranges: 100.4% for AGIs below $10k, 91.4% for AGIs $10k-25k, 92.4% for AGIs $25k-50k, 87.1% for AGIs $50k-75k, 85.6% for AGIs $75k-100k, 81.5% for AGIs over 100k)
Taxable interest for individuals: $548 (reported on 22.5% of returns)
This zip code:
$548
Georgia:
$1,772
(% of AGI for various income ranges: 1.1% for AGIs below $10k, 0.4% for AGIs $10k-25k, 0.2% for AGIs $25k-50k, 0.4% for AGIs $50k-75k, 0.3% for AGIs $75k-100k, 0.5% for AGIs over 100k)
Taxable dividends: $757 (reported on 9.6% of returns)
Here:
$757
State:
$4,283
(% of AGI for various income ranges: 0.4% for AGIs below $10k, 0.2% for AGIs $10k-25k, 0.1% for AGIs $25k-50k, 0.2% for AGIs $50k-75k, 0.2% for AGIs $75k-100k, 0.5% for AGIs over 100k)
Net capital gain/loss: +$3,438 (reported on 6.2% of returns)
Here:
+$3,438
State:
+$16,461
(% of AGI for various income ranges: 0.1% for AGIs below $10k, 0.1% for AGIs $10k-25k, 0.0% for AGIs $25k-50k, 0.2% for AGIs $50k-75k, 0.7% for AGIs $75k-100k, 2.7% for AGIs over 100k)
IRA payment deduction: $1,975 (reported on 1.5% of returns)
30034:
$1,975
Georgia:
$2,969
(% of AGI for various income ranges: 0.2% for AGIs below $10k, 0.1% for AGIs $10k-25k, 0.1% for AGIs $25k-50k, 0.1% for AGIs $50k-75k, 0.1% for AGIs $75k-100k, 0.1% for AGIs over 100k)
Self-employed pension: $8,367 (reported on 0.2% of returns)
Here:
$8,367
Georgia:
$16,203
Total itemized deductions: $17,321 (33% of AGI, reported on 46.2% of returns)
Here:
$17,321
State:
$19,944
Here:
32.6% of AGI
State:
22.6% of AGI
(% of AGI for various income ranges: 16.3% for AGIs below $10k, 15.3% for AGIs $10k-25k, 25.3% for AGIs $25k-50k, 27.6% for AGIs $50k-75k, 23.9% for AGIs $75k-100k, 21.1% for AGIs over 100k)
Charity contributions deductions: $4,471 (8% of AGI, reported on 43.5% of returns)
Here:
$4,471
State:
$4,354
Here:
8.2% of AGI
State:
4.7% of AGI
(% of AGI for various income ranges: 1.8% for AGIs below $10k, 2.8% for AGIs $10k-25k, 5.7% for AGIs $25k-50k, 7.0% for AGIs $50k-75k, 6.2% for AGIs $75k-100k, 6.5% for AGIs over 100k)
Total tax: $3,867 (reported on 65.0% of returns)
30034:
$3,867
State:
$8,223
(% of AGI for various income ranges: 3.1% for AGIs below $10k, 2.6% for AGIs $10k-25k, 5.1% for AGIs $25k-50k, 8.1% for AGIs $50k-75k, 9.5% for AGIs $75k-100k, 13.6% for AGIs over 100k)
Earned income credit: $1,985 (reported on 30.2% of returns)
Here:
$1,985
State:
$1,986
Percentage of individuals using paid preparers for their 2004 taxes: 57.7%
Here:
58%
State:
62%
(% for various income ranges: 51.7% for AGIs below $10k, 63.8% for AGIs $10k-25k, 56.3% for AGIs $25k-50k, 57.4% for AGIs $50k-75k, 55.2% for AGIs $75k-100k, 55.7% for AGIs over 100k)
Likely homosexual households (counted as self-reported same-sex unmarried-partner households)
Lesbian couples: 0.2% of all households
Gay men: 0.0% of all households
Household received Food Stamps/SNAP in the past 12 months: 3,752 Household did not receive Food Stamps/SNAP in the past 12 months: 13,443
Women who had a birth in the past 12 months: 388 (247 now married, 141 unmarried) Women who did not have a birth in the past 12 months: 8,502 (1,879 now married, 6,638 unmarried)
Housing units in zip code 30034 with a mortgage: 8,506 (1,157 second mortgage, 26 home equity loan, 503 both second mortgage and home equity loan) Houses without a mortgage: 174
Median monthly owner costs for units with a mortgage: $1,341 Median monthly owner costs for units without a mortgage: $568
Residents with income below the poverty level in 2022:
This zip code:
12.6%
Whole state:
12.7%
Residents with income below 50% of the poverty level in 2022:
This zip code:
7.9%
Whole state:
6.3%
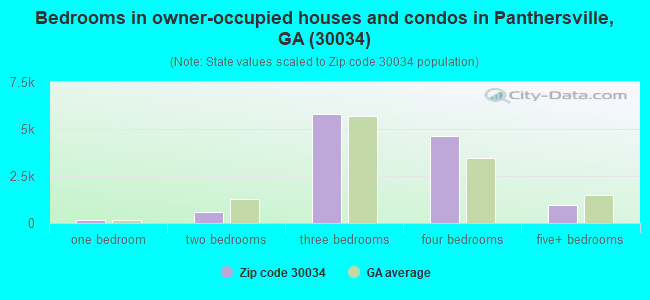
Median number of rooms in houses and condos:
Here:
7.4
State:
6.8
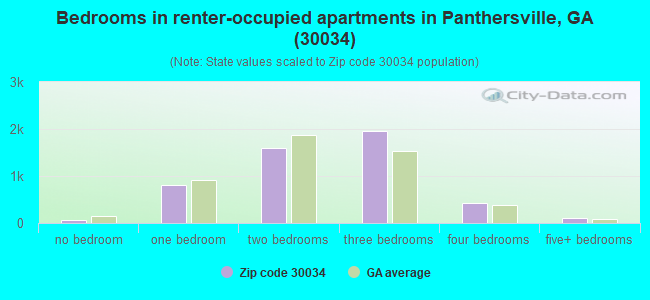
Median number of rooms in apartments:
Here:
4.9
State:
4.6
Notable locations in this zip code not listed on our city pages
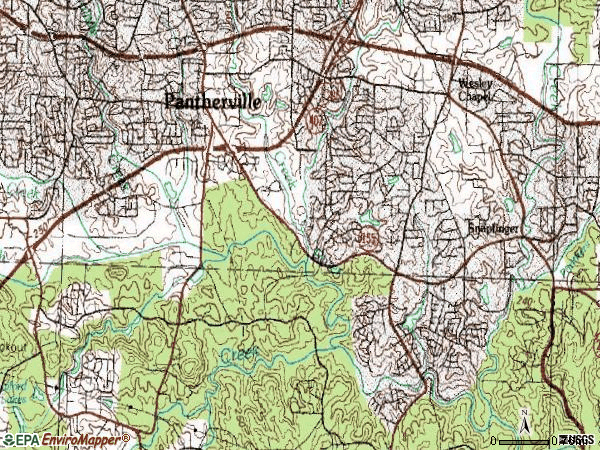
Notable locations in zip code 30034: DeKalb Youth Camp (A), Clifton Springs Golf Course (B), Dekalb County Sewage Plant (C), Dekalb County Fire Academy (D), Georgia Bureau of Investigation Headquarters (E), DeKalb County Fire and Rescue Department Station 20 (F), DeKalb County South Precinct Police Station (G), DeKalb County Fire and Rescue Department Station 16 (H). Display/hide their locations on the map
Shopping Centers: Five Points Shopping Center (1), Sunshine Shopping Center (2), South DeKalb Mall Shopping Center (3), Rainbow Village Shopping Center (4), Chapel Square Shopping Center (5). Display/hide their locations on the map
Churches in zip code 30034 include: Clifton Church (A), Kelleys Chapel (B), Oak Grove Church (C), Wesley Chapel (D). Display/hide their locations on the map
Parks in zip code 30034 include: Chapel Park (1), Summergate Park (2), Exchange Park (3), Panthersville Regional Athletic Center (4), Panthersville Stadium (5). Display/hide their locations on the map
2,141 married couples with children.
3,299 single-parent households (686 men, 2,613 women).
93.5% of residents of 30034 zip code speak English at home.
1.9% of residents speak Spanish at home (50% very well, 27% well, 19% not well, 4% not at all).
1.3% of residents speak other Indo-European language at home (55% very well, 20% well, 16% not well, 9% not at all).
3.5% of residents speak other language at home (83% very well, 11% well, 5% not well).
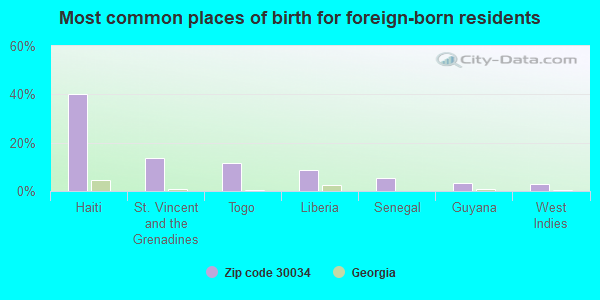
Foreign born population: 4,359 (10.1%) (76.2% of them are naturalized citizens)
This zip code:
10.1%
Whole state:
10.7%
40%Haiti
14%St. Vincent and the Grenadines
12%Togo
9%Liberia
5%Senegal
3%Guyana
3%West Indies
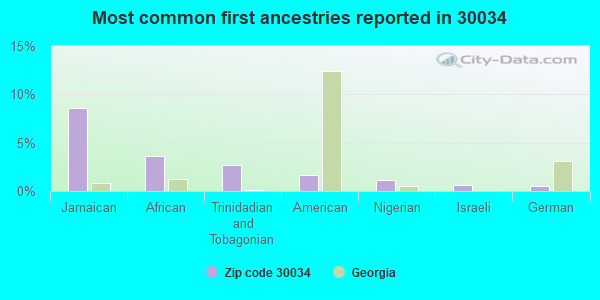
9%Jamaican
4%African
3%Trinidadian and Tobagonian
2%American
1%Nigerian
1%Israeli
1%German
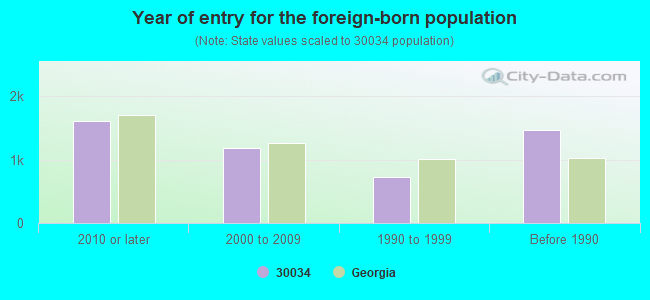
Year of entry for the foreign-born population
1,6102010 or later
1,1852000 to 2009
7261990 to 1999
1,475Before 1990
Major facilities with environmental interests located in this zip code:
CIRCLE K # 8460 (3521 FLAT SHOALS RD in DECATUR, GA)
STATE MASTER (Georgia's Geographic Environmental Information) - UST-1, UNDERGROUND STORAGE TANK PROGRAM, UST-2, UST-3, Conditionally Exempt Small Quantity Generators, less than 100 kg/month of hazardous waste (Resource Conservation and Recovery Act (tracking hazardous waste)) - notification Organizations: ATC ASSOCIATES INC (CONTACT/AGENT)
, CIRCLE K STORES INC (CONTACT/OPERATOR)
, APEC (INSTALLER)
ACA AMOCO #326 (2722 CANDLER ROAD in DECATUR, GA)
STATE MASTER (Georgia's Geographic Environmental Information) - UST-1, UNDERGROUND STORAGE TANK PROGRAM, UST-10, UST-11, UST-3, UST-4, UST-6, UST-7, UST-9, UST-8, UST-2, UST-5, Small Quantity Generators, between 100 kg and 1000 kg of hazardous waste/month (Resource Conservation and Recovery Act (tracking hazardous waste)) - notification Organizations: HANDEX OF FLORIDA (CONTACT/AGENT)
, BP PRODUCTS NORTH AMERICA INC (CONTACT/OPERATOR)
, ACA MANAGEMENT SERVICES (CONTACT/OWNER)
, AMOCO OIL COMPANY (INSTALLER)
Alternative names: BP/AMOCO #910, BP/AMOCO #910
BOB MATHIS ELEMENTARY SCHOOL (3505 BORING ROAD in DECATUR, GA)
(Geographic Names Information System) (National Center for Education Statistics) - STATE ID-0475 Organizations: DEKALB COUNTY (SCHOOL DISTRICT)
CHAPEL HILL ELEMENTARY SCHOOL (3536 RADCLIFF BOULEVARD in DECATUR, GA)
(Geographic Names Information System) (National Center for Education Statistics) - STATE ID-1053 Organizations: DEKALB COUNTY (SCHOOL DISTRICT)
RAINBOW ELEMENTARY SCHOOL (2801 KELLEY CHAPEL ROAD in DECATUR, GA)
(Geographic Names Information System) (National Center for Education Statistics) - STATE ID-4064 Organizations: DEKALB COUNTY (SCHOOL DISTRICT)
CEDAR GROVE MIDDLE SCHOOL (2300 WILDCAT ROAD in DECATUR, GA)
(National Center for Education Statistics) - STATE ID-0200 Organizations: DEKALB COUNTY (SCHOOL DISTRICT)
CHAPEL HILL MIDDLE SCHOOL (3535 DOGWOOD FARM ROAD in DECATUR, GA)
(National Center for Education Statistics) - STATE ID-0193 Organizations: DEKALB COUNTY (SCHOOL DISTRICT)
NARVIE HARRIS ELEMENTARY SCHOOL (3981 MCGILL DRIVE in DECATUR, GA)
(National Center for Education Statistics) - STATE ID-0100 Organizations: DEKALB COUNTY (SCHOOL DISTRICT)
CATHEDRAL ACADEMY (4645 FLAT SHOALS PARKWAY in DECATUR, GA)
HAZARDOUS WASTE BIENNIAL REPORTER (Resource Conservation and Recovery Act (tracking hazardous waste)) (Resource Conservation and Recovery Act (tracking hazardous waste)) Organizations: CHAPEL HILL HARVESTER CHURCH INC (CONTACT/OWNER)
ONE HOUR MARLENE CLEANERS (3796 FLAT SHOALS RD in DECATUR, GA)
(Resource Conservation and Recovery Act (tracking hazardous waste)) Organizations: OPERNAME (CONTACT/OPERATOR)
, SILVA MARLENE PARK JAMES (CONTACT/OWNER)
LASSITER PROPERTIES INC (3000 RIVER RD in DECATUR, GA)
(Resource Conservation and Recovery Act (tracking hazardous waste)) Business NAICS classification: NEW SINGLE-FAMILY HOUSING CONSTRUCTION (EXCEPT OPERATIVE BUILDERS).
BIG 10 TIRE STORE/TREASURE ISLAN (4380 MEMORIAL DR in DECATUR, GA)
(Resource Conservation and Recovery Act (tracking hazardous waste)) Organizations: OPERNAME (CONTACT/OPERATOR)
Alternative names: THE HOME DEPOT #101
BP OIL CO (2645 WESLEY CHAPEL ROAD in DECATUR, GA)
(Resource Conservation and Recovery Act (tracking hazardous waste))
Housing units lacking complete plumbing facilities: 0.8% Housing units lacking complete kitchen facilities: 1.0%
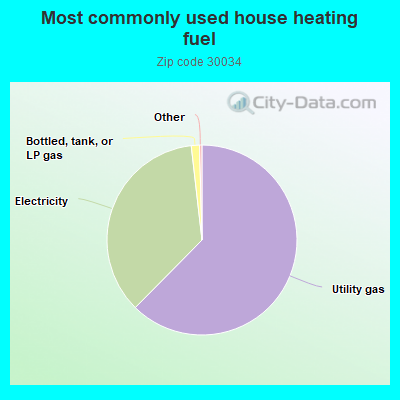
62.4%Utility gas
35.8%Electricity
1.4%Bottled, tank, or LP gas
Population in 1990: 32,312. Population change in the 1990s: +12,605 (+39.0%).
Place of birth for U.S.-born residents:
This state: 23,703
Northeast: 3,734
Midwest: 2,389
South: 7,547
West: 881
56% of the 30034 zip code residents lived in the same house 5 years ago. Out of people who lived in different houses, 50% lived in this county. Out of people who lived in different counties, 50% lived in Georgia.
90% of the 30034 zip code residents lived in the same house 1 year ago. Out of people who lived in different houses, 43% moved from this county. Out of people who lived in different houses, 31% moved from different county within same state. Out of people who lived in different houses, 20% moved from different state. Out of people who lived in different houses, 5% moved from abroad.
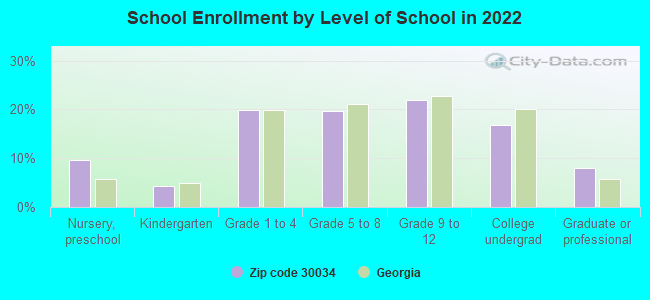
Private vs. public school enrollment:
Students in private schools in grades 1 to 8 (elementary and middle school): 357
Here:
9.5%
Georgia:
12.1%
Students in private schools in grades 9 to 12 (high school): 142
Here:
6.8%
Georgia:
10.8%
Students in private undergraduate colleges: 501
Here:
31.3%
Georgia:
17.1%
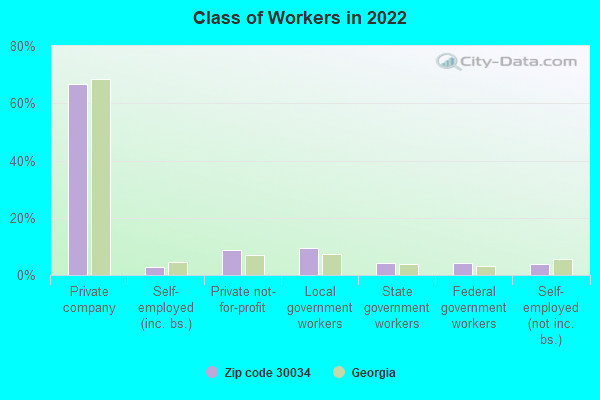
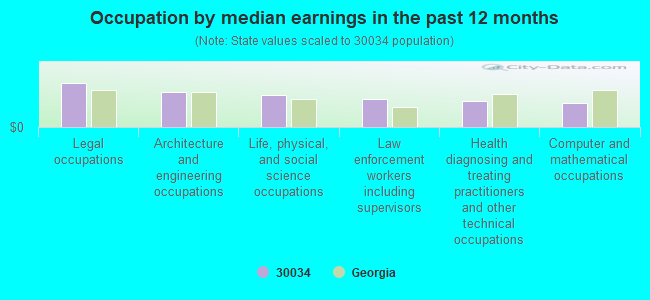
Occupation by median earnings in the past 12 months ($)
108,201Legal occupations
86,581Architecture and engineering occupations
78,746Life, physical, and social science occupations
70,012Law enforcement workers including supervisors
62,791Health diagnosing and treating practitioners and other technical occupations
59,302Computer and mathematical occupations
Companies with federal contracts located in this zip code (DECATUR, GA):
B E GUTHRIE CONSTRUCTION CO , (2490 COLUMBIA DR; small business) : $4,819,399 in 108 contractsfrom 2000 to 2005
Contracts for Construction of Structures and Facilities -- Other Administrative Facilities and Service Buildings, Maintenance, Repair or Alteration of Real Property -- Family Housing Facilities, Construction of Structures and Facilities -- Office Buildings, Office Furniture, and moreby Army Signed by year:2000: $247,254; 2001: $229,490; 2002: $1,081,273; 2003: $1,218,236; 2004: $195,886; 2005: $1,847,260; 2006: $0.
Biggest contracts:
$611,828 with Army for Construction of Structures and Facilities -- Other Administrative Facilities and Service Buildings. Signed on 2005-05-25. Completion date: 2005-09-08.
$611,828, same as above.Signed on 2005-05-25. Completion date: 2005-09-08.
$611,828, same as above.Signed on 2005-08-04. Completion date: 2005-09-08.
$425,300, same as above.Signed on 2003-07-08. Completion date: 2003-05-14.
EARTHGRAINS BAKING COMPANIES, (3310 PANTHERSVILLE RD) : $467,771 in 10 contractsfrom 2001 to 2006
Contracts for Food Items For Resale, Bakery and Cereal Products by Defense Commissary Agency, Department of Veterans Affairs, Defense Logistics Agency Signed by year:2000: $0; 2001: $0; 2002: $0; 2003: $23,673; 2004: $80,727; 2005: $243,613; 2006: $119,758.
Biggest contracts:
$109,930 with Defense Commissary Agency for Food Items For Resale. Signed on 2006-01-01. Completion date: 2006-03-31.
$106,609, same as above.Signed on 2005-04-01. Completion date: 2005-08-31.
$80,727, same as above.Signed on 2004-10-01. Completion date: 2005-02-28.
$63,599, same as above.Signed on 2005-10-01. Completion date: 2005-12-31.
THE PAINT WORKS INC (3819 GOTHIC ELM CT; small business) : $321,315 in 7 contractsfrom 1999 to 2005
Contracts for Construction of Structures and Facilities -- Maintenance Buildings, Clean Work Stations, Controlled Environment and Related Equipment, Construction of Structures and Facilities -- Other Non-Building Facilities, Maintenance, Repair or Alteration of Real Property -- Miscellaneous Buildings, and moreby Army, Air Force, Bureau of Engraving and Printing Signed by year:2000: $181,631; 2001: $9,301; 2002: $0; 2003: $0; 2004: $0; 2005: $126,438; 2006: $0.
Biggest contracts:
$180,608 with Army for Construction of Structures and Facilities -- Maintenance Buildings. Taking place in IL. Signed on 2000-09-25. Completion date: 2001-02-07.
$114,078 with Air Force for Clean Work Stations, Controlled Environment and Related Equipment. Taking place in KS. Signed on 2005-11-29. Completion date: 2006-01-31.
$12,360 with Bureau of Engraving and Printing for Construction of Structures and Facilities -- Other Non-Building Facilities. Taking place in DC. Signed on 2005-10-04. Completion date: 2005-11-14.
$6,530 with Army for Construction of Structures and Facilities -- Maintenance Buildings. Taking place in IL. Signed on 2001-03-15. Completion date: 2001-05-01.
G 4 ENTERPRISES, INC (NOT INC) (3290 KINGS BAY COURT; small business) : $76,368 in 5 contractsfrom 2003 to 2006
Contracts for Other ADP and Telecommunications Services (includes data storage on tapes, compact disks, etc.), Maintenance, Repair and Rebuilding of Equipment -- Automatic Data Processing Equipment (Including Firmware), Software, Supplies and Support Equipment by Army, Air Force Signed by year:2000: $0; 2001: $0; 2002: $0; 2003: $2,375; 2004: $73,997; 2005: $0; 2006: -$4.
Biggest contracts:
$60,000 with Army for Other ADP and Telecommunications Services (includes data storage on tapes, compact disks, etc.). Taking place in AL. Signed on 2003-07-18. Completion date: 2003-09-18.
$49,997 with Air Force for Maintenance, Repair and Rebuilding of Equipment -- Automatic Data Processing Equipment (Including Firmware), Software, Supplies and Support Equipment. Signed on 2004-08-11. Completion date: 2005-08-10.
$24,000 with Army for Other ADP and Telecommunications Services (includes data storage on tapes, compact disks, etc.). Taking place in AL. Signed on 2004-03-24. Completion date: 2005-03-21.
-$4, same as above.Signed on 2006-01-06. Completion date: 2005-03-21.
GREENLEE MECHANICAL & ELECTRIC (3241 DEER PAUSE LANE; small business) : $38,286 in 2 contractsin 2004
$32,036 with Army for Maintenance, Repair or Alteration of Real Property -- Recreation Facilities (Non-Building). Signed on 2004-03-24. Completion date: 2004-08-17.
$6,250 with Navy for Miscellaneous Maintenance and Repair Shop Specialized Equipment. Signed on 2004-03-22. Completion date: 2004-03-29.
EDMOND, BEVERLY C (4669 WONDER VALLEY TR; small business) : $6,200 in 2 contractsin 2005
$3,100 with Army for Other Professional Services. Signed on 2005-08-11. Completion date: 2005-08-31.
$3,100 with U.S. Army Corps of Engineers - civil program financing only for Other Professional Services. Signed on 2005-08-11. Completion date: 2005-08-31.
TAYLOR, HARRIETT A (3827 HOLY CROSS COURT; small business)
$480 with Navy for Chaplain Services. Signed on 2004-03-17. Completion date: 2004-03-17.
Top industries in this zip code by the number of employees in 2005:
Health Care and Social Assistance: Psychiatric and Substance Abuse Hospitals (500-999 employees: 1 establishment)
Health Care and Social Assistance: Child Day Care Services (100-249: 1, 50-99: 1, 20-49: 3, 10-19: 5, 5-9: 5, 1-4: 7)
2002 - 2018 National Fire Incident Reporting System (NFIRS) incidents
Based on the data from the years 2002 - 2018 the average number of fires per year is 215. The highest number of reported fire incidents - 351 took place in 2011, and the least - 0 in 2004. The data has a growing trend.
When looking into fire subcategories, the most reports belonged to: Structure Fires (36.9%), and Outside Fires (31.5%).
Fire incident types reported to NFIRS in Zip Code 30034


 Nearest zip codes: 30032, 30294, 30035, 30002, 30316, 30288.
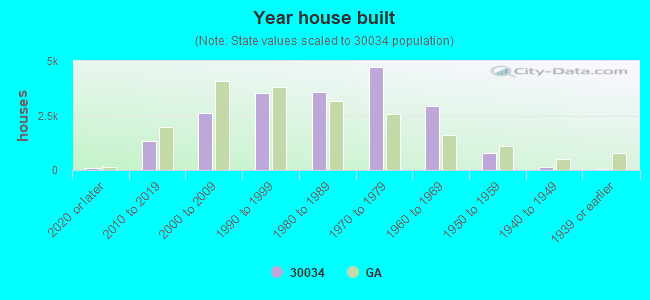


 Based on the data from the years 2002 - 2018 the average number of fires per year is 215. The highest number of reported fire incidents - 351 took place in 2011, and the least - 0 in 2004. The data has a growing trend.
 When looking into fire subcategories, the most reports belonged to: Structure Fires (36.9%), and Outside Fires (31.5%).