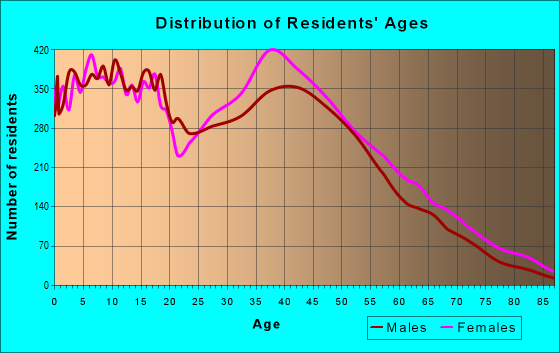
Estimated zip code population in 2022: 45,922 Zip code population in 2010: 43,356 Zip code population in 2000: 31,836
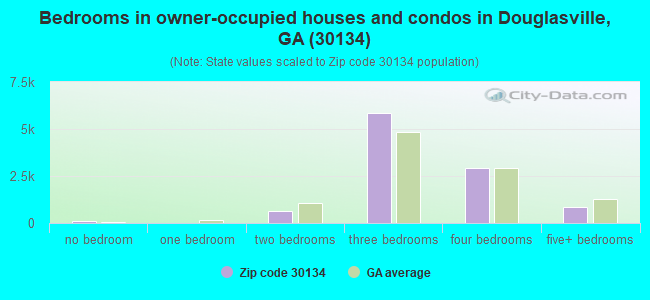
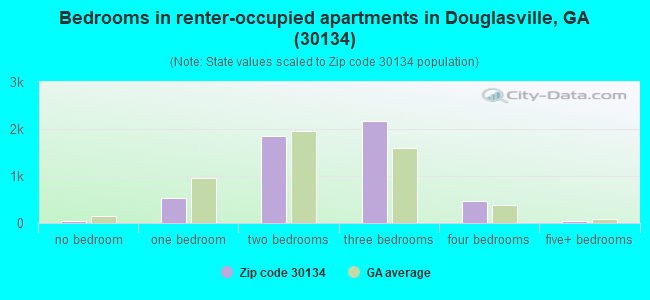
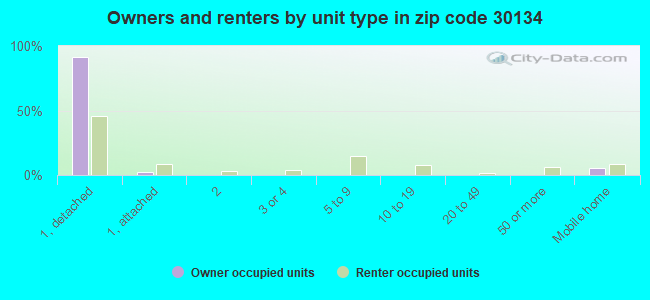
Houses and condos: 16,755 Renter-occupied apartments: 5,138
% of renters here:
33%
State:
34%
March 2022 cost of living index in zip code 30134: 100.5 (near average, U.S. average is 100)
Land area: 49.6 sq. mi. Water area: 0.2 sq. mi.
Population density: 926 people per square mile
(low).
OSM Map
General Map
Google Map
MSN Map
OSM Map
General Map
Google Map
MSN Map
OSM Map
General Map
Google Map
MSN Map
OSM Map
General Map
Google Map
MSN Map
Please wait while loading the map...
Real estate property taxes paid for housing units in 2022:
This zip code:
0.8% ($2,001)
Georgia:
0.7% ($2,160)
Median real estate property taxes paid for housing units with mortgages in 2022: $2,098 (0.8%) Median real estate property taxes paid for housing units with no mortgage in 2022: $1,395 (0.6%)
Averages for the 2020 tax year for zip code 30134, filed in 2021:
Average Adjusted Gross Income (AGI) in 2020: $46,240 (Individual Income Tax Returns)
Here:
$46,240
State:
$70,847
Salary/wage: $43,177 (reported on 85.3% of returns)
Here:
$43,177
State:
$59,126
(% of AGI for various income ranges: 1220.6% for AGIs below $25k, 3799.4% for AGIs $25k-50k, 7341.2% for AGIs $50k-75k, 10626.7% for AGIs $75k-100k, 19199.0% for AGIs $100k-200k, 58314.3% for AGIs over 200k)
Taxable interest for individuals: $753 (reported on 11.7% of returns)
This zip code:
$753
Georgia:
$2,011
(% of AGI for various income ranges: 4.3% for AGIs below $25k, 7.0% for AGIs $25k-50k, 18.7% for AGIs $50k-75k, 18.9% for AGIs $75k-100k, 39.1% for AGIs $100k-200k, 332.9% for AGIs over 200k)
Ordinary dividends: $2,286 (reported on 6.5% of returns)
Here:
$2,286
State:
$8,996
(% of AGI for various income ranges: 4.1% for AGIs below $25k, 8.8% for AGIs $25k-50k, 24.3% for AGIs $50k-75k, 41.5% for AGIs $75k-100k, 102.5% for AGIs $100k-200k, 628.6% for AGIs over 200k)
Net capital gain/loss in AGI: +$6,043 (reported on 5.7% of returns)
Here:
+$6,043
State:
+$28,402
(% of AGI for various income ranges: 2.0% for AGIs below $25k, 8.0% for AGIs $25k-50k, 29.0% for AGIs $50k-75k, 89.6% for AGIs $75k-100k, 248.4% for AGIs $100k-200k, 4030.0% for AGIs over 200k)
Profit/loss from business: +$1,378 (reported on 25.7% of returns)
Here:
+$1,378
State:
+$6,707
(% of AGI for various income ranges: 63.3% for AGIs below $25k, 68.6% for AGIs $50k-75k, 15.0% for AGIs $75k-100k, 188.1% for AGIs $100k-200k, 1468.6% for AGIs over 200k)
Taxable individual retirement arrangement distribution: $16,430 (reported on 4.1% of returns)
30134:
$16,430
Georgia:
$20,525
(% of AGI for various income ranges: 17.3% for AGIs below $25k, 41.8% for AGIs $25k-50k, 100.8% for AGIs $50k-75k, 196.9% for AGIs $75k-100k, 436.7% for AGIs $100k-200k, 3315.7% for AGIs over 200k)
Total itemized deductions: $25,956 (reported on 8.3% of returns)
Here:
$25,956
State:
$34,001
(% of AGI for various income ranges: 32.6% for AGIs below $25k, 152.2% for AGIs $25k-50k, 480.9% for AGIs $50k-75k, 708.4% for AGIs $75k-100k, 1338.4% for AGIs $100k-200k, 5990.0% for AGIs over 200k)
Charity contributions: $9,708 (reported on 7.1% of returns)
Here:
$9,708
State:
$14,164
(% of AGI for various income ranges: 4.4% for AGIs below $25k, 39.3% for AGIs $25k-50k, 132.5% for AGIs $50k-75k, 207.6% for AGIs $75k-100k, 515.8% for AGIs $100k-200k, 3012.9% for AGIs over 200k)
Taxes paid: $6,324 (reported on 8.2% of returns)
30134:
$6,324
State:
$7,540
(% of AGI for various income ranges: 5.1% for AGIs below $25k, 29.4% for AGIs $25k-50k, 110.2% for AGIs $50k-75k, 192.7% for AGIs $75k-100k, 387.2% for AGIs $100k-200k, 1251.4% for AGIs over 200k)
Earned income credit: $2,607 (reported on 27.9% of returns)
Here:
$2,607
State:
$2,530
(% of AGI for various income ranges: 149.9% for AGIs below $25k, 103.1% for AGIs $25k-50k, 1.7% for AGIs $50k-75k)
Percentage of individuals using paid preparers for their 2020 taxes: 92.2%
Here:
92%
State:
93%
(% for various income ranges: 92.3% for AGIs below $25k, 92.3% for AGIs $25k-50k, 91.3% for AGIs $50k-75k, 92.5% for AGIs $75k-100k, 92.8% for AGIs $100k-200k, 90.9% for AGIs over 200k)
Averages for the 2012 tax year for zip code 30134, filed in 2013:
Average Adjusted Gross Income (AGI) in 2012: $40,325 (Individual Income Tax Returns)
Here:
$40,325
State:
$56,131
Salary/wage: $38,486 (reported on 88.2% of returns)
Here:
$38,486
State:
$47,942
(% of AGI for various income ranges: 81.9% for AGIs below $25k, 89.6% for AGIs $25k-50k, 86.5% for AGIs $50k-75k, 85.2% for AGIs $75k-100k, 82.1% for AGIs $100k-200k, 53.7% for AGIs over 200k)
Taxable interest for individuals: $869 (reported on 15.2% of returns)
This zip code:
$869
Georgia:
$1,706
(% of AGI for various income ranges: 0.5% for AGIs below $25k, 0.3% for AGIs $25k-50k, 0.2% for AGIs $50k-75k, 0.3% for AGIs $75k-100k, 0.3% for AGIs $100k-200k, 1.0% for AGIs over 200k)
Ordinary dividends: $2,065 (reported on 7.6% of returns)
Here:
$2,065
State:
$7,265
(% of AGI for various income ranges: 0.4% for AGIs below $25k, 0.3% for AGIs $25k-50k, 0.3% for AGIs $50k-75k, 0.3% for AGIs $75k-100k, 0.4% for AGIs $100k-200k, 1.7% for AGIs over 200k)
Net capital gain/loss in AGI: +$2,640 (reported on 4.9% of returns)
Here:
+$2,640
State:
+$16,323
(% of AGI for various income ranges: 0.5% for AGIs $75k-100k, 0.8% for AGIs $100k-200k, 1.8% for AGIs over 200k)
Profit/loss from business: +$2,808 (reported on 20.3% of returns)
Here:
+$2,808
State:
+$7,583
(% of AGI for various income ranges: 7.9% for AGIs below $25k, 0.4% for AGIs $50k-75k, 0.5% for AGIs $75k-100k, 1.1% for AGIs $100k-200k)
Taxable individual retirement arrangement distribution: $13,829 (reported on 5.3% of returns)
30134:
$13,829
Georgia:
$17,199
(% of AGI for various income ranges: 1.5% for AGIs below $25k, 1.2% for AGIs $25k-50k, 1.6% for AGIs $50k-75k, 1.8% for AGIs $75k-100k, 3.4% for AGIs $100k-200k)
Total itemized deductions: $18,321 (26% of AGI, reported on 34.0% of returns)
Here:
$18,321
State:
$23,886
Here:
26.3% of AGI
State:
21.5% of AGI
(% of AGI for various income ranges: 7.4% for AGIs below $25k, 14.9% for AGIs $25k-50k, 18.2% for AGIs $50k-75k, 17.8% for AGIs $75k-100k, 16.9% for AGIs $100k-200k, 16.9% for AGIs over 200k)
Charity contributions: $4,134 (reported on 29.1% of returns)
Here:
$4,134
State:
$5,507
(% of AGI for various income ranges: 1.0% for AGIs below $25k, 2.7% for AGIs $25k-50k, 3.5% for AGIs $50k-75k, 3.3% for AGIs $75k-100k, 3.5% for AGIs $100k-200k, 5.9% for AGIs over 200k)
Taxes paid: $4,698 (reported on 33.9% of returns)
30134:
$4,698
State:
$7,838
(% of AGI for various income ranges: 1.1% for AGIs below $25k, 2.8% for AGIs $25k-50k, 4.4% for AGIs $50k-75k, 5.1% for AGIs $75k-100k, 5.7% for AGIs $100k-200k, 5.6% for AGIs over 200k)
Earned income credit: $2,710 (reported on 31.0% of returns)
Here:
$2,710
State:
$2,589
(% of AGI for various income ranges: 11.7% for AGIs below $25k, 1.6% for AGIs $25k-50k)
Percentage of individuals using paid preparers for their 2012 taxes: 52.7%
Here:
53%
State:
55%
(% for various income ranges: 52.9% for AGIs below $25k, 52.2% for AGIs $25k-50k, 53.1% for AGIs $50k-75k, 50.7% for AGIs $75k-100k, 53.0% for AGIs $100k-200k, 66.7% for AGIs over 200k)
Averages for the 2004 tax year for zip code 30134, filed in 2005:
Average Adjusted Gross Income (AGI) in 2004: $40,133 (Individual Income Tax Returns)
Here:
$40,133
State:
$47,553
Salary/wage: $37,646 (reported on 90.8% of returns)
Here:
$37,646
State:
$42,178
(% of AGI for various income ranges: 116.8% for AGIs below $10k, 88.0% for AGIs $10k-25k, 92.2% for AGIs $25k-50k, 90.3% for AGIs $50k-75k, 90.5% for AGIs $75k-100k, 60.3% for AGIs over 100k)
Taxable interest for individuals: $1,216 (reported on 25.8% of returns)
This zip code:
$1,216
Georgia:
$1,772
(% of AGI for various income ranges: 2.6% for AGIs below $10k, 0.9% for AGIs $10k-25k, 0.5% for AGIs $25k-50k, 0.4% for AGIs $50k-75k, 0.5% for AGIs $75k-100k, 1.7% for AGIs over 100k)
Taxable dividends: $1,293 (reported on 11.6% of returns)
Here:
$1,293
State:
$4,283
(% of AGI for various income ranges: 1.0% for AGIs below $10k, 0.4% for AGIs $10k-25k, 0.2% for AGIs $25k-50k, 0.3% for AGIs $50k-75k, 0.4% for AGIs $75k-100k, 0.7% for AGIs over 100k)
Net capital gain/loss: +$9,242 (reported on 7.9% of returns)
Here:
+$9,242
State:
+$16,461
(% of AGI for various income ranges: -0.4% for AGIs below $10k, 0.2% for AGIs $10k-25k, 0.2% for AGIs $25k-50k, 0.5% for AGIs $50k-75k, 0.6% for AGIs $75k-100k, 7.9% for AGIs over 100k)
Profit/loss from business: +$3,313 (reported on 16.3% of returns)
Here:
+$3,313
State:
+$8,201
(% of AGI for various income ranges: 3.2% for AGIs below $10k, 2.9% for AGIs $10k-25k, 0.5% for AGIs $25k-50k, 0.9% for AGIs $50k-75k, 1.6% for AGIs $75k-100k, 1.9% for AGIs over 100k)
IRA payment deduction: $2,331 (reported on 1.7% of returns)
30134:
$2,331
Georgia:
$2,969
(% of AGI for various income ranges: 0.2% for AGIs $10k-25k, 0.1% for AGIs $25k-50k, 0.1% for AGIs $50k-75k, 0.1% for AGIs $75k-100k, 0.1% for AGIs over 100k)
Self-employed pension: $13,231 (reported on 0.2% of returns)
Here:
$13,231
Georgia:
$16,203
Total itemized deductions: $16,322 (26% of AGI, reported on 46.1% of returns)
Here:
$16,322
State:
$19,944
Here:
26.3% of AGI
State:
22.6% of AGI
(% of AGI for various income ranges: 16.1% for AGIs below $10k, 12.2% for AGIs $10k-25k, 21.4% for AGIs $25k-50k, 21.1% for AGIs $50k-75k, 20.0% for AGIs $75k-100k, 14.7% for AGIs over 100k)
Charity contributions deductions: $3,118 (5% of AGI, reported on 40.7% of returns)
Here:
$3,118
State:
$4,354
Here:
4.9% of AGI
State:
4.7% of AGI
(% of AGI for various income ranges: 1.5% for AGIs below $10k, 1.8% for AGIs $10k-25k, 3.5% for AGIs $25k-50k, 3.5% for AGIs $50k-75k, 3.4% for AGIs $75k-100k, 3.0% for AGIs over 100k)
Total tax: $4,842 (reported on 70.0% of returns)
30134:
$4,842
State:
$8,223
(% of AGI for various income ranges: 3.6% for AGIs below $10k, 3.2% for AGIs $10k-25k, 5.4% for AGIs $25k-50k, 7.5% for AGIs $50k-75k, 9.3% for AGIs $75k-100k, 16.3% for AGIs over 100k)
Earned income credit: $1,930 (reported on 23.3% of returns)
Here:
$1,930
State:
$1,986
Percentage of individuals using paid preparers for their 2004 taxes: 59.2%
Here:
59%
State:
62%
(% for various income ranges: 53.2% for AGIs below $10k, 63.6% for AGIs $10k-25k, 60.0% for AGIs $25k-50k, 58.3% for AGIs $50k-75k, 54.9% for AGIs $75k-100k, 64.2% for AGIs over 100k)
Likely homosexual households (counted as self-reported same-sex unmarried-partner households)
Lesbian couples: 0.6% of all households
Gay men: 0.2% of all households
Household received Food Stamps/SNAP in the past 12 months: 1,875 Household did not receive Food Stamps/SNAP in the past 12 months: 13,628
Women who had a birth in the past 12 months: 1,013 (794 now married, 220 unmarried) Women who did not have a birth in the past 12 months: 10,440 (3,992 now married, 6,449 unmarried)
Housing units in zip code 30134 with a mortgage: 7,587 (505 second mortgage, 379 both second mortgage and home equity loan) Houses without a mortgage: 48
Median monthly owner costs for units with a mortgage: $1,391 Median monthly owner costs for units without a mortgage: $443
Residents with income below the poverty level in 2022:
This zip code:
11.7%
Whole state:
12.7%
Residents with income below 50% of the poverty level in 2022:
This zip code:
4.2%
Whole state:
6.3%
Median number of rooms in houses and condos:
Here:
6.5
State:
6.8
Median number of rooms in apartments:
Here:
5.1
State:
4.6
Notable locations in this zip code not listed on our city pages
Notable locations in zip code 30134: Douglas Industrial Park (A), Camp Inageh (B), Western Pines Country Club (C), Shadix Industrial Park (D), Greystone Golf Course (E), Douglas County Sheriff Station (F), Douglas County Fire Department Station 7 (G), Douglas County Fire Department Station 11 (H), Paulding County Fire and Rescue Bureau Station 5 (I), Douglas County Water and Sewer Administration Building (J), Douglas County Health Department (K), Douglasville Police Station (L), Douglasville City Hall (M), Douglas County Fire Department Station 10 (N), Douglas County Courthouse (O), Douglas County Public Library (P). Display/hide their locations on the map
Shopping Centers: Spring Market Shopping Center (1), Douglas Village Shopping Center (2), West Moreland Plaza Shopping Center (3), Forest Mart Shopping Center (4), Douglasville Crossroads Shopping Center (5), Douglas Common Shopping Center (6), Douglasville Village Shopping Center (7), Eastfield Shopping Center (8). Display/hide their locations on the map
Churches in zip code 30134 include: Souls Harvest Worship Center (A), Mount Zion Church (B), Star of Bethelhem Church (C), Friendship Church (D), Souls Arbor Tabernacle (E), Welcome Hill Church (F), Faith Church (G), Beulah Church (H), Zion Hill Baptist Church (I). Display/hide their locations on the map
Cemeteries: Friendship Cemetery (1), Mount Zion Cemetery (2), Star of Bethlehem Cemetery (3), Sweetwater Cemetery (4), Sunrise Memorial Gardens (5), Hunter Memorial Park (6). Display/hide their locations on the map
Lakes and reservoirs: Gresham Lake (A), Greystone Lake (B), Chism Lake (C), Crystal Lake (D), Jones Lake (E), Lake Douglas (F), Jones Lake (G), Vaughn Lake (H). Display/hide their locations on the map
Streams, rivers, and creeks: Waterfall Branch (A), Town Branch (B), Mud Creek (C), Mill Creek (D), Little Creek (E). Display/hide their locations on the map
5,801 married couples with children.
3,822 single-parent households (682 men, 3,140 women).
88.2% of residents of 30134 zip code speak English at home.
8.1% of residents speak Spanish at home (71% very well, 15% well, 12% not well, 3% not at all).
1.3% of residents speak other Indo-European language at home (95% very well, 1% well, 3% not well).
0.8% of residents speak Asian or Pacific Island language at home (82% very well, 18% well).
1.4% of residents speak other language at home (98% very well, 1% well, 1% not well).
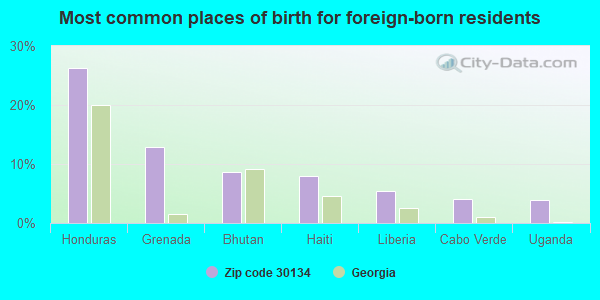
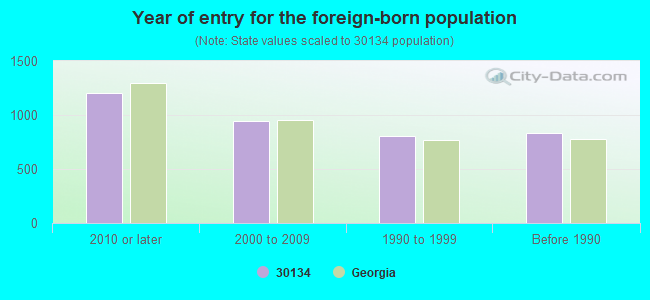
Foreign born population: 3,374 (7.3%) (47.4% of them are naturalized citizens)
Major facilities with environmental interests located in this zip code:
LAFARGE DOUGLASVILLE CONCRETE PLANT (6505-A BANKHEAD HWY in DOUGLASVILLE, GA)
AIR SYNTHETIC MINOR (AIRS/AFS) STATE MASTER (Georgia's Geographic Environmental Information) - UST-003, UNDERGROUND STORAGE TANK PROGRAM, UST-1, UST-2, PERFORMANCE TRACK (National Environmental Performance Track) National Pollutant Discharge Elimination System NON-MAJOR (Tracking pollutant discharge elimination systems) - permit TRI REPORTER (Tracking of toxic chemicals releasing facilities) Business SIC classification: CRUSHED AND BROKEN GRANITE; READY-MIXED CONCRETE Organizations: BLUE CIRCLE AGGREGATES INC (CONTACT/OPERATOR)
, LAFARGE AGGREGATES SE (CONTACT/OWNER)
, BLUE CIRCLE AGGREGAT (INSTALLER)
Alternative names: BLUE CIRCLE AGGREGATES INC, BLUE CIRCLE AGGREGATES INC DOUGL, BLUE CIRCLE/DOUGLASVILLE PLANT #, JAMES FORBES, LAFARGE AGGREGATES SE, LAFARGE AGGREGATES SE INC
BETTCO 1 (6462 EAST BROAD STREET in DOUGLASVILLE, GA)
STATE MASTER (Georgia's Geographic Environmental Information) - UST-1, UNDERGROUND STORAGE TANK PROGRAM, UST-2, UST-3, (Resource Conservation and Recovery Act (tracking hazardous waste)) Conditionally Exempt Small Quantity Generators, less than 100 kg/month of hazardous waste (Resource Conservation and Recovery Act (tracking hazardous waste)) - notification Organizations: GEORGIA OILMENS SERVICES (CONTACT/AGENT)
, BETTCO FOOD SHOP INC (CONTACT/OWNER)
, JAMES P. MORGAN (CONTACT/OWNER)
, BETTY S MORGAN (CONTACT/OWNER)
Alternative names: BETTCO AMOCO #1, BETTCO FOOD SHOP INC
BP OIL CO (5587 FAIRBURN ROAD in DOUGLASVILLE, GA)
STATE MASTER (Georgia's Geographic Environmental Information) - UST-1, UNDERGROUND STORAGE TANK PROGRAM, UST-3, UST-5, UST-6, UST-7, UST-8, UST-2, UST-4, (Resource Conservation and Recovery Act (tracking hazardous waste)) Organizations: BAGWELL & SPEARS INC (CONTACT/OPERATOR)
Alternative names: DOUGLASVILLE BP #40
QUIKTRIP #758 (2786 CHAPEL HILL RD in DOUGLASVILLE, GA)
STATE MASTER (Georgia's Geographic Environmental Information) - UST-1, UNDERGROUND STORAGE TANK PROGRAM, UST-2, UST-3, Conditionally Exempt Small Quantity Generators, less than 100 kg/month of hazardous waste (Resource Conservation and Recovery Act (tracking hazardous waste)) - notification Organizations: QUIKTRIP CORP (CONTACT/OPERATOR)
, APEC (INSTALLER)
Alternative names: QUIKTRIP STORE #758
CIRCLE K #1882 (5785 W STEWART MILL RD in DOUGLASVILLE, GA)
STATE MASTER (Georgia's Geographic Environmental Information) - UST-1, UNDERGROUND STORAGE TANK PROGRAM, UST-2, UST-3, Conditionally Exempt Small Quantity Generators, less than 100 kg/month of hazardous waste (Resource Conservation and Recovery Act (tracking hazardous waste)) - notification Organizations: CIRCLE K STORES INC (CONTACT/OPERATOR)
, ATLANTA PETRO EQUIP (INSTALLER)
FAIRBURN RD CHEVRON (5565 FAIRBURN RD in DOUGLASVILLE, GA)
STATE MASTER (Georgia's Geographic Environmental Information) - UST-1, UNDERGROUND STORAGE TANK PROGRAM, UST-2, UST-4, UST-5, UST-3, Small Quantity Generators, between 100 kg and 1000 kg of hazardous waste/month (Resource Conservation and Recovery Act (tracking hazardous waste)) - notification Organizations: FAIRBURN ROAD CHEVRON (CONTACT/OWNER)
, TASCON, INC (INSTALLER)
BELLSOUTH TELECOMMUNICATIONS (8650 CLUB DRIVE in DOUGLASVILLE, GA)
AIR SYNTHETIC MINOR (AIRS/AFS) STATE MASTER (Georgia's Geographic Environmental Information) - UST-1, UNDERGROUND STORAGE TANK PROGRAM, UST-2, Organizations: BELLSOUTH TELECOMMUNICATIONS INC (CONTACT/OWNER)
Alternative names: BELLSOUTH TELECOMMUNICATIONS/CLUB DR, BST/DOUGLASVILLE/F1316
L&L ENTERPRISES (7832 BANKHEAD HIGHWAY in DOUGLASVILLE, GA)
AIR MINOR (AIRS/AFS) (Integrated Compliance Information System) - ICIS-04-2001-1501, FORMAL ENFORCEMENT ACTION Business SIC classification: GENERAL AUTOMOTIVE REPAIR SHOPS; NONCLASSIFIABLE ESTABLISHMENTS
PREMIER METAL PRODS. (8960 HWY 5 in DOUGLASVILLE, GA)
AIR MINOR (AIRS/AFS) (Resource Conservation and Recovery Act (tracking hazardous waste)) Business SIC classification: SHEET METALWORK Organizations: PIMENTAL FRANK J (CONTACT/OWNER)
, ROBERT E YANCEY (CONTACT/OWNER)
BEULAH ELEMENTARY SCHOOL (1150 BURNT HICKORY ROAD in DOUGLASVILLE, GA)
(Geographic Names Information System) (National Center for Education Statistics) - STATE ID-2050 Organizations: DOUGLAS COUNTY (SCHOOL DISTRICT)
BURNETT ELEMENTARY SCHOOL (8277 CONNALLY DRIVE in DOUGLASVILLE, GA)
(National Center for Education Statistics) - STATE ID-0398 Organizations: DOUGLAS COUNTY (SCHOOL DISTRICT)
BRIGHT STAR ELEMENTARY SCHOOL (6300 JOHN WEST ROAD in DOUGLASVILLE, GA)
(National Center for Education Statistics) - STATE ID-0198 Organizations: DOUGLAS COUNTY (SCHOOL DISTRICT)
Housing units lacking complete plumbing facilities: 1.8% Housing units lacking complete kitchen facilities: 1.7%
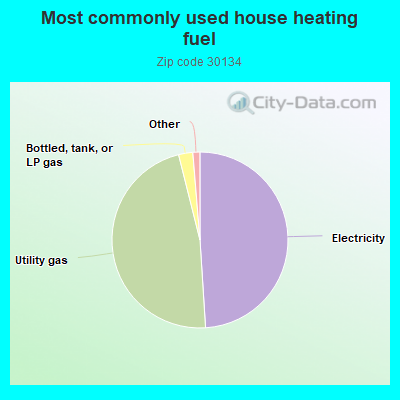
49.0%Electricity
47.1%Utility gas
2.6%Bottled, tank, or LP gas
0.6%No fuel used
0.6%Wood
Population in 1990: 17,182. Population change in the 1990s: +14,654 (+85.3%).
Place of birth for U.S.-born residents:
This state: 25,010
Northeast: 3,140
Midwest: 4,064
South: 8,292
West: 1,569
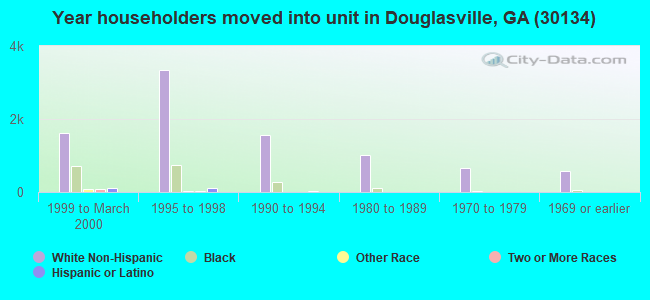
44% of the 30134 zip code residents lived in the same house 5 years ago. Out of people who lived in different houses, 32% lived in this county. Out of people who lived in different counties, 50% lived in Georgia.
86% of the 30134 zip code residents lived in the same house 1 year ago. Out of people who lived in different houses, 33% moved from this county. Out of people who lived in different houses, 43% moved from different county within same state. Out of people who lived in different houses, 20% moved from different state. Out of people who lived in different houses, 3% moved from abroad.
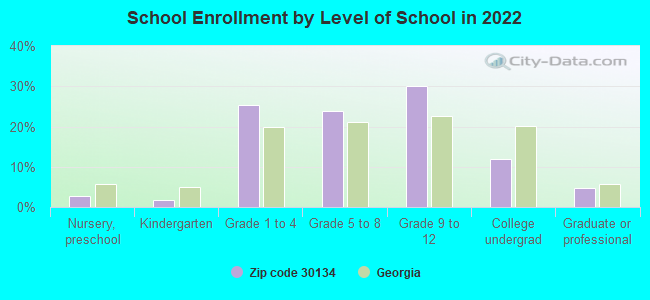
Private vs. public school enrollment:
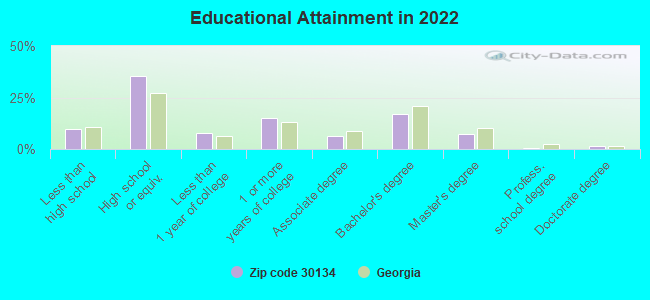
Students in private schools in grades 1 to 8 (elementary and middle school): 513
Here:
9.0%
Georgia:
12.1%
Students in private schools in grades 9 to 12 (high school): 264
Here:
7.6%
Georgia:
10.8%
Students in private undergraduate colleges: 542
Here:
39.8%
Georgia:
17.1%
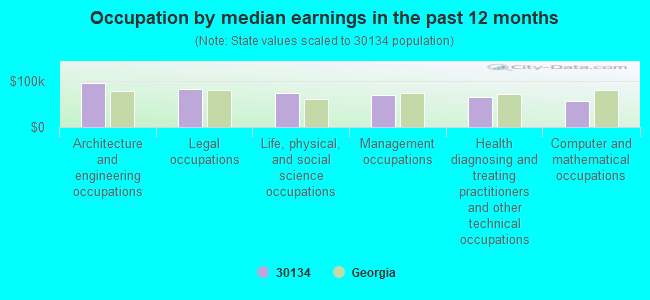
Occupation by median earnings in the past 12 months ($)
96,365Architecture and engineering occupations
83,310Legal occupations
73,732Life, physical, and social science occupations
71,120Management occupations
64,981Health diagnosing and treating practitioners and other technical occupations
56,888Computer and mathematical occupations
Companies with federal contracts located in this zip code (DOUGLASVILLE, GA):
KQ SERVICES INC (7274 BANKHEAD HWY STE B; small business) : $10,487,910 in 56 contractsfrom 1999 to 2006
Contracts for Custodial Janitorial Services, Other Housekeeping Services, Facilities Operations Support Services by Air Force, Department of Defense, Army, Public Buildings Service, and others Signed by year:2000: $4,085,124; 2001: $3,791,737; 2002: $734,373; 2003: $381,132; 2004: $133,383; 2005: $87,862; 2006: $471,457.
Biggest contracts:
$856,203 with Air Force for Custodial Janitorial Services. Taking place in FL. Signed on 2001-10-01. Completion date: 2002-09-30.
$817,472, same as above.Signed on 2000-11-06. Completion date: 2001-09-30.
$745,580, same as above.Signed on 1999-11-02. Completion date: 1999-11-01.
$733,800, same as above.Signed on 2001-11-07. Completion date: 2002-05-31.
PRIME CONTRACTORS INC (1000 SHADIX INDUSTRIAL WA; small business) : $307,709 in 19 contractsfrom 2001 to 2002
Contracts for Maintenance, Repair or Alteration of Real Property -- Miscellaneous Buildings by Army Signed by year:2000: $0; 2001: $240,140; 2002: $67,569; 2003: $0; 2004: $0; 2005: $0; 2006: $0.
Biggest contracts:
$38,449 with Army for Maintenance, Repair or Alteration of Real Property -- Miscellaneous Buildings. Signed on 2001-08-20. Completion date: 2001-10-31.
$34,237, same as above.Signed on 2001-07-03. Completion date: 2001-07-31.
$34,237, same as above.Signed on 2001-06-20. Completion date: 2001-06-30.
$30,825, same as above.Signed on 2002-04-29. Completion date: 2003-06-16.
WILLIAMS, HARRY L (790 BENTONVILLE LANE; small business) : $129,126 in 16 contractsfrom 2003 to 2005
Contracts for Other Professional Services by U.S. Army Corps of Engineers - civil program financing only, Army Signed by year:2000: $0; 2001: $0; 2002: $0; 2003: $31,633; 2004: $53,333; 2005: $44,160; 2006: $0.
Biggest contracts:
$22,100 with U.S. Army Corps of Engineers - civil program financing only for Other Professional Services. Signed on 2005-01-10. Completion date: 2005-12-31.
$22,100 with Army for Other Professional Services. Signed on 2005-01-10. Completion date: 2005-12-31.
$21,001, same as above.Signed on 2004-01-14. Completion date: 2004-12-31.
$21,001 with U.S. Army Corps of Engineers - civil program financing only for Other Professional Services. Signed on 2004-01-14. Completion date: 2004-12-31.
ENVIRONMENTAL MEDICAL AND GAS (1148 MANN RD; small business) : $50,800 in 4 contractsfrom 2004 to 2006
$28,800 with Army for Maintenance, Repair or Alteration of Real Property -- Hospitals and Infirmaries. Signed on 2005-08-19. Completion date: 2005-08-24.
$10,000 with Army for Equipment and Materials Testing -- Medical, Dental, and Veterinary Equipment and Supplies. Signed on 2004-04-14. Completion date: 2004-05-03.
$7,500, same as above.Signed on 2005-05-05. Completion date: 2005-05-10.
$4,500, same as above.Signed on 2006-04-21. Completion date: 2007-05-14.
SIGNATURE RESEARCH, INC (5493 WESTMORELAND PLAZA DR; small business) : $35,112 in 2 contractsfrom 2002 to 2004
$33,714 with Army for Maintenance, Repair or Alteration of Real Property -- Recreational Buildings. Taking place in AK. Signed on 2004-08-17. Completion date: 2004-09-10.
$1,398 with Army for Other Professional Services. Taking place in AK. Signed on 2002-05-16. Completion date: 2002-09-13.
WILLIAM N BURCH (7043 STONECREEK DR; small business) : $31,451 in 4 contractsfrom 2005 to 2006
$10,741 with Army for Industrial Hygienics. Signed on 2005-06-27. Completion date: 2005-09-30.
$8,527, same as above.Signed on 2006-06-26. Completion date: 2006-09-30.
$6,404, same as above.Signed on 2006-06-03. Completion date: 2006-09-30.
$5,779, same as above.Signed on 2006-04-24. Completion date: 2006-09-30.
ROCK ART LIMITED (4279 MIDWAY DR; small business)
$15,500 with Navy for Paints, Dopes, Varnishes, and Related Products. Signed on 2005-05-24. Completion date: 2005-06-17.
ARNOLD PAINTING (68 OAK LANDING DR; small business) : $8,190 in 2 contractsfrom 2004 to 2006
$5,200 with Army for Maintenance, Repair or Alteration of Real Property -- Miscellaneous Buildings. Signed on 2006-03-23. Completion date: 2006-03-31.
$2,990, same as above.Signed on 2004-06-30. Completion date: 2004-07-30.
Top industries in this zip code by the number of employees in 2005:
2002 - 2018 National Fire Incident Reporting System (NFIRS) incidents
Based on the data from the years 2002 - 2018 the average number of fire incidents per year is 131. The highest number of fire incidents - 211 took place in 2005, and the least - 46 in 2018. The data has a decreasing trend.
When looking into fire subcategories, the most incidents belonged to: Outside Fires (44.2%), and Structure Fires (31.4%).
Fire incident types reported to NFIRS in Zip Code 30134
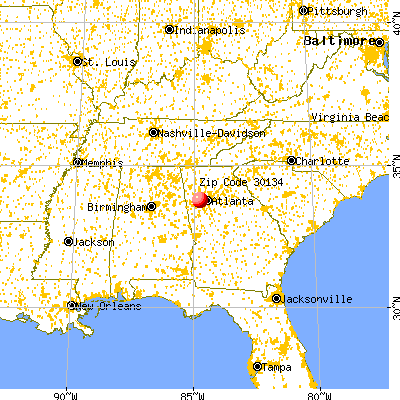


 Nearest zip codes: 30141, 30135, 30127, 30187, 30157, 30122.
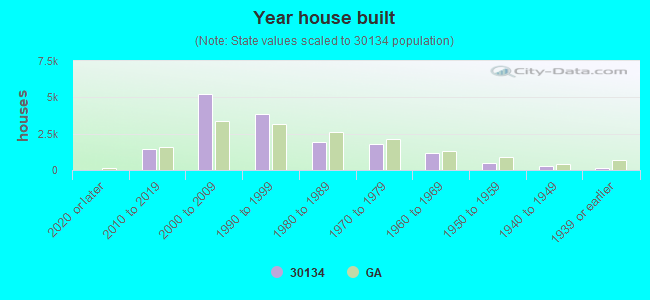


 Based on the data from the years 2002 - 2018 the average number of fire incidents per year is 131. The highest number of fire incidents - 211 took place in 2005, and the least - 46 in 2018. The data has a decreasing trend.
 When looking into fire subcategories, the most incidents belonged to: Outside Fires (44.2%), and Structure Fires (31.4%).