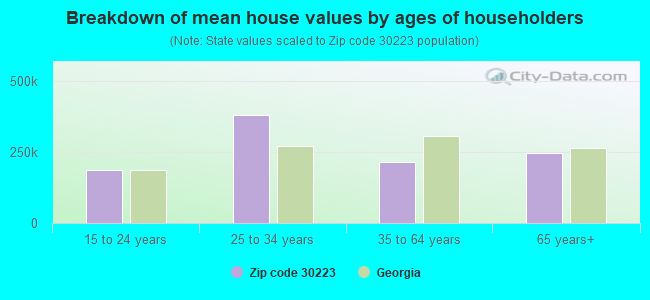
Estimated zip code population in 2022: 37,562 Zip code population in 2010: 36,769 Zip code population in 2000: 34,765
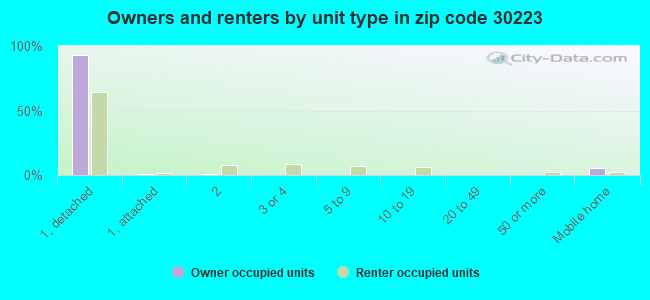
Houses and condos: 15,907 Renter-occupied apartments: 5,657
% of renters here:
37%
State:
34%
March 2022 cost of living index in zip code 30223: 100.2 (near average, U.S. average is 100)
Land area: 108.3 sq. mi. Water area: 1.9 sq. mi.
Population density: 347 people per square mile
(very low).
OSM Map
General Map
Google Map
MSN Map
OSM Map
General Map
Google Map
MSN Map
OSM Map
General Map
Google Map
MSN Map
OSM Map
General Map
Google Map
MSN Map
Please wait while loading the map...
Real estate property taxes paid for housing units in 2022:
This zip code:
0.8% ($1,649)
Georgia:
0.7% ($2,160)
Median real estate property taxes paid for housing units with mortgages in 2022: $1,702 (0.8%) Median real estate property taxes paid for housing units with no mortgage in 2022: $1,493 (0.8%)
Averages for the 2020 tax year for zip code 30223, filed in 2021:
Average Adjusted Gross Income (AGI) in 2020: $44,291 (Individual Income Tax Returns)
Here:
$44,291
State:
$70,847
Salary/wage: $36,691 (reported on 79.5% of returns)
Here:
$36,691
State:
$59,126
(% of AGI for various income ranges: 1231.7% for AGIs below $25k, 3581.2% for AGIs $25k-50k, 6637.9% for AGIs $50k-75k, 8347.0% for AGIs $75k-100k, 14562.8% for AGIs $100k-200k, 53398.7% for AGIs over 200k)
Taxable interest for individuals: $1,310 (reported on 17.6% of returns)
This zip code:
$1,310
Georgia:
$2,011
(% of AGI for various income ranges: 8.0% for AGIs below $25k, 11.3% for AGIs $25k-50k, 43.5% for AGIs $50k-75k, 60.6% for AGIs $75k-100k, 186.5% for AGIs $100k-200k, 947.5% for AGIs over 200k)
Ordinary dividends: $4,177 (reported on 10.0% of returns)
Here:
$4,177
State:
$8,996
(% of AGI for various income ranges: 7.9% for AGIs below $25k, 16.5% for AGIs $25k-50k, 65.8% for AGIs $50k-75k, 122.5% for AGIs $75k-100k, 343.2% for AGIs $100k-200k, 2443.8% for AGIs over 200k)
Net capital gain/loss in AGI: +$13,126 (reported on 8.9% of returns)
Here:
+$13,126
State:
+$28,402
(% of AGI for various income ranges: 1.9% for AGIs below $25k, 15.4% for AGIs $25k-50k, 65.5% for AGIs $50k-75k, 186.6% for AGIs $75k-100k, 698.2% for AGIs $100k-200k, 15185.0% for AGIs over 200k)
Profit/loss from business: +$1,364 (reported on 21.3% of returns)
Here:
+$1,364
State:
+$6,707
(% of AGI for various income ranges: 101.7% for AGIs $50k-75k, 220.8% for AGIs $75k-100k, 435.2% for AGIs $100k-200k, 1480.0% for AGIs over 200k)
Taxable individual retirement arrangement distribution: $19,052 (reported on 8.1% of returns)
30223:
$19,052
Georgia:
$20,525
(% of AGI for various income ranges: 29.5% for AGIs below $25k, 83.5% for AGIs $25k-50k, 211.1% for AGIs $50k-75k, 727.5% for AGIs $75k-100k, 1558.8% for AGIs $100k-200k, 4081.2% for AGIs over 200k)
Total itemized deductions: $28,095 (reported on 6.6% of returns)
Here:
$28,095
State:
$34,001
(% of AGI for various income ranges: 30.7% for AGIs below $25k, 170.3% for AGIs $25k-50k, 378.9% for AGIs $50k-75k, 602.7% for AGIs $75k-100k, 1374.5% for AGIs $100k-200k, 6212.5% for AGIs over 200k)
Charity contributions: $11,278 (reported on 5.6% of returns)
Here:
$11,278
State:
$14,164
(% of AGI for various income ranges: 4.3% for AGIs below $25k, 35.1% for AGIs $25k-50k, 103.2% for AGIs $50k-75k, 192.3% for AGIs $75k-100k, 516.3% for AGIs $100k-200k, 3732.5% for AGIs over 200k)
Taxes paid: $6,007 (reported on 6.4% of returns)
30223:
$6,007
State:
$7,540
(% of AGI for various income ranges: 3.7% for AGIs below $25k, 24.4% for AGIs $25k-50k, 74.7% for AGIs $50k-75k, 139.4% for AGIs $75k-100k, 374.6% for AGIs $100k-200k, 1238.8% for AGIs over 200k)
Earned income credit: $2,831 (reported on 32.7% of returns)
Here:
$2,831
State:
$2,530
(% of AGI for various income ranges: 184.6% for AGIs below $25k, 110.8% for AGIs $25k-50k, 1.4% for AGIs $50k-75k)
Percentage of individuals using paid preparers for their 2020 taxes: 92.8%
Here:
93%
State:
93%
(% for various income ranges: 92.9% for AGIs below $25k, 93.2% for AGIs $25k-50k, 91.0% for AGIs $50k-75k, 92.4% for AGIs $75k-100k, 93.1% for AGIs $100k-200k, 96.3% for AGIs over 200k)
Averages for the 2012 tax year for zip code 30223, filed in 2013:
Average Adjusted Gross Income (AGI) in 2012: $35,783 (Individual Income Tax Returns)
Here:
$35,783
State:
$56,131
Salary/wage: $30,435 (reported on 84.0% of returns)
Here:
$30,435
State:
$47,942
(% of AGI for various income ranges: 80.9% for AGIs below $25k, 83.0% for AGIs $25k-50k, 74.0% for AGIs $50k-75k, 67.2% for AGIs $75k-100k, 63.8% for AGIs $100k-200k, 39.0% for AGIs over 200k)
Taxable interest for individuals: $1,247 (reported on 16.7% of returns)
This zip code:
$1,247
Georgia:
$1,706
(% of AGI for various income ranges: 0.4% for AGIs below $25k, 0.5% for AGIs $25k-50k, 0.5% for AGIs $50k-75k, 0.7% for AGIs $75k-100k, 0.8% for AGIs $100k-200k, 0.7% for AGIs over 200k)
Ordinary dividends: $4,538 (reported on 8.4% of returns)
Here:
$4,538
State:
$7,265
(% of AGI for various income ranges: 0.3% for AGIs below $25k, 0.7% for AGIs $25k-50k, 0.8% for AGIs $50k-75k, 0.9% for AGIs $75k-100k, 1.6% for AGIs $100k-200k, 3.1% for AGIs over 200k)
Net capital gain/loss in AGI: +$6,045 (reported on 6.7% of returns)
Here:
+$6,045
State:
+$16,323
(% of AGI for various income ranges: 0.4% for AGIs $50k-75k, 0.7% for AGIs $75k-100k, 0.9% for AGIs $100k-200k, 8.2% for AGIs over 200k)
Profit/loss from business: +$4,111 (reported on 20.3% of returns)
Here:
+$4,111
State:
+$7,583
(% of AGI for various income ranges: 6.6% for AGIs below $25k, 0.9% for AGIs $50k-75k, 1.7% for AGIs $75k-100k, 1.3% for AGIs $100k-200k, 3.8% for AGIs over 200k)
Taxable individual retirement arrangement distribution: $15,876 (reported on 6.8% of returns)
30223:
$15,876
Georgia:
$17,199
(% of AGI for various income ranges: 1.5% for AGIs below $25k, 1.9% for AGIs $25k-50k, 3.1% for AGIs $50k-75k, 3.8% for AGIs $75k-100k, 5.9% for AGIs $100k-200k, 2.7% for AGIs over 200k)
Self-employment retirement plans: $19,750 (reported on 0.1% of returns)
30223:
$19,750
Georgia:
$23,277
Total itemized deductions: $19,566 (26% of AGI, reported on 24.5% of returns)
Here:
$19,566
State:
$23,886
Here:
26.0% of AGI
State:
21.5% of AGI
(% of AGI for various income ranges: 6.0% for AGIs below $25k, 14.0% for AGIs $25k-50k, 16.8% for AGIs $50k-75k, 17.2% for AGIs $75k-100k, 16.1% for AGIs $100k-200k, 12.3% for AGIs over 200k)
Charity contributions: $4,445 (reported on 21.2% of returns)
Here:
$4,445
State:
$5,507
(% of AGI for various income ranges: 0.8% for AGIs below $25k, 2.6% for AGIs $25k-50k, 3.1% for AGIs $50k-75k, 3.4% for AGIs $75k-100k, 3.4% for AGIs $100k-200k, 3.4% for AGIs over 200k)
Taxes paid: $5,623 (reported on 24.2% of returns)
30223:
$5,623
State:
$7,838
(% of AGI for various income ranges: 1.0% for AGIs below $25k, 2.8% for AGIs $25k-50k, 4.4% for AGIs $50k-75k, 5.4% for AGIs $75k-100k, 5.9% for AGIs $100k-200k, 5.5% for AGIs over 200k)
Earned income credit: $2,910 (reported on 40.6% of returns)
Here:
$2,910
State:
$2,589
(% of AGI for various income ranges: 14.0% for AGIs below $25k, 1.8% for AGIs $25k-50k)
Percentage of individuals using paid preparers for their 2012 taxes: 59.0%
Here:
59%
State:
55%
(% for various income ranges: 59.7% for AGIs below $25k, 56.7% for AGIs $25k-50k, 58.8% for AGIs $50k-75k, 56.3% for AGIs $75k-100k, 61.8% for AGIs $100k-200k, 83.3% for AGIs over 200k)
Averages for the 2004 tax year for zip code 30223, filed in 2005:
Average Adjusted Gross Income (AGI) in 2004: $32,099 (Individual Income Tax Returns)
Here:
$32,099
State:
$47,553
Salary/wage: $29,120 (reported on 88.7% of returns)
Here:
$29,120
State:
$42,178
(% of AGI for various income ranges: 94.4% for AGIs below $10k, 85.6% for AGIs $10k-25k, 88.3% for AGIs $25k-50k, 84.4% for AGIs $50k-75k, 84.2% for AGIs $75k-100k, 56.3% for AGIs over 100k)
Taxable interest for individuals: $1,309 (reported on 23.5% of returns)
This zip code:
$1,309
Georgia:
$1,772
(% of AGI for various income ranges: 2.4% for AGIs below $10k, 1.0% for AGIs $10k-25k, 0.8% for AGIs $25k-50k, 0.7% for AGIs $50k-75k, 0.7% for AGIs $75k-100k, 1.3% for AGIs over 100k)
Taxable dividends: $3,364 (reported on 9.4% of returns)
Here:
$3,364
State:
$4,283
(% of AGI for various income ranges: 1.0% for AGIs below $10k, 0.3% for AGIs $10k-25k, 0.3% for AGIs $25k-50k, 0.5% for AGIs $50k-75k, 0.6% for AGIs $75k-100k, 3.3% for AGIs over 100k)
Net capital gain/loss: +$11,980 (reported on 6.6% of returns)
Here:
+$11,980
State:
+$16,461
(% of AGI for various income ranges: 0.7% for AGIs below $10k, -0.0% for AGIs $10k-25k, 0.2% for AGIs $25k-50k, 0.2% for AGIs $50k-75k, 1.2% for AGIs $75k-100k, 11.1% for AGIs over 100k)
Profit/loss from business: +$5,718 (reported on 13.5% of returns)
Here:
+$5,718
State:
+$8,201
(% of AGI for various income ranges: 7.6% for AGIs below $10k, 4.0% for AGIs $10k-25k, 1.3% for AGIs $25k-50k, 1.1% for AGIs $50k-75k, 0.7% for AGIs $75k-100k, 4.1% for AGIs over 100k)
IRA payment deduction: $2,489 (reported on 1.4% of returns)
30223:
$2,489
Georgia:
$2,969
(% of AGI for various income ranges: 0.1% for AGIs $10k-25k, 0.1% for AGIs $25k-50k, 0.2% for AGIs $50k-75k, 0.1% for AGIs over 100k)
Self-employed pension: $17,909 (reported on 0.2% of returns)
Here:
$17,909
Georgia:
$16,203
Total itemized deductions: $16,876 (26% of AGI, reported on 27.6% of returns)
Here:
$16,876
State:
$19,944
Here:
26.5% of AGI
State:
22.6% of AGI
(% of AGI for various income ranges: 7.6% for AGIs below $10k, 7.3% for AGIs $10k-25k, 14.9% for AGIs $25k-50k, 17.9% for AGIs $50k-75k, 18.9% for AGIs $75k-100k, 15.6% for AGIs over 100k)
Charity contributions deductions: $4,151 (6% of AGI, reported on 24.6% of returns)
Here:
$4,151
State:
$4,354
Here:
6.3% of AGI
State:
4.7% of AGI
(% of AGI for various income ranges: 0.6% for AGIs below $10k, 1.2% for AGIs $10k-25k, 2.9% for AGIs $25k-50k, 3.7% for AGIs $50k-75k, 4.5% for AGIs $75k-100k, 4.5% for AGIs over 100k)
Total tax: $4,310 (reported on 60.4% of returns)
30223:
$4,310
State:
$8,223
(% of AGI for various income ranges: 2.5% for AGIs below $10k, 2.7% for AGIs $10k-25k, 5.4% for AGIs $25k-50k, 7.9% for AGIs $50k-75k, 9.4% for AGIs $75k-100k, 17.1% for AGIs over 100k)
Earned income credit: $2,075 (reported on 35.3% of returns)
Here:
$2,075
State:
$1,986
Percentage of individuals using paid preparers for their 2004 taxes: 65.8%
Here:
66%
State:
62%
(% for various income ranges: 60.4% for AGIs below $10k, 72.0% for AGIs $10k-25k, 64.7% for AGIs $25k-50k, 60.7% for AGIs $50k-75k, 60.6% for AGIs $75k-100k, 71.9% for AGIs over 100k)
Likely homosexual households (counted as self-reported same-sex unmarried-partner households)
Lesbian couples: 0.1% of all households
Gay men: 0.0% of all households
Household received Food Stamps/SNAP in the past 12 months: 3,654 Household did not receive Food Stamps/SNAP in the past 12 months: 11,686
Women who had a birth in the past 12 months: 553 (153 now married, 398 unmarried) Women who did not have a birth in the past 12 months: 7,413 (2,271 now married, 5,149 unmarried)
Housing units in zip code 30223 with a mortgage: 5,546 (362 second mortgage, 29 home equity loan, 265 both second mortgage and home equity loan) Houses without a mortgage: 88
Median monthly owner costs for units with a mortgage: $1,274 Median monthly owner costs for units without a mortgage: $481
Residents with income below the poverty level in 2022:
This zip code:
18.9%
Whole state:
12.7%
Residents with income below 50% of the poverty level in 2022:
This zip code:
9.7%
Whole state:
6.3%
Median number of rooms in houses and condos:
Here:
6.2
State:
6.8
Median number of rooms in apartments:
Here:
4.7
State:
4.6
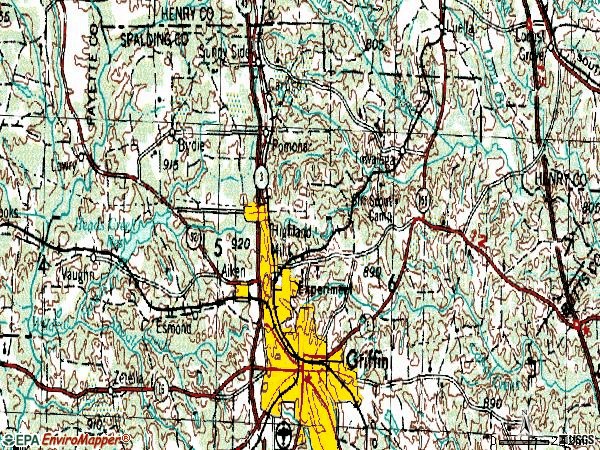
Notable locations in this zip code not listed on our city pages
Notable locations in zip code 30223: Camp Jackson (A), Cabin Creek Golf Course (B), Griffin Country Club (C), Pirkle Campground (D), Griffin Fire and Rescue Station 1 (E), Griffin Fire and Rescue Station 2 (F), Spalding County Jail (G), Spalding County Courthouse (H), Hawkes Library (I), Griffin City Hall (J), Spalding County Fire Department Station 6 (K), Spalding County Fire Department Station 4 (L), Spalding County Fire Department Station 3 (M). Display/hide their locations on the map
Shopping Centers: Dovedown Shopping Center (1), Ellis Crossing Shopping Center (2), Expressway Village Shopping Center (3), North Griffin Square Shopping Center (4), Northgate Shopping Center (5), Oxford Village Shopping Center (6), Spalding Village Shopping Center (7), Vineyard Village Shopping Center (8), West Solomon Shopping Center (9). Display/hide their locations on the map
Churches in zip code 30223 include: Zion Temple Holiness Church (A), Wolf Creek Baptist Church (B), Will of God Apostolic Church (C), West Griffin Holiness Church (D), Wesleyan Methodist Church (E), Vineyard Baptist Church (F), Victory Tabernacle Church of God (G), Vaughn Church (H), United Church (I). Display/hide their locations on the map
Cemeteries: Blanton Cemetery (1), Manley Cemetery (2), Bostick Cemetery (3), Breed Cemetery (4), Slayton Cemetery (5), New Oak Cemetery (6), Stonewall Cemetery (7). Display/hide their locations on the map
Reservoirs: Central Lake (A), Heads Creek Reservoir (B), Southern Fruit Lake B (C), Williams Lake (D), Dougherty Lake (E), Shappard Lake (F), Upper Towaliga Reservoir (G), Cheatam Lake (H). Display/hide their locations on the map
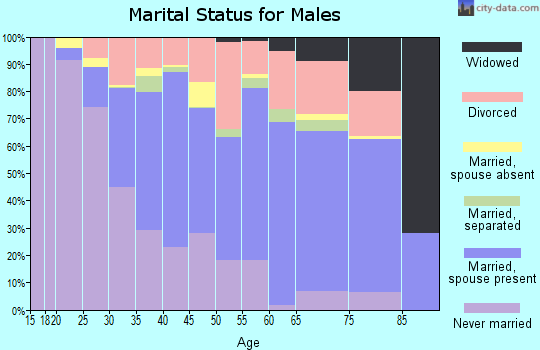
2,507 married couples with children.
3,848 single-parent households (955 men, 2,893 women).
92.9% of residents of 30223 zip code speak English at home.
5.3% of residents speak Spanish at home (63% very well, 23% well, 12% not well, 3% not at all).
1.0% of residents speak other Indo-European language at home (51% very well, 38% well, 12% not well).
0.6% of residents speak Asian or Pacific Island language at home (72% very well, 28% not well).
0.1% of residents speak other language at home (100% very well).
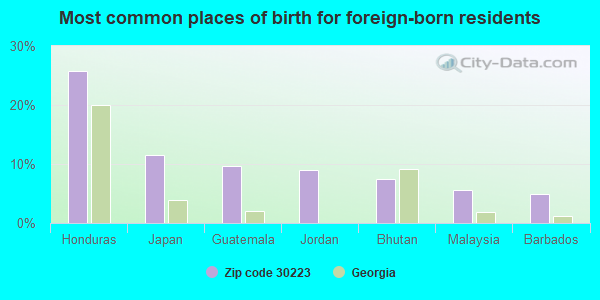
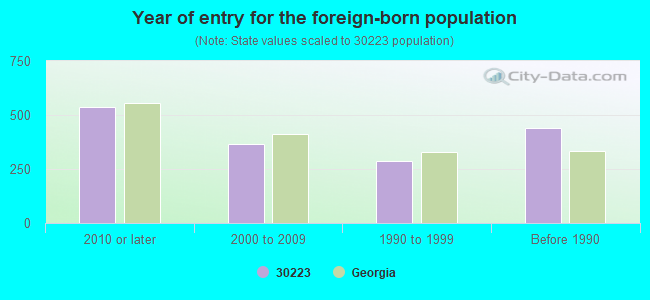
Foreign born population: 1,362 (3.6%) (44.0% of them are naturalized citizens)
Major facilities with environmental interests located in this zip code:
BANDAG INCORPORATED GRIFFIN PLANT (801 GREENBELT PARKWAY in GRIFFIN, GA)
AIR SYNTHETIC MINOR (AIRS/AFS) STATE MASTER (Georgia's Geographic Environmental Information) - UST-1, UNDERGROUND STORAGE TANK PROGRAM, UST-10, UST-2, UST-3, UST-4, UST-5, UST-6, UST-8, UST-9, UST-FUEL, UST-7, (Integrated Compliance Information System) - ICIS-04-2001-1750, FORMAL ENFORCEMENT ACTION CRITERIA AND HAZARDOUS AIR POLLUTANT INVENTORY (Inventory of air pollution sources) Conditionally Exempt Small Quantity Generators, less than 100 kg/month of hazardous waste (Resource Conservation and Recovery Act (tracking hazardous waste)) - notification TRI REPORTER (Tracking of toxic chemicals releasing facilities) Business SIC classification: TIRES AND INNER TUBES Organizations: BANDAG INC (CONTACT/OWNER)
, ED ENGEL (CONTACT/OWNER)
, WATKINS SERVICE COMP (INSTALLER)
R.E.S.A. ACADEMY (814 EXPERIMENT ST. in GRIFFIN, GA)
(National Center for Education Statistics) - STATE ID-6501 (National Center for Education Statistics) - STATE ID-6599 Organizations: GRIFFIN RESA (SCHOOL DISTRICT)
, SPALDING COUNTY (SCHOOL DISTRICT)
10TH & TAYLOR AMOCO (401 W TAYLOR STREET in GRIFFIN, GA)
STATE MASTER (Georgia's Geographic Environmental Information) - UST-2, UNDERGROUND STORAGE TANK PROGRAM, UST-3, UST-4, UST-5, UST-1, Conditionally Exempt Small Quantity Generators, less than 100 kg/month of hazardous waste (Resource Conservation and Recovery Act (tracking hazardous waste)) - notification Organizations: STEVE MITCHELL (CONTACT/OWNER)
, WILLIS PETRO FOODS (CONTACT/OWNER)
, SCOTT'S PETROLEUM IN (INSTALLER)
BYPASS AMOCO (1498 KALAMAZOO ROAD in GRIFFIN, GA)
STATE MASTER (Georgia's Geographic Environmental Information) - UST-1, UNDERGROUND STORAGE TANK PROGRAM, UST-2, UST-3, UST-4, Conditionally Exempt Small Quantity Generators, less than 100 kg/month of hazardous waste (Resource Conservation and Recovery Act (tracking hazardous waste)) - notification Organizations: ENVIROPRO SERVICES LLC (CONTACT/AGENT)
, STEVE MITCHELL (CONTACT/OWNER)
, WILLIS OIL CO (CONTACT/OWNER)
Alternative names: BY PASS AMOCO
MCINTOSH AMOCO (1408 W EXPRESSWAY in GRIFFIN, GA)
STATE MASTER (Georgia's Geographic Environmental Information) - UST-1, UNDERGROUND STORAGE TANK PROGRAM, UST-2, UST-235074, UST-296006, UST-3, UST-296020, UST-235061, UST-296019, UST-4, Conditionally Exempt Small Quantity Generators, less than 100 kg/month of hazardous waste (Resource Conservation and Recovery Act (tracking hazardous waste)) - notification Organizations: WILLIS OIL CO (CONTACT/OWNER)
, WILLIS PETRO FOODS (CONTACT/OWNER)
, ESTES EQUIP CO (INSTALLER)
Alternative names: MCINTOSH AMOCO/WILLIS OIL CO
AMOCO TIRE & BATTERY (103 S 8TH STREET in GRIFFIN, GA)
STATE MASTER (Georgia's Geographic Environmental Information) - UST-1, UNDERGROUND STORAGE TANK PROGRAM, UST-2, UST-3, UST-4, Conditionally Exempt Small Quantity Generators, less than 100 kg/month of hazardous waste (Resource Conservation and Recovery Act (tracking hazardous waste)) - notification Organizations: STEVE MITCHELL (CONTACT/OWNER)
, WILL HILL NEWTON (CONTACT/OWNER)
EXOPACK LLC (1304 ARTHUR K. BOLTON PARKWAY in GRIFFIN, GA)
AIR MAJOR (AIRS/AFS) HAZARDOUS WASTE BIENNIAL REPORTER (Resource Conservation and Recovery Act (tracking hazardous waste)) Large Quantity Generators, more that 1000 kg of hazardous waste/month (Resource Conservation and Recovery Act (tracking hazardous waste)) Organizations: OPERNAME (CONTACT/OPERATOR)
, UNION CAMP CORP (CONTACT/OWNER)
Alternative names: INTERNATIONAL PAPER COMPANY, UNION CAMP FLEXIBLE PACKAGING FACILITY
A.Z. KELSEY MIDDLE SCHOOL (200 KELSEY AVENUE in GRIFFIN, GA)
(National Center for Education Statistics) - STATE ID-2054 Organizations: SPALDING COUNTY (SCHOOL DISTRICT)
ATKINSON ELEMENTARY SCHOOL (307 ATKINSON DRIVE in GRIFFIN, GA)
(National Center for Education Statistics) - STATE ID-1550 Organizations: SPALDING COUNTY (SCHOOL DISTRICT)
OPPORTUNITY ACADEMY (205 SPALDING DRIVE in GRIFFIN, GA)
(National Center for Education Statistics) - STATE ID-6799 Organizations: SPALDING COUNTY (SCHOOL DISTRICT)
JORDAN HILL ROAD ELEMENTARY SCHOOL (75 JORDAN HILL ROAD in GRIFFIN, GA)
(National Center for Education Statistics) - STATE ID-0195 Organizations: SPALDING COUNTY (SCHOOL DISTRICT)
ORRS ELEMENTARY SCHOOL (205 SPALDING DRIVE in GRIFFIN, GA)
(National Center for Education Statistics) - STATE ID-4052 Organizations: SPALDING COUNTY (SCHOOL DISTRICT)
POMONA PRODUCTS COMPANY (101 PIMIENTO AVENUE in GRIFFIN, GA)
AIR MINOR (AIRS/AFS) (Resource Conservation and Recovery Act (tracking hazardous waste)) Business SIC classification: CANNED FRUITS, VEGETABLES, PRESERVES, JAMS, AND JELLIES Business NAICS classification: FRUIT AND VEGETABLE CANNING. Organizations: OPERNAME (CONTACT/OPERATOR)
, OWNERNAME (CONTACT/OWNER)
Alternative names: POMONA PRODUCTS CO/DIV CHEROKEE
Housing units lacking complete plumbing facilities: 1.5% Housing units lacking complete kitchen facilities: 1.9%
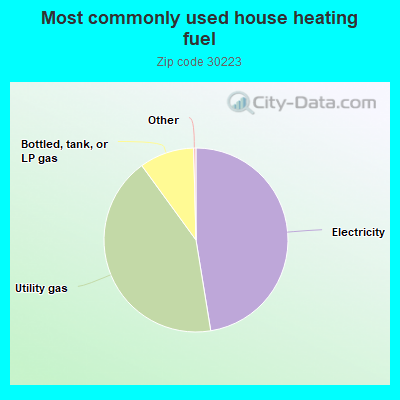
47.4%Electricity
42.5%Utility gas
9.6%Bottled, tank, or LP gas
Population in 1990: 53,247.
Place of birth for U.S.-born residents:
This state: 26,614
Northeast: 1,305
Midwest: 2,243
South: 4,328
West: 1,211
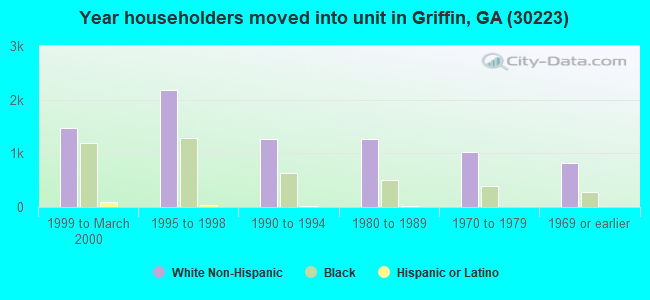
54% of the 30223 zip code residents lived in the same house 5 years ago. Out of people who lived in different houses, 63% lived in this county. Out of people who lived in different counties, 50% lived in Georgia.
91% of the 30223 zip code residents lived in the same house 1 year ago. Out of people who lived in different houses, 25% moved from this county. Out of people who lived in different houses, 46% moved from different county within same state. Out of people who lived in different houses, 28% moved from different state. Out of people who lived in different houses, 4% moved from abroad.
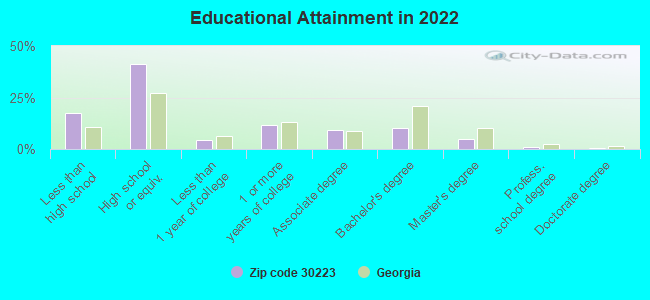
Private vs. public school enrollment:
Students in private schools in grades 1 to 8 (elementary and middle school): 446
Here:
11.3%
Georgia:
12.1%
Students in private schools in grades 9 to 12 (high school): 189
Here:
10.5%
Georgia:
10.8%
Students in private undergraduate colleges: 17
Here:
2.0%
Georgia:
17.1%
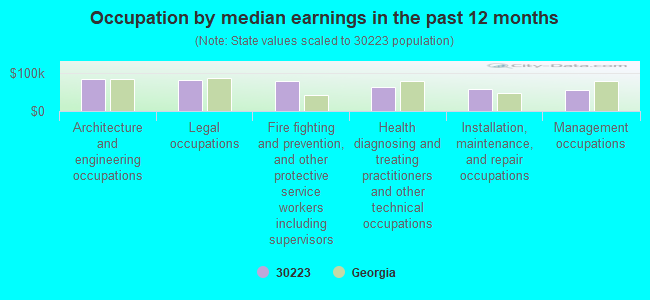
Occupation by median earnings in the past 12 months ($)
82,423Architecture and engineering occupations
80,182Legal occupations
78,460Fire fighting and prevention, and other protective service workers including supervisors
63,091Health diagnosing and treating practitioners and other technical occupations
57,689Installation, maintenance, and repair occupations
55,607Management occupations
Top industries in this zip code by the number of employees in 2005:
2002 - 2018 National Fire Incident Reporting System (NFIRS) incidents
According to the data from the years 2002 - 2018 the average number of fires per year is 126. The highest number of reported fire incidents - 297 took place in 2016, and the least - 1 in 2005. The data has a decreasing trend.
When looking into fire subcategories, the most reports belonged to: Structure Fires (41.1%), and Outside Fires (36.1%).
Fire incident types reported to NFIRS in Zip Code 30223


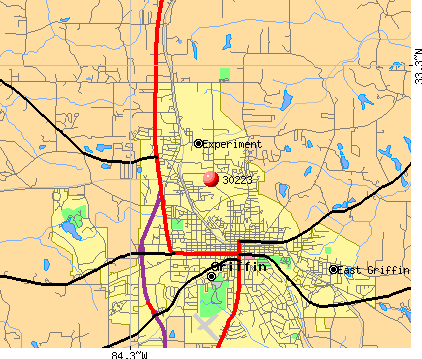 Nearest zip codes: 30284, 30224, 30228, 30250, 30292, 30257.


 According to the data from the years 2002 - 2018 the average number of fires per year is 126. The highest number of reported fire incidents - 297 took place in 2016, and the least - 1 in 2005. The data has a decreasing trend.
 When looking into fire subcategories, the most reports belonged to: Structure Fires (41.1%), and Outside Fires (36.1%).