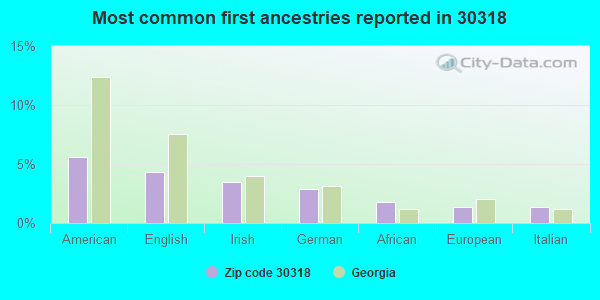
Estimated zip code population in 2022: 60,617 Zip code population in 2010: 49,736 Zip code population in 2000: 53,229
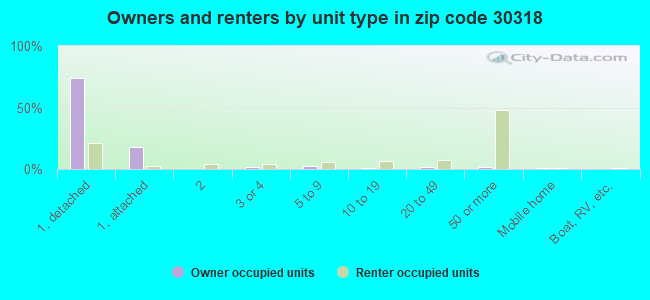
Houses and condos: 29,846 Renter-occupied apartments: 15,836
% of renters here:
61%
State:
34%
March 2022 cost of living index in zip code 30318: 104.7 (near average, U.S. average is 100)
Land area: 20.4 sq. mi. Water area: 0.2 sq. mi.
Population density: 2,977 people per square mile
(average).
OSM Map
General Map
Google Map
MSN Map
OSM Map
General Map
Google Map
MSN Map
OSM Map
General Map
Google Map
MSN Map
OSM Map
General Map
Google Map
MSN Map
Please wait while loading the map...
Real estate property taxes paid for housing units in 2022:
This zip code:
0.7% ($3,126)
Georgia:
0.7% ($2,160)
Median real estate property taxes paid for housing units with mortgages in 2022: $4,195 (0.8%) Median real estate property taxes paid for housing units with no mortgage in 2022: $1,154 (0.5%)
Averages for the 2020 tax year for zip code 30318, filed in 2021:
Average Adjusted Gross Income (AGI) in 2020: $77,086 (Individual Income Tax Returns)
Here:
$77,086
State:
$70,847
Salary/wage: $69,258 (reported on 87.2% of returns)
Here:
$69,258
State:
$59,126
(% of AGI for various income ranges: 1137.9% for AGIs below $25k, 3765.6% for AGIs $25k-50k, 7531.4% for AGIs $50k-75k, 11242.8% for AGIs $75k-100k, 20757.5% for AGIs $100k-200k, 86107.5% for AGIs over 200k)
Taxable interest for individuals: $1,349 (reported on 21.2% of returns)
This zip code:
$1,349
Georgia:
$2,011
(% of AGI for various income ranges: 4.3% for AGIs below $25k, 6.4% for AGIs $25k-50k, 11.6% for AGIs $50k-75k, 38.6% for AGIs $75k-100k, 66.8% for AGIs $100k-200k, 707.2% for AGIs over 200k)
Ordinary dividends: $5,403 (reported on 19.4% of returns)
Here:
$5,403
State:
$8,996
(% of AGI for various income ranges: 11.0% for AGIs below $25k, 18.6% for AGIs $25k-50k, 44.8% for AGIs $50k-75k, 140.3% for AGIs $75k-100k, 248.7% for AGIs $100k-200k, 2657.4% for AGIs over 200k)
Net capital gain/loss in AGI: +$17,912 (reported on 18.9% of returns)
Here:
+$17,912
State:
+$28,402
(% of AGI for various income ranges: 8.4% for AGIs below $25k, 22.6% for AGIs $25k-50k, 90.5% for AGIs $50k-75k, 161.9% for AGIs $75k-100k, 480.3% for AGIs $100k-200k, 10802.6% for AGIs over 200k)
Profit/loss from business: +$10,828 (reported on 24.8% of returns)
Here:
+$10,828
State:
+$6,707
(% of AGI for various income ranges: 54.2% for AGIs below $25k, 50.4% for AGIs $25k-50k, 196.6% for AGIs $50k-75k, 290.4% for AGIs $75k-100k, 584.3% for AGIs $100k-200k, 6486.6% for AGIs over 200k)
Taxable individual retirement arrangement distribution: $18,342 (reported on 3.0% of returns)
30318:
$18,342
Georgia:
$20,525
(% of AGI for various income ranges: 9.9% for AGIs below $25k, 26.7% for AGIs $25k-50k, 57.0% for AGIs $50k-75k, 96.3% for AGIs $75k-100k, 214.3% for AGIs $100k-200k, 863.2% for AGIs over 200k)
Self-employed (Keogh) retirement plans: $29,443 (reported on 0.8% of returns)
30318:
$29,443
Georgia:
$27,751
(% of AGI for various income ranges: 17.9% for AGIs $50k-75k, 29.5% for AGIs $100k-200k, 763.2% for AGIs over 200k)
Total itemized deductions: $30,541 (reported on 14.9% of returns)
Here:
$30,541
State:
$34,001
(% of AGI for various income ranges: 29.3% for AGIs below $25k, 122.0% for AGIs $25k-50k, 396.7% for AGIs $50k-75k, 818.2% for AGIs $75k-100k, 1784.2% for AGIs $100k-200k, 8401.3% for AGIs over 200k)
Charity contributions: $10,277 (reported on 12.4% of returns)
Here:
$10,277
State:
$14,164
(% of AGI for various income ranges: 4.7% for AGIs below $25k, 26.7% for AGIs $25k-50k, 86.3% for AGIs $50k-75k, 157.2% for AGIs $75k-100k, 354.3% for AGIs $100k-200k, 3077.6% for AGIs over 200k)
Taxes paid: $8,357 (reported on 14.9% of returns)
30318:
$8,357
State:
$7,540
(% of AGI for various income ranges: 6.6% for AGIs below $25k, 23.9% for AGIs $25k-50k, 110.2% for AGIs $50k-75k, 287.1% for AGIs $75k-100k, 628.4% for AGIs $100k-200k, 1839.4% for AGIs over 200k)
Earned income credit: $2,588 (reported on 21.8% of returns)
Here:
$2,588
State:
$2,530
(% of AGI for various income ranges: 144.9% for AGIs below $25k, 73.0% for AGIs $25k-50k)
Percentage of individuals using paid preparers for their 2020 taxes: 93.1%
Here:
93%
State:
93%
(% for various income ranges: 91.5% for AGIs below $25k, 93.4% for AGIs $25k-50k, 93.5% for AGIs $50k-75k, 93.4% for AGIs $75k-100k, 94.8% for AGIs $100k-200k, 96.1% for AGIs over 200k)
Averages for the 2012 tax year for zip code 30318, filed in 2013:
Average Adjusted Gross Income (AGI) in 2012: $56,872 (Individual Income Tax Returns)
Here:
$56,872
State:
$56,131
Salary/wage: $49,269 (reported on 85.5% of returns)
Here:
$49,269
State:
$47,942
(% of AGI for various income ranges: 79.9% for AGIs below $25k, 88.8% for AGIs $25k-50k, 85.8% for AGIs $50k-75k, 84.1% for AGIs $75k-100k, 85.6% for AGIs $100k-200k, 54.2% for AGIs over 200k)
Taxable interest for individuals: $1,280 (reported on 20.4% of returns)
This zip code:
$1,280
Georgia:
$1,706
(% of AGI for various income ranges: 1.2% for AGIs below $25k, 0.3% for AGIs $25k-50k, 0.4% for AGIs $50k-75k, 0.4% for AGIs $75k-100k, 0.4% for AGIs $100k-200k, 0.3% for AGIs over 200k)
Ordinary dividends: $6,821 (reported on 14.3% of returns)
Here:
$6,821
State:
$7,265
(% of AGI for various income ranges: 1.0% for AGIs below $25k, 0.9% for AGIs $25k-50k, 1.3% for AGIs $50k-75k, 1.4% for AGIs $75k-100k, 1.6% for AGIs $100k-200k, 2.5% for AGIs over 200k)
Net capital gain/loss in AGI: +$9,069 (reported on 11.3% of returns)
Here:
+$9,069
State:
+$16,323
(% of AGI for various income ranges: 0.3% for AGIs below $25k, 0.2% for AGIs $25k-50k, 0.5% for AGIs $50k-75k, 0.9% for AGIs $75k-100k, 0.9% for AGIs $100k-200k, 4.0% for AGIs over 200k)
Profit/loss from business: +$9,735 (reported on 22.1% of returns)
Here:
+$9,735
State:
+$7,583
(% of AGI for various income ranges: 9.3% for AGIs below $25k, 1.0% for AGIs $25k-50k, 2.1% for AGIs $50k-75k, 2.4% for AGIs $75k-100k, 3.1% for AGIs $100k-200k, 4.2% for AGIs over 200k)
Taxable individual retirement arrangement distribution: $16,233 (reported on 3.6% of returns)
30318:
$16,233
Georgia:
$17,199
(% of AGI for various income ranges: 0.7% for AGIs below $25k, 0.9% for AGIs $25k-50k, 1.4% for AGIs $50k-75k, 1.5% for AGIs $75k-100k, 1.3% for AGIs $100k-200k, 0.8% for AGIs over 200k)
Self-employment retirement plans: $23,980 (reported on 0.7% of returns)
30318:
$23,980
Georgia:
$23,277
(% of AGI for various income ranges: 0.2% for AGIs below $25k, 0.2% for AGIs $100k-200k, 0.6% for AGIs over 200k)
Total itemized deductions: $25,424 (18% of AGI, reported on 28.8% of returns)
Here:
$25,424
State:
$23,886
Here:
18.5% of AGI
State:
21.5% of AGI
(% of AGI for various income ranges: 5.4% for AGIs below $25k, 10.7% for AGIs $25k-50k, 14.4% for AGIs $50k-75k, 15.8% for AGIs $75k-100k, 16.9% for AGIs $100k-200k, 12.7% for AGIs over 200k)
Charity contributions: $5,298 (reported on 23.9% of returns)
Here:
$5,298
State:
$5,507
(% of AGI for various income ranges: 0.6% for AGIs below $25k, 2.0% for AGIs $25k-50k, 2.2% for AGIs $50k-75k, 2.2% for AGIs $75k-100k, 2.1% for AGIs $100k-200k, 2.9% for AGIs over 200k)
Taxes paid: $9,444 (reported on 28.5% of returns)
30318:
$9,444
State:
$7,838
(% of AGI for various income ranges: 0.9% for AGIs below $25k, 2.1% for AGIs $25k-50k, 4.0% for AGIs $50k-75k, 5.3% for AGIs $75k-100k, 6.8% for AGIs $100k-200k, 5.9% for AGIs over 200k)
Earned income credit: $2,635 (reported on 28.5% of returns)
Here:
$2,635
State:
$2,589
(% of AGI for various income ranges: 10.7% for AGIs below $25k, 0.8% for AGIs $25k-50k)
Percentage of individuals using paid preparers for their 2012 taxes: 46.3%
Here:
46%
State:
55%
(% for various income ranges: 45.5% for AGIs below $25k, 43.2% for AGIs $25k-50k, 44.4% for AGIs $50k-75k, 46.3% for AGIs $75k-100k, 51.1% for AGIs $100k-200k, 66.7% for AGIs over 200k)
Averages for the 2004 tax year for zip code 30318, filed in 2005:
Average Adjusted Gross Income (AGI) in 2004: $40,571 (Individual Income Tax Returns)
Here:
$40,571
State:
$47,553
Salary/wage: $36,420 (reported on 87.9% of returns)
Here:
$36,420
State:
$42,178
(% of AGI for various income ranges: 119.7% for AGIs below $10k, 88.2% for AGIs $10k-25k, 87.7% for AGIs $25k-50k, 84.3% for AGIs $50k-75k, 83.2% for AGIs $75k-100k, 66.7% for AGIs over 100k)
Taxable interest for individuals: $1,394 (reported on 25.3% of returns)
This zip code:
$1,394
Georgia:
$1,772
(% of AGI for various income ranges: 3.1% for AGIs below $10k, 0.6% for AGIs $10k-25k, 0.5% for AGIs $25k-50k, 0.7% for AGIs $50k-75k, 0.8% for AGIs $75k-100k, 1.1% for AGIs over 100k)
Taxable dividends: $4,223 (reported on 16.4% of returns)
Here:
$4,223
State:
$4,283
(% of AGI for various income ranges: 3.6% for AGIs below $10k, 0.4% for AGIs $10k-25k, 0.7% for AGIs $25k-50k, 1.2% for AGIs $50k-75k, 1.5% for AGIs $75k-100k, 2.8% for AGIs over 100k)
Net capital gain/loss: +$12,509 (reported on 13.2% of returns)
Here:
+$12,509
State:
+$16,461
(% of AGI for various income ranges: 3.9% for AGIs below $10k, 0.2% for AGIs $10k-25k, 0.4% for AGIs $25k-50k, 1.0% for AGIs $50k-75k, 1.6% for AGIs $75k-100k, 8.8% for AGIs over 100k)
Profit/loss from business: +$10,426 (reported on 13.9% of returns)
Here:
+$10,426
State:
+$8,201
(% of AGI for various income ranges: 10.1% for AGIs below $10k, 3.9% for AGIs $10k-25k, 1.4% for AGIs $25k-50k, 2.3% for AGIs $50k-75k, 3.0% for AGIs $75k-100k, 4.8% for AGIs over 100k)
IRA payment deduction: $2,583 (reported on 1.2% of returns)
30318:
$2,583
Georgia:
$2,969
(% of AGI for various income ranges: 0.1% for AGIs $10k-25k, 0.1% for AGIs $25k-50k, 0.1% for AGIs $50k-75k, 0.1% for AGIs $75k-100k, 0.0% for AGIs over 100k)
Self-employed pension: $19,199 (reported on 1.0% of returns)
Here:
$19,199
Georgia:
$16,203
(% of AGI for various income ranges: 0.1% for AGIs $25k-50k, 0.2% for AGIs $50k-75k, 0.1% for AGIs $75k-100k, 1.0% for AGIs over 100k)
Total itemized deductions: $19,698 (23% of AGI, reported on 32.1% of returns)
Here:
$19,698
State:
$19,944
Here:
23.1% of AGI
State:
22.6% of AGI
(% of AGI for various income ranges: 11.1% for AGIs below $10k, 9.4% for AGIs $10k-25k, 15.3% for AGIs $25k-50k, 18.3% for AGIs $50k-75k, 20.6% for AGIs $75k-100k, 16.0% for AGIs over 100k)
Charity contributions deductions: $3,755 (4% of AGI, reported on 26.7% of returns)
Here:
$3,755
State:
$4,354
Here:
4.0% of AGI
State:
4.7% of AGI
(% of AGI for various income ranges: 0.7% for AGIs below $10k, 1.0% for AGIs $10k-25k, 2.8% for AGIs $25k-50k, 2.9% for AGIs $50k-75k, 3.0% for AGIs $75k-100k, 2.6% for AGIs over 100k)
Total tax: $8,079 (reported on 64.2% of returns)
30318:
$8,079
State:
$8,223
(% of AGI for various income ranges: 3.4% for AGIs below $10k, 3.3% for AGIs $10k-25k, 7.2% for AGIs $25k-50k, 11.4% for AGIs $50k-75k, 12.9% for AGIs $75k-100k, 19.6% for AGIs over 100k)
Earned income credit: $2,184 (reported on 32.0% of returns)
Here:
$2,184
State:
$1,986
Percentage of individuals using paid preparers for their 2004 taxes: 57.7%
Here:
58%
State:
62%
(% for various income ranges: 57.7% for AGIs below $10k, 61.2% for AGIs $10k-25k, 52.7% for AGIs $25k-50k, 52.0% for AGIs $50k-75k, 55.8% for AGIs $75k-100k, 64.5% for AGIs over 100k)
Likely homosexual households (counted as self-reported same-sex unmarried-partner households)
Lesbian couples: 0.2% of all households
Gay men: 0.8% of all households
Household received Food Stamps/SNAP in the past 12 months: 4,330 Household did not receive Food Stamps/SNAP in the past 12 months: 22,070
Women who had a birth in the past 12 months: 1,132 (700 now married, 431 unmarried) Women who did not have a birth in the past 12 months: 17,900 (3,740 now married, 14,194 unmarried)
Housing units in zip code 30318 with a mortgage: 7,501 (629 second mortgage, 591 both second mortgage and home equity loan) Houses without a mortgage: 83
Median monthly owner costs for units with a mortgage: $2,083 Median monthly owner costs for units without a mortgage: $432
Residents with income below the poverty level in 2022:
This zip code:
18.2%
Whole state:
12.7%
Residents with income below 50% of the poverty level in 2022:
This zip code:
7.9%
Whole state:
6.3%
Median number of rooms in houses and condos:
Here:
6.2
State:
6.8
Median number of rooms in apartments:
Here:
3.9
State:
4.6
Notable locations in this zip code not listed on our city pages
Notable locations in zip code 30318: Neely Nuclear Research Center (A), Chattahoochee Station (B), Bankhead Station (C), Northside Drive Station (D), Perry Holmes Station (E), Inman Yard (F), Bellwood Yard (G), Perry Holmes Recreation Center (H), Perry Holmes Library (I), Grove Park Recreation Center (J), Bowen Homes Recreation Center (K), Bowen Homes Library (L), Atlanta Fire / Rescue Station 08 (M), Atlanta Fire / Rescue Station 38 (N), Atlanta Fire / Rescue Station 28 (O), Atlanta Fire / Rescue Station 23 (P), Atlanta Fire / Rescue Station 22 (Q), Atlanta Precinct Number 1 Police Station (R), City Pumping Station Number 1 (S), Dogwood Branch Atlanta-Fulton Public Library (T). Display/hide their locations on the map
Shopping Centers: Simpson-Lanier Shopping Center (1), Hollywood Plaza Shopping Center (2), Moores Mill Shopping Center (3), Howell Mill Square Shopping Center (4). Display/hide their locations on the map
Churches in zip code 30318 include: Kingdom Hall of Jehovahs Witnesses (A), Faith Tabernacle Baptist Church (B), Good Samaritan Baptist Church (C), Truelove Baptist Church (D), New Cedar Creek Baptist Church (E), Deliverance Tabernacle Church (F), Bolton Hills Bible Church (G), First Baptist Church of Chattahoochee (H), Riverside Church of God (I). Display/hide their locations on the map
Streams, rivers, and creeks: A D Williams Creek (A), Proctor Creek (B), Nancy Creek (C), English Avenue Tributary (D). Display/hide their locations on the map
Parks in zip code 30318 include: Peyton Park (1), Carey Park (2), Dale Creek Park (3), Edwin Place Park (4), Gun Club Park (5), Rockdale Park (6), William T Knight Park (7), Williams Park (8), Brookview Park (9). Display/hide their locations on the map
Tourist attractions (not listed on the city page) : Atlanta Rocks Intown (Amusement & Theme Parks; 1019 Collier Road Northwest Suite A) (1), Recreational Solutions (Recreational Trips & Guides; 541 10th Street Northwest Ste 316) (2), Etaly Vacations (Tours & Charters; 1621 Jackson Way Northwest) (3). Display/hide their approximate locations on the map
4,409 married couples with children.
4,365 single-parent households (459 men, 3,906 women).
87.5% of residents of 30318 zip code speak English at home.
4.0% of residents speak Spanish at home (69% very well, 20% well, 10% not well, 1% not at all).
3.6% of residents speak other Indo-European language at home (78% very well, 19% well, 3% not well).
3.8% of residents speak Asian or Pacific Island language at home (75% very well, 22% well, 2% not well).
0.9% of residents speak other language at home (82% very well, 13% well, 4% not well).
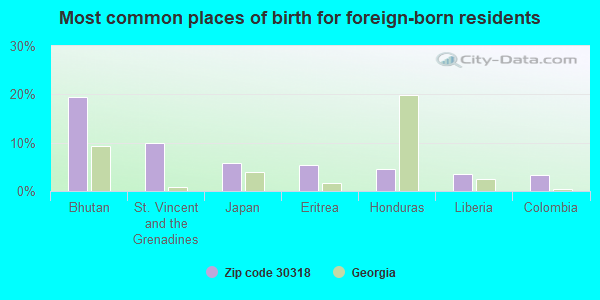
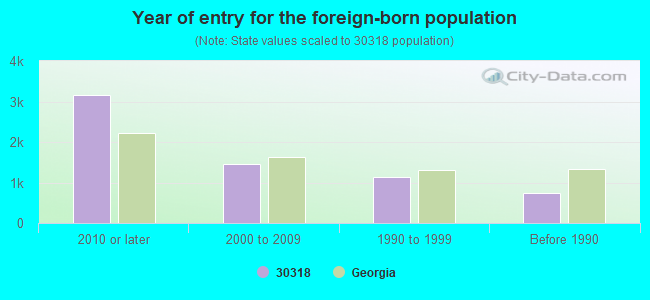
Foreign born population: 4,586 (7.6%) (31.8% of them are naturalized citizens)
Major facilities with environmental interests located in this zip code:
MARTA PERRY BLVD (1600 PERRY BLVD in ATLANTA, GA)
STATE MASTER (Georgia's Geographic Environmental Information) - UST-002#1988D, UNDERGROUND STORAGE TANK PROGRAM, UST-5, UST-001#1988U, UST-1, UST-2, UST-3, (Integrated Compliance Information System) - ICIS-04-2002-5024, FORMAL ENFORCEMENT ACTION Conditionally Exempt Small Quantity Generators, less than 100 kg/month of hazardous waste (Resource Conservation and Recovery Act (tracking hazardous waste)) Organizations: MARTA SAFETY OFFICE (CONTACT/OWNER)
Alternative names: MARTA PERRY BOULEVARD BUS OPERAT, OIL SPILL (METROPOLITAN ATLANTA RAPID TRANSIT AUTH. - MARTA)
BFI WASTE SYSTEMS OF NORTH AMERI (3045 BANKHEAD HWY in ATLANTA, GA)
AIR MINOR (AIRS/AFS) STATE MASTER (Georgia's Geographic Environmental Information) - UST-1, UNDERGROUND STORAGE TANK PROGRAM, UST-2, UST-3, (Resource Conservation and Recovery Act (tracking hazardous waste)) Business SIC classification: LOCAL TRUCKING WITHOUT STORAGE Organizations: OPERNAME (CONTACT/OPERATOR)
, BFI WASTE SYSTEMS OF GEORGIA (CONTACT/OWNER)
, BROWNING FERRIS INDUSTRIES (CONTACT/OWNER)
Alternative names: BROWNING-FERRIS INDUSTRIES INCORPORATED, BROWNING FERRIS IND OF GA INC
BST/HOLLYWOOD DR CO/F5102 (2071 HOLLYWOOD ROAD in ATLANTA, GA)
STATE MASTER (Georgia's Geographic Environmental Information) - UST-1, UNDERGROUND STORAGE TANK PROGRAM, UST-1A, UST-2, UST-3, UST-5, (Resource Conservation and Recovery Act (tracking hazardous waste)) Organizations: BELLSOUTH TEL INC (CONTACT/OPERATOR)
, OPERNAME (CONTACT/OPERATOR)
, OWNERNAME (CONTACT/OWNER)
, BELLSOUTH TELECOMMUNICATIONS (CONTACT/OWNER)
, UNDER CONSTRUCTION COMPANY (INSTALLER)
Alternative names: SOUTHERN BELL ATLNGAHR
ATLANTA R M CLAYTON WATER POLLUTION CONTROL PLANT (2440 BOLTON ROAD in ATLANTA, GA)
AIR MAJOR (AIRS/AFS) (Integrated Compliance Information System) - ICIS-04-1997-0531, FORMAL ENFORCEMENT ACTION COMPLIANCE ACTIVITY (Tracking inspections of insecticide, fungicide, and rodenticide, and toxic substances) CRITERIA AND HAZARDOUS AIR POLLUTANT INVENTORY (Inventory of air pollution sources) National Pollutant Discharge Elimination System MAJOR (Tracking pollutant discharge elimination systems) - permit Business SIC classification: SEWERAGE SYSTEMS Business NAICS classification: SEWAGE TREATMENT FACILITIES. Organizations: ATLANTA R.M. CLAYTON WPCP (CONTACT/OPERATOR)
, CITY OF ATLANTA (CONTACT/OWNER)
Alternative names: ATLANTA BUREAU OF POLLUTION CONTROL, ATLANTA R M CLAYTON WPCP, R.M. CLAYTON WATER RECLAMATION CENTER
LAFARGE BUILDING MATERIALS INCORPORATED (2520 PAUL AVENUE NW in ATLANTA, GA)
AIR MAJOR (AIRS/AFS) STATE MASTER (Georgia's Geographic Environmental Information) - UST-3, UNDERGROUND STORAGE TANK PROGRAM, UST-1, UST-2, UST-4, CRITERIA AND HAZARDOUS AIR POLLUTANT INVENTORY (Inventory of air pollution sources) Small Quantity Generators, between 100 kg and 1000 kg of hazardous waste/month (Resource Conservation and Recovery Act (tracking hazardous waste)) - notification TRI REPORTER (Tracking of toxic chemicals releasing facilities) Business SIC classification: CEMENT, HYDRAULIC Organizations: P S ENERGY GROUP INC (CONTACT/OPERATOR)
, LAFARGE BUILDING MATERIALS IN AT (CONTACT/OWNER)
, LAFARGE NORTH AMERICA INC (CONTACT/OWNER)
Alternative names: BLUE CIRCLE CEMENT, BLUE CIRCLE CEMENT - ATLANTA PLANT, LAFARGE BUILDING MATERIALS INC.
BANKHEAD ENTERPRISES (1080 BANKHEAD AVENUE NW in ATLANTA, GA)
STATE MASTER (Georgia's Geographic Environmental Information) - UST-1, UNDERGROUND STORAGE TANK PROGRAM, UST-2, UST-3, UST-4, (Resource Conservation and Recovery Act (tracking hazardous waste)) Organizations: OPERNAME (CONTACT/OPERATOR)
, BANKHEAD ENTERPRISES INC (CONTACT/OWNER)
, TRIANGLE PETRO (INSTALLER)
ACUITY SPECIALTY PRODUCTS GROU P INC. (1310 SEABOARD INDL. BLVD. in ATLANTA, GA)
AIR SYNTHETIC MINOR (AIRS/AFS) SUPERFUND (Superfund database) COMPLIANCE ACTIVITY (Tracking inspections of insecticide, fungicide, and rodenticide, and toxic substances) CRITERIA AND HAZARDOUS AIR POLLUTANT INVENTORY (Inventory of air pollution sources) HAZARDOUS WASTE BIENNIAL REPORTER (Resource Conservation and Recovery Act (tracking hazardous waste)) Large Quantity Generators, more that 1000 kg of hazardous waste/month (Resource Conservation and Recovery Act (tracking hazardous waste)) - notification TRI REPORTER (Tracking of toxic chemicals releasing facilities) Business SIC classification: SOAP AND OTHER DETERGENTS, EXCEPT SPECIALTY CLEANERS; SPECIALTY CLEANING, POLISHING, AND SANITATION PREPARATIONS; SURFACE ACTIVE AGENTS, FINISHING AGENTS, SULFONATED OILS, AND ASSISTANTS Business NAICS classification: SOAP AND OTHER DETERGENT MANUFACTURING.; SOAP AND OTHER DETERGENT MANUFACTURING.; POLISH AND OTHER SANITATION GOOD MANUFACTURING.; SURFACE ACTIVE AGENT MANUFACTURING. Organizations: OPERNAME (CONTACT/OPERATOR)
, ACUITY SPECIALTY PRODUCTS GROUP INC (CONTACT/OPERATOR)
, NATL SVC INDS (CONTACT/OWNER)
Alternative names: ACUITY SPECIALTY PRODS. GROUP INC. (DBA ZEP MFG.), ACUITY SPECIALTY PRODS. GROUP INC. (DBA ZEP MFG.), ACUITY SPECIALTY PRODS./ZEP MFG., ZEP MANUFACTURING COMPANY
BRINK'S INCORPORATED (1212 HUFF RD in ATLANTA, GA)
STATE MASTER (Georgia's Geographic Environmental Information) - UST-BR-1, UNDERGROUND STORAGE TANK PROGRAM, UST-BR-2, (Resource Conservation and Recovery Act (tracking hazardous waste)) Business NAICS classification: ARMORED CAR SERVICES. Organizations: BRINK'S US (CONTACT/OPERATOR)
, BRINKS INC (CONTACT/OWNER)
, SEYMOUR SERVICE CO I (INSTALLER)
Alternative names: BRINK'S US
ATLANTA FORGE AND FOUNDRY COMPANY (430 BISHOP ST in ATLANTA, GA)
STATE MASTER (Georgia's Geographic Environmental Information) - UST-1, UNDERGROUND STORAGE TANK PROGRAM, UST-2, UST-3, (Resource Conservation and Recovery Act (tracking hazardous waste)) Business NAICS classification: PRIMARY SMELTING AND REFINING OF NONFERROUS METAL (EXCEPT COPPER AND ALUMINUM).; SECONDARY SMELTING, REFINING, AND ALLOYING OF NONFERROUS METAL (EXCEPT COPPER AND ALUMINUM).; OTHER NONFERROUS FOUNDRIES (EXCEPT DIE-CASTING).; NONFERROUS FORGING. Organizations: ATLANTA FORGE & FOUNDRY (CONTACT/OPERATOR)
MOMAR INC (1830 ELLSWORTH INDUSTRIAL DRIVE in ATLANTA, GA)
STATE MASTER (New Jersey environmental info) - NJEMS-002497, PESTICIDES - MANUFACTURE (Resource Conservation and Recovery Act (tracking hazardous waste)) TRI REPORTER (Tracking of toxic chemicals releasing facilities) Business SIC classification: SOAP AND OTHER DETERGENTS, EXCEPT SPECIALTY CLEANERS Organizations: OPERNAME (CONTACT/OPERATOR)
, XXX (CONTACT/OWNER)
Alternative names: NOMAR INC
PURITAN CHURCHILL CHEMICAL COMPANY (916 ASHBY ST. in ATLANTA, GA)
AIR MINOR (AIRS/AFS) COMPLIANCE ACTIVITY (Tracking inspections of insecticide, fungicide, and rodenticide, and toxic substances) (Resource Conservation and Recovery Act (tracking hazardous waste)) TRI REPORTER (Tracking of toxic chemicals releasing facilities) Business SIC classification: SPECIALTY CLEANING, POLISHING, AND SANITATION PREPARATIONS Organizations: OPERNAME (CONTACT/OPERATOR)
, XXX (CONTACT/OWNER)
MARTA BRADY AVENUE GARAGE (1040 BRADY AVENUE in ATLANTA, GA)
STATE MASTER (Georgia's Geographic Environmental Information) - UST-11, UNDERGROUND STORAGE TANK PROGRAM, UST-12, UST-2, UST-4, UST-8, UST-9, UST-10, UST-5, UST-6, UST-1, UST-3, UST-14, UST-7, UST-13, UST-15, Conditionally Exempt Small Quantity Generators, less than 100 kg/month of hazardous waste (Resource Conservation and Recovery Act (tracking hazardous waste)) Organizations: OPERNAME (CONTACT/OPERATOR)
, MARTA SAFETY OFFICE (CONTACT/OWNER)
Alternative names: MARTA BRADY FACILITY
BP OIL CO (1695 NORTHSIDE DRIVE in ATLANTA, GA)
STATE MASTER (Georgia's Geographic Environmental Information) - UST-1, UNDERGROUND STORAGE TANK PROGRAM, UST-4, UST-2, UST-3, UST-5, Conditionally Exempt Small Quantity Generators, less than 100 kg/month of hazardous waste (Resource Conservation and Recovery Act (tracking hazardous waste)) - notification Organizations: PANGEAN CMD ASSOCIATES (CONTACT/AGENT)
, BP PRODUCTS NORTH AMERICA INC (CONTACT/OPERATOR)
, BP OIL CO. (CONTACT/OWNER)
Alternative names: BP #24034, BP #24034
Housing units lacking complete plumbing facilities: 1.0% Housing units lacking complete kitchen facilities: 1.5%
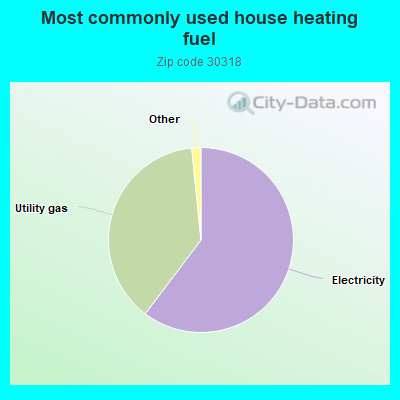
60.3%Electricity
38.1%Utility gas
0.6%Other fuel
0.5%No fuel used
Population in 1990: 53,894.
Place of birth for U.S.-born residents:
This state: 29,927
Northeast: 5,286
Midwest: 3,851
South: 12,960
West: 2,349
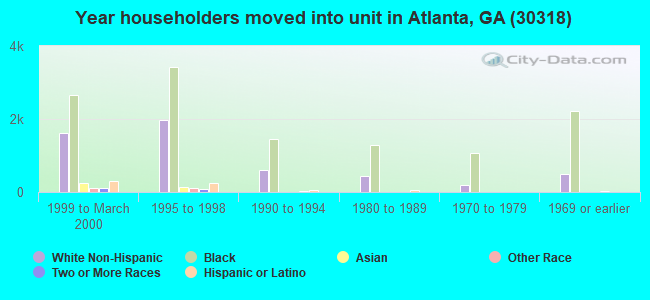
45% of the 30318 zip code residents lived in the same house 5 years ago. Out of people who lived in different houses, 53% lived in this county. Out of people who lived in different counties, 50% lived in Georgia.
79% of the 30318 zip code residents lived in the same house 1 year ago. Out of people who lived in different houses, 40% moved from this county. Out of people who lived in different houses, 35% moved from different county within same state. Out of people who lived in different houses, 20% moved from different state. Out of people who lived in different houses, 3% moved from abroad.
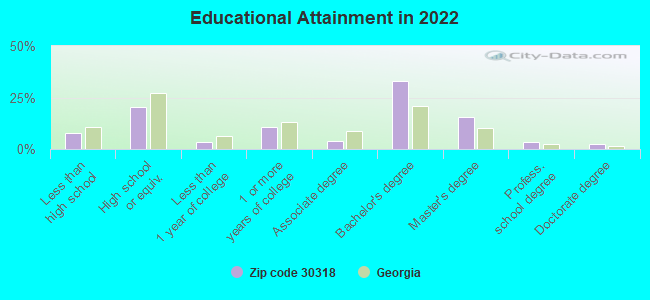
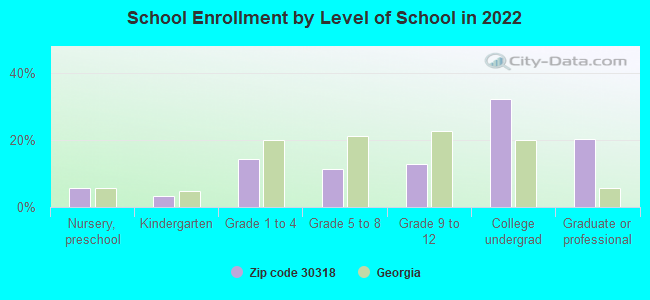
Private vs. public school enrollment:
Students in private schools in grades 1 to 8 (elementary and middle school): 948
Here:
22.7%
Georgia:
12.1%
Students in private schools in grades 9 to 12 (high school): 445
Here:
21.4%
Georgia:
10.8%
Students in private undergraduate colleges: 1,047
Here:
20.2%
Georgia:
17.1%
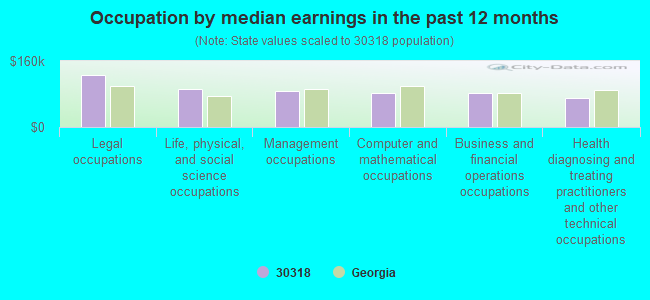
Occupation by median earnings in the past 12 months ($)
125,095Legal occupations
90,953Life, physical, and social science occupations
88,029Management occupations
82,587Computer and mathematical occupations
81,689Business and financial operations occupations
70,038Health diagnosing and treating practitioners and other technical occupations
Companies with biggest federal contracts located in this zip code (ATLANTA, GA):
CERMET INC (1019 COLLIER RD NW C-1; small business) : $6,327,716 in 29 contractsfrom 2000 to 2006
Contracts for Other Defense -- Operational Systems Development (R&D), Other Defense -- Applied Research and Exploratory Development (R&D), Other Defense -- Basic Research (R&D), Physical Sciences -- Management and Support (R&D), and moreby Air Force, Army, Navy Signed by year:2000: $826,702; 2001: $1,012,395; 2002: $1,583,005; 2003: $968,243; 2004: $320,669; 2005: $1,260,348; 2006: $356,354.
Biggest contracts:
$599,686 with Air Force for Other Defense -- Operational Systems Development (R&D). Signed on 2003-12-09. Completion date: 2005-04-29.
$499,536, same as above.Signed on 2002-09-25. Completion date: 2004-01-20.
$499,248 with Army for Other Defense -- Applied Research and Exploratory Development (R&D). Signed on 2005-05-19. Completion date: 2006-09-18.
$435,000 with Navy for Other Defense -- Basic Research (R&D). Signed on 2001-01-31. Completion date: 2002-09-28.
FIELDSTONE GLEN LP (1575 NORTHSIDE DR NW B; small business) : $2,665,049 in 18 contractsfrom 2003 to 2006
Contracts for Lodging - Hotel/Motel, Lease or Rental of Facilities -- Other Residential Buildings, Lease or Rental of Facilities -- Troop Housing Facilities by Army Signed by year:2000: $0; 2001: $0; 2002: $0; 2003: $1,509,616; 2004: $496,626; 2005: $451,554; 2006: $207,253.
Biggest contracts:
$1,040,070 with Army for Lodging - Hotel/Motel. Signed on 2003-11-26. Completion date: 2003-09-30.
$512,232, same as above.Signed on 2004-10-14. Completion date: 2003-09-30.
$469,546, same as above.Signed on 2003-04-11. Completion date: 2003-09-30.
$104,101 with Army for Lease or Rental of Facilities -- Other Residential Buildings. Signed on 2006-03-16. Completion date: 2006-09-30.
TIGHITCO, INC (1375 SEABOARD INDUSTRIAL B; small business) : $1,770,806 in 56 contractsfrom 2000 to 2006
Contracts for Vehicular Cab, Body, and Frame Structural Components, Aircraft Landing Equipment, Gas Turbines and Jet Engines, Aircraft; Prime Moving, and Components, Wallboard, Building Paper, and Thermal Insulation Materials, and moreby Defense Logistics Agency, Navy Signed by year:2000: $68,250; 2001: $906,986; 2002: $89,439; 2003: $15,595; 2004: $398,205; 2005: $259,013; 2006: $33,318.
Biggest contracts:
$735,186 with Defense Logistics Agency for Vehicular Cab, Body, and Frame Structural Components. Signed on 2001-12-05. Completion date: 2006-12-04.
$305,121 with Navy for Aircraft Landing Equipment. Taking place in FL. Signed on 2004-02-10. Completion date: 2004-05-07.
$68,250 with Defense Logistics Agency for Gas Turbines and Jet Engines, Aircraft; Prime Moving, and Components. Signed on 2000-06-02. Completion date: 2000-08-25.
$54,130 with Defense Logistics Agency for Wallboard, Building Paper, and Thermal Insulation Materials. Signed on 2001-12-19. Completion date: 2002-02-16.
PIEDMONT NATIONAL CORPORATION (1561 SOUTHLAND CIR NW; small business) : $1,041,412 in 3 contractsfrom 2002 to 2004
$718,965 with Air Force for Wrapping and Packaging Machinery. Signed on 2002-07-03. Completion date: 2002-12-31.
$319,297, same as above.Signed on 2002-09-30. Completion date: 2002-12-19.
$3,150 with Defense Logistics Agency for Packaging and Packing Bulk Materials. Signed on 2004-12-16. Completion date: 2004-12-24.
SOUTHERN FLUID SYSTEMS INC (1785 MACARTHUR BLVD NW B; small business) : $1,039,248 in 16 contractsfrom 2001 to 2005
Contracts for Miscellaneous Maintenance and Repair Shop Specialized Equipment, Maintenance, Repair and Rebuilding of Equipment -- Maintenance and Repair Shop Equipment, Miscellaneous Items, Maintenance, Repair and Rebuilding of Equipment -- Miscellaneous, and moreby Navy, Air Force, Defense Logistics Agency Signed by year:2000: $0; 2001: $53,376; 2002: $147,513; 2003: $36,970; 2004: $146,142; 2005: $655,247; 2006: $0.
Biggest contracts:
$280,450 with Navy for Miscellaneous Maintenance and Repair Shop Specialized Equipment. Signed on 2005-09-29. Completion date: 2006-01-31.
$167,012 with Navy for Maintenance, Repair and Rebuilding of Equipment -- Maintenance and Repair Shop Equipment. Signed on 2005-06-14. Completion date: 2005-04-01.
$147,513 with Navy for Miscellaneous Items. Signed on 2002-04-09. Completion date: 2002-05-30.
$84,125 with Air Force for Maintenance, Repair and Rebuilding of Equipment -- Miscellaneous. Signed on 2005-06-15. Completion date: 2005-07-29.
WESTREX CORPORATION OF DELAWAR (1465-C HOWELL MILL ROAD; small business) : $895,405 in 12 contractsfrom 2000 to 2006
Contracts for Miscellaneous Electrical and Electronic Components, Electron Tubes and Associated Hardware by Navy, Defense Logistics Agency Signed by year:2000: $101,220; 2001: $254,190; 2002: $454,395; 2003: $0; 2004: $0; 2005: $70,200; 2006: $15,400.
Biggest contracts:
$219,420 with Navy for Miscellaneous Electrical and Electronic Components. Signed on 2002-12-16. Completion date: 2003-05-15.
$101,220 with Defense Logistics Agency for Electron Tubes and Associated Hardware. Signed on 2000-02-24. Completion date: 2001-04-11.
$99,960, same as above.Signed on 2001-04-28. Completion date: 2001-05-30.
$84,000, same as above.Signed on 2001-07-09. Completion date: 2001-07-23.
TIGHITCO INC (2300 MARIETTA BLVD NW; small business) 250 employees, $0 revenue: $677,873 in 47 contractsfrom 2003 to 2006
Contracts for Miscellaneous Engine Accessories, Nonaircraft, Miscellaneous Items, Gas Turbines and Jet Engines, Non-Aircraft; and Components, Airframe Structural Components, and moreby Defense Logistics Agency Signed by year:2000: $0; 2001: $0; 2002: $0; 2003: $205,631; 2004: $308,939; 2005: $95,937; 2006: $67,366.
Biggest contracts:
$155,337 with Defense Logistics Agency for Miscellaneous Engine Accessories, Nonaircraft. Signed on 2004-03-15. Completion date: 2004-08-07.
$99,972 with Defense Logistics Agency for Miscellaneous Items. Signed on 2003-12-09. Completion date: 2004-03-18.
$58,500 with Defense Logistics Agency for Gas Turbines and Jet Engines, Non-Aircraft; and Components. Signed on 2003-12-01. Completion date: 2004-03-30.
$47,159 with Defense Logistics Agency for Miscellaneous Engine Accessories, Nonaircraft. Signed on 2003-11-14. Completion date: 2004-04-07.
BFI WASTE SYSTEMS OF NORTH AMERICA (3045 BANKHEAD HWY NW; small business) 25 employees, $8000000 revenue: $593,651 in 24 contractsfrom 1999 to 2004
Contracts for Trash/Garbage Collection Services - Including Portable Sanitation Services, Waste Disposal Equipment by Public Buildings Service, Bureau of Prisoners/Federal Prison System, Navy Signed by year:2000: $113,500; 2001: $314,900; 2002: $30,850; 2003: $6,737; 2004: $77,190; 2005: $0; 2006: $0.
Biggest contracts:
$115,000 with Public Buildings Service for Trash/Garbage Collection Services - Including Portable Sanitation Services. Signed on 2001-12-15. Completion date: 2002-12-15.
$113,000, same as above.Signed on 2001-01-15. Completion date: 2001-12-15.
$111,000, same as above.Signed on 2000-01-15. Completion date: 1998-12-15.
$74,357 with Bureau of Prisoners/Federal Prison System for Waste Disposal Equipment. Signed on 2004-10-01. Completion date: 2005-09-30.
CEREX ENVIRONMENTAL SERVICES, (739 TRABERT AVE NW STE D; small business) : $407,484 in 17 contractsfrom 2000 to 2005
Contracts for Liquid and Gas Flow, Liquid Level, and Mechanical Motion Measuring Instruments, Maintenance, Repair and Rebuilding of Equipment -- Instruments and Laboratory Equipment, Maintenance, Repair and Rebuilding of Equipment -- Miscellaneous, Optical Instruments, Test Equipment, Components and Accessories, and moreby EPA, Army Signed by year:2000: $50,000; 2001: $131,378; 2002: $0; 2003: $30,000; 2004: $116,544; 2005: $79,562; 2006: $0.
Biggest contracts:
$52,245 with EPA for Liquid and Gas Flow, Liquid Level, and Mechanical Motion Measuring Instruments. Signed on 2004-11-15. Completion date: 2004-12-20.
$50,000 with Army for Maintenance, Repair and Rebuilding of Equipment -- Instruments and Laboratory Equipment. Taking place in MD. Signed on 2001-11-28. Completion date: 2002-09-30.
$50,000 with Army for Maintenance, Repair and Rebuilding of Equipment -- Miscellaneous. Taking place in MD. Signed on 2000-05-12. Completion date: 2001-02-28.
$46,612 with EPA for Optical Instruments, Test Equipment, Components and Accessories. Signed on 2005-07-27. Completion date: 2005-08-30.
BETTER BRANDS OF ATLANTA INC (755 JEFFERSON ST NW; small business) : $401,722 in 10 contractsin 2001
Contracts for Dairy Foods and Eggs by Defense Logistics Agency Signed by year:2000: $0; 2001: $401,722; 2002: $0; 2003: $0; 2004: $0; 2005: $0; 2006: $0.
Biggest contracts:
$62,223 with Defense Logistics Agency for Dairy Foods and Eggs. Taking place in CT. Signed on 2001-11-08. Completion date: 2001-11-08.
$56,600, same as above.Signed on 2001-11-01. Completion date: 2001-11-01.
$54,678, same as above.Signed on 2001-10-22. Completion date: 2001-10-22.
$38,214, same as above.Signed on 2001-11-07. Completion date: 2001-11-07.
Top industries in this zip code by the number of employees in 2005:
Administrative and Support and Waste Management and Remediation Services: Convention and Trade Show Organizers (500-999: 1, 250-499: 1, 5-9: 2, 1-4: 2)
2002 - 2018 National Fire Incident Reporting System (NFIRS) incidents
According to the data from the years 2002 - 2018 the average number of fire incidents per year is 212. The highest number of reported fire incidents - 380 took place in 2002, and the least - 0 in 2004. The data has a decreasing trend.
When looking into fire subcategories, the most reports belonged to: Structure Fires (47.5%), and Outside Fires (27.3%).
Fire incident types reported to NFIRS in Zip Code 30318
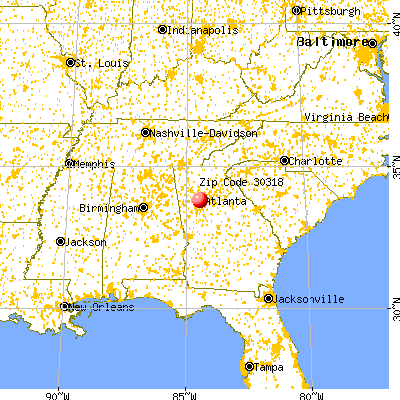


 Nearest zip codes: 30314, 30332, 30363, 30313, 30309, 30310.


 According to the data from the years 2002 - 2018 the average number of fire incidents per year is 212. The highest number of reported fire incidents - 380 took place in 2002, and the least - 0 in 2004. The data has a decreasing trend.
 When looking into fire subcategories, the most reports belonged to: Structure Fires (47.5%), and Outside Fires (27.3%).