Estimated zip code population in 2022: 4,046 Zip code population in 2010: 4,043 Zip code population in 2000: 3,010
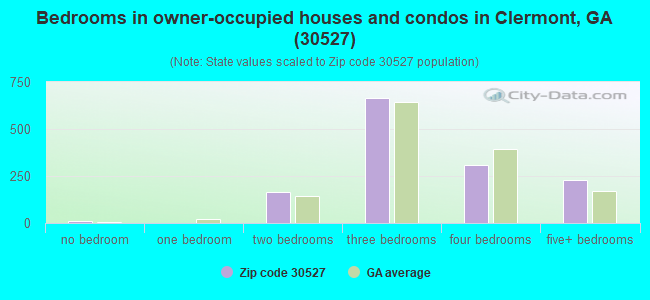
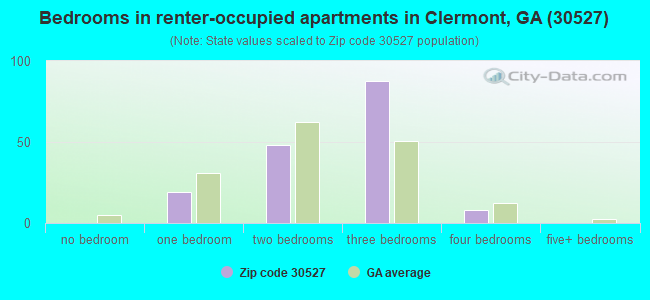
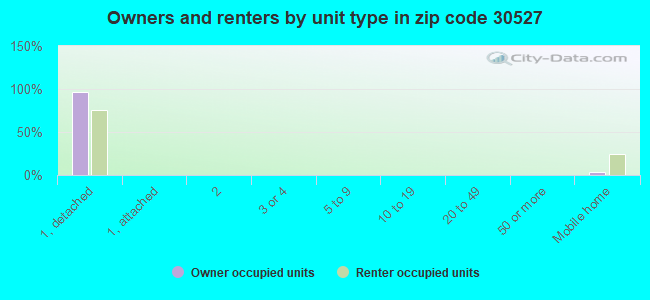
Houses and condos: 1,655 Renter-occupied apartments: 162
% of renters here:
11%
State:
34%
March 2022 cost of living index in zip code 30527: 81.4 (low, U.S. average is 100)
Land area: 25.4 sq. mi. Water area: 0.1 sq. mi.
Population density: 160 people per square mile
(very low).
OSM Map
General Map
Google Map
MSN Map
OSM Map
General Map
Google Map
MSN Map
OSM Map
General Map
Google Map
MSN Map
OSM Map
General Map
Google Map
MSN Map
Please wait while loading the map...
Real estate property taxes paid for housing units in 2022:
This zip code:
0.6% ($2,062)
Georgia:
0.7% ($2,160)
Median real estate property taxes paid for housing units with mortgages in 2022: $2,164 (0.6%) Median real estate property taxes paid for housing units with no mortgage in 2022: $1,640 (0.5%)
Business Search- 14 Million verified businesses
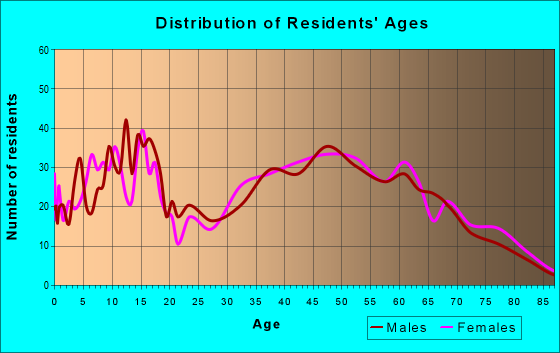
Males: 1,951
(48.2%)
Females: 2,095
(51.8%)
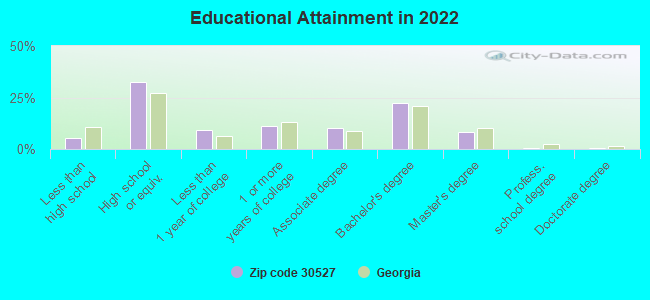
For population 25 years and over in 30527:
High school or higher: 95.2%
Bachelor's degree or higher: 32.0%
Graduate or professional degree: 9.3%
Unemployed: 1.4%
Mean travel time to work (commute): 33.0 minutes
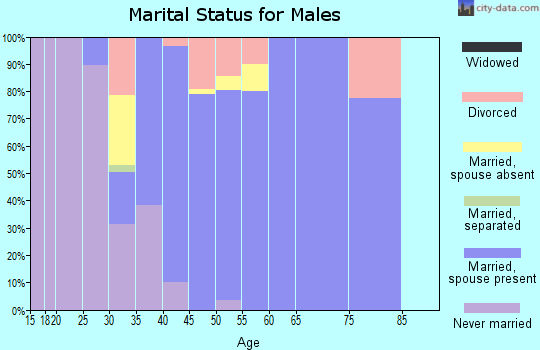
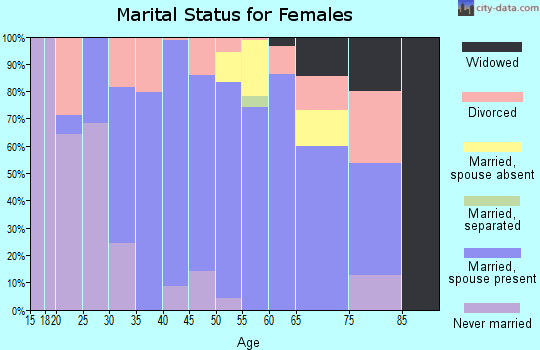
For population 15 years and over in 30527:
Never married: 18.8%
Now married: 70.5%
Separated: 0.1%
Widowed: 3.2%
Divorced: 7.4%
Zip code 30527 compared to state average:
Unemployed percentage significantly below state average.
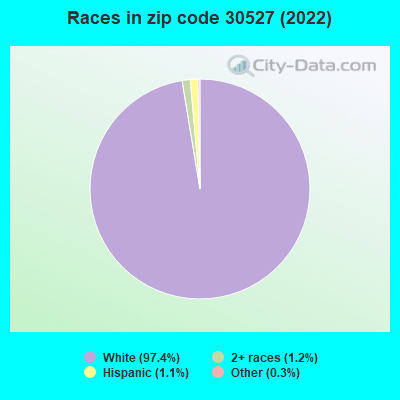
Black race population percentage significantly below state average.
Hispanic race population percentage significantly below state average.
Median age above state average.
Foreign-born population percentage significantly below state average.
Renting percentage significantly below state average.
Length of stay since moving in significantly above state average.
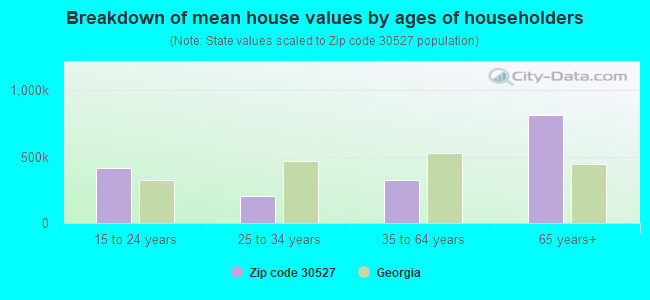
Estimated median house/condo value in 2022: $327,394
30527:
$327,394
Georgia:
$297,400
According to our research of Georgia and other state lists, there were 6 registered sex offenders living in 30527 zip code as of April 27, 2024. The ratio of all residents to sex offenders in zip code 30527 is 739 to 1. The ratio of registered sex offenders to all residents in this zip code is lower than the state average.
Median resident age:
This zip code:
43.7 years
Georgia median age:
37.6 years
Average household size:
This zip code:
2.7 people
Georgia:
2.6 people
Averages for the 2020 tax year for zip code 30527, filed in 2021:
Average Adjusted Gross Income (AGI) in 2020: $74,051 (Individual Income Tax Returns)
Here:
$74,051
State:
$70,847
Salary/wage: $59,773 (reported on 81.5% of returns)
Here:
$59,773
State:
$59,126
(% of AGI for various income ranges: 1187.0% for AGIs below $25k, 3586.6% for AGIs $25k-50k, 6511.7% for AGIs $50k-75k, 9410.5% for AGIs $75k-100k, 19714.3% for AGIs $100k-200k, 79600.0% for AGIs over 200k)
Taxable interest for individuals: $1,494 (reported on 27.9% of returns)
This zip code:
$1,494
Georgia:
$2,011
(% of AGI for various income ranges: 24.1% for AGIs below $25k, 20.3% for AGIs $25k-50k, 51.7% for AGIs $50k-75k, 45.3% for AGIs $75k-100k, 115.7% for AGIs $100k-200k, 1480.0% for AGIs over 200k)
Ordinary dividends: $5,998 (reported on 18.0% of returns)
Here:
$5,998
State:
$8,996
(% of AGI for various income ranges: 19.1% for AGIs below $25k, 52.3% for AGIs $25k-50k, 72.6% for AGIs $50k-75k, 86.8% for AGIs $75k-100k, 270.5% for AGIs $100k-200k, 6140.0% for AGIs over 200k)
Net capital gain/loss in AGI: +$19,453 (reported on 15.3% of returns)
Here:
+$19,453
State:
+$28,402
(% of AGI for various income ranges: 14.8% for AGIs below $25k, 34.6% for AGIs $25k-50k, 28.7% for AGIs $50k-75k, 28.4% for AGIs $75k-100k, 611.9% for AGIs $100k-200k, 25100.0% for AGIs over 200k)
Profit/loss from business: +$15,098 (reported on 19.4% of returns)
Here:
+$15,098
State:
+$6,707
(% of AGI for various income ranges: 173.0% for AGIs below $25k, 181.1% for AGIs $25k-50k, 375.7% for AGIs $50k-75k, 417.9% for AGIs $75k-100k, 551.0% for AGIs $100k-200k, 11235.0% for AGIs over 200k)
Taxable individual retirement arrangement distribution: $18,374 (reported on 8.6% of returns)
30527:
$18,374
Georgia:
$20,525
(% of AGI for various income ranges: 42.6% for AGIs below $25k, 87.4% for AGIs $25k-50k, 193.0% for AGIs $50k-75k, 298.9% for AGIs $75k-100k, 941.4% for AGIs $100k-200k)
Total itemized deductions: $31,700 (reported on 12.2% of returns)
Here:
$31,700
State:
$34,001
(% of AGI for various income ranges: 106.5% for AGIs below $25k, 405.2% for AGIs $50k-75k, 370.0% for AGIs $75k-100k, 1442.4% for AGIs $100k-200k, 17025.0% for AGIs over 200k)
Charity contributions: $12,845 (reported on 9.9% of returns)
Here:
$12,845
State:
$14,164
(% of AGI for various income ranges: 92.2% for AGIs $50k-75k, 95.8% for AGIs $75k-100k, 376.2% for AGIs $100k-200k, 8210.0% for AGIs over 200k)
Taxes paid: $7,965 (reported on 11.7% of returns)
30527:
$7,965
State:
$7,540
(% of AGI for various income ranges: 17.8% for AGIs below $25k, 83.9% for AGIs $50k-75k, 105.8% for AGIs $75k-100k, 447.1% for AGIs $100k-200k, 3280.0% for AGIs over 200k)
Earned income credit: $2,400 (reported on 12.6% of returns)
Here:
$2,400
State:
$2,530
(% of AGI for various income ranges: 85.9% for AGIs below $25k, 79.1% for AGIs $25k-50k)
Percentage of individuals using paid preparers for their 2020 taxes: 95.5%
Here:
95%
State:
93%
(% for various income ranges: 93.9% for AGIs below $25k, 97.8% for AGIs $25k-50k, 93.8% for AGIs $50k-75k, 96.6% for AGIs $75k-100k, 95.0% for AGIs $100k-200k, 100.0% for AGIs over 200k)
Averages for the 2012 tax year for zip code 30527, filed in 2013:
Average Adjusted Gross Income (AGI) in 2012: $58,566 (Individual Income Tax Returns)
Here:
$58,566
State:
$56,131
Salary/wage: $44,807 (reported on 82.6% of returns)
Here:
$44,807
State:
$47,942
(% of AGI for various income ranges: 71.4% for AGIs below $25k, 79.2% for AGIs $25k-50k, 75.5% for AGIs $50k-75k, 76.1% for AGIs $75k-100k, 70.2% for AGIs $100k-200k, 30.4% for AGIs over 200k)
Taxable interest for individuals: $1,388 (reported on 29.1% of returns)
This zip code:
$1,388
Georgia:
$1,706
(% of AGI for various income ranges: 1.9% for AGIs below $25k, 0.9% for AGIs $25k-50k, 0.6% for AGIs $50k-75k, 0.6% for AGIs $75k-100k, 0.5% for AGIs $100k-200k, 0.5% for AGIs over 200k)
Ordinary dividends: $3,721 (reported on 16.9% of returns)
Here:
$3,721
State:
$7,265
(% of AGI for various income ranges: 2.1% for AGIs below $25k, 1.2% for AGIs $25k-50k, 0.5% for AGIs $50k-75k, 0.9% for AGIs $75k-100k, 0.3% for AGIs $100k-200k, 1.8% for AGIs over 200k)
Net capital gain/loss in AGI: +$3,524 (reported on 12.2% of returns)
Here:
+$3,524
State:
+$16,323
(% of AGI for various income ranges: 1.3% for AGIs $75k-100k, 2.6% for AGIs over 200k)
Profit/loss from business: +$8,228 (reported on 18.6% of returns)
Here:
+$8,228
State:
+$7,583
(% of AGI for various income ranges: 7.3% for AGIs below $25k, 2.4% for AGIs $25k-50k, 2.5% for AGIs $50k-75k, 2.2% for AGIs $75k-100k, 4.7% for AGIs $100k-200k)
Taxable individual retirement arrangement distribution: $20,400 (reported on 8.7% of returns)
30527:
$20,400
Georgia:
$17,199
(% of AGI for various income ranges: 3.3% for AGIs below $25k, 2.9% for AGIs $25k-50k, 3.6% for AGIs $50k-75k, 8.6% for AGIs $100k-200k)
Total itemized deductions: $23,948 (23% of AGI, reported on 40.1% of returns)
Here:
$23,948
State:
$23,886
Here:
23.0% of AGI
State:
21.5% of AGI
(% of AGI for various income ranges: 15.6% for AGIs below $25k, 13.6% for AGIs $25k-50k, 15.8% for AGIs $50k-75k, 20.6% for AGIs $75k-100k, 17.1% for AGIs $100k-200k, 15.5% for AGIs over 200k)
Charity contributions: $6,588 (reported on 33.7% of returns)
Here:
$6,588
State:
$5,507
(% of AGI for various income ranges: 1.5% for AGIs below $25k, 1.8% for AGIs $25k-50k, 2.7% for AGIs $50k-75k, 4.1% for AGIs $75k-100k, 3.7% for AGIs $100k-200k, 6.2% for AGIs over 200k)
Taxes paid: $6,516 (reported on 39.5% of returns)
30527:
$6,516
State:
$7,838
(% of AGI for various income ranges: 2.4% for AGIs below $25k, 2.7% for AGIs $25k-50k, 4.3% for AGIs $50k-75k, 5.7% for AGIs $75k-100k, 5.9% for AGIs $100k-200k, 3.9% for AGIs over 200k)
Earned income credit: $2,130 (reported on 19.2% of returns)
Here:
$2,130
State:
$2,589
(% of AGI for various income ranges: 6.7% for AGIs below $25k, 1.3% for AGIs $25k-50k)
Percentage of individuals using paid preparers for their 2012 taxes: 59.9%
Here:
60%
State:
55%
(% for various income ranges: 56.1% for AGIs below $25k, 55.0% for AGIs $25k-50k, 63.0% for AGIs $50k-75k, 66.7% for AGIs $75k-100k, 68.8% for AGIs $100k-200k, 80.0% for AGIs over 200k)
Averages for the 2004 tax year for zip code 30527, filed in 2005:
Average Adjusted Gross Income (AGI) in 2004: $48,057 (Individual Income Tax Returns)
Here:
$48,057
State:
$47,553
Salary/wage: $42,884 (reported on 82.9% of returns)
Here:
$42,884
State:
$42,178
(% of AGI for various income ranges: 110.7% for AGIs below $10k, 71.2% for AGIs $10k-25k, 82.1% for AGIs $25k-50k, 84.8% for AGIs $50k-75k, 82.5% for AGIs $75k-100k, 59.4% for AGIs over 100k)
Taxable interest for individuals: $2,892 (reported on 37.3% of returns)
This zip code:
$2,892
Georgia:
$1,772
(% of AGI for various income ranges: 10.6% for AGIs below $10k, 4.5% for AGIs $10k-25k, 0.9% for AGIs $25k-50k, 2.4% for AGIs $50k-75k, 1.0% for AGIs $75k-100k, 2.6% for AGIs over 100k)
Taxable dividends: $2,349 (reported on 20.4% of returns)
Here:
$2,349
State:
$4,283
(% of AGI for various income ranges: 1.2% for AGIs below $10k, 1.1% for AGIs $10k-25k, 0.7% for AGIs $25k-50k, 0.5% for AGIs $50k-75k, 0.2% for AGIs $75k-100k, 1.8% for AGIs over 100k)
Net capital gain/loss: +$16,458 (reported on 16.0% of returns)
Here:
+$16,458
State:
+$16,461
(% of AGI for various income ranges: 2.7% for AGIs below $10k, 0.3% for AGIs $10k-25k, 0.4% for AGIs $25k-50k, 1.7% for AGIs $50k-75k, 2.5% for AGIs $75k-100k, 12.7% for AGIs over 100k)
Profit/loss from business: +$6,921 (reported on 20.9% of returns)
Here:
+$6,921
State:
+$8,201
(% of AGI for various income ranges: 1.9% for AGIs below $10k, 10.7% for AGIs $10k-25k, 3.9% for AGIs $25k-50k, 1.9% for AGIs $50k-75k, 1.9% for AGIs $75k-100k, 2.0% for AGIs over 100k)
IRA payment deduction: $3,571 (reported on 2.1% of returns)
30527:
$3,571
Georgia:
$2,969
Total itemized deductions: $19,825 (25% of AGI, reported on 42.0% of returns)
Here:
$19,825
State:
$19,944
Here:
24.6% of AGI
State:
22.6% of AGI
(% of AGI for various income ranges: 10.4% for AGIs below $10k, 15.6% for AGIs $10k-25k, 15.4% for AGIs $25k-50k, 20.4% for AGIs $50k-75k, 18.6% for AGIs $75k-100k, 16.7% for AGIs over 100k)
Charity contributions deductions: $4,510 (5% of AGI, reported on 36.1% of returns)
Here:
$4,510
State:
$4,354
Here:
5.2% of AGI
State:
4.7% of AGI
(% of AGI for various income ranges: 1.7% for AGIs $10k-25k, 2.0% for AGIs $25k-50k, 3.1% for AGIs $50k-75k, 3.4% for AGIs $75k-100k, 4.8% for AGIs over 100k)
Total tax: $6,458 (reported on 78.0% of returns)
30527:
$6,458
State:
$8,223
(% of AGI for various income ranges: 4.4% for AGIs below $10k, 5.0% for AGIs $10k-25k, 6.1% for AGIs $25k-50k, 7.5% for AGIs $50k-75k, 9.2% for AGIs $75k-100k, 16.3% for AGIs over 100k)
Earned income credit: $1,751 (reported on 15.0% of returns)
Here:
$1,751
State:
$1,986
Percentage of individuals using paid preparers for their 2004 taxes: 67.3%
Here:
67%
State:
62%
(% for various income ranges: 59.2% for AGIs below $10k, 69.1% for AGIs $10k-25k, 63.7% for AGIs $25k-50k, 73.1% for AGIs $50k-75k, 71.1% for AGIs $75k-100k, 76.2% for AGIs over 100k)
Likely homosexual households (counted as self-reported same-sex unmarried-partner households)
Lesbian couples: 0.6% of all households
Gay men: 0.0% of all households
Household received Food Stamps/SNAP in the past 12 months: 86 Household did not receive Food Stamps/SNAP in the past 12 months: 1,424
Women who had a birth in the past 12 months: 65 (39 now married, 25 unmarried) Women who did not have a birth in the past 12 months: 762 (449 now married, 311 unmarried)
Housing units in zip code 30527 with a mortgage: 982 (65 second mortgage, 69 both second mortgage and home equity loan) Houses without a mortgage: 14
Median monthly owner costs for units with a mortgage: $1,609 Median monthly owner costs for units without a mortgage: $526
Residents with income below the poverty level in 2022:
This zip code:
5.3%
Whole state:
12.7%
Residents with income below 50% of the poverty level in 2022:
This zip code:
3.1%
Whole state:
6.3%
Median number of rooms in houses and condos:
Here:
6.5
State:
6.8
Median number of rooms in apartments:
Here:
4.6
State:
4.6
Notable locations in this zip code not listed on our city pages
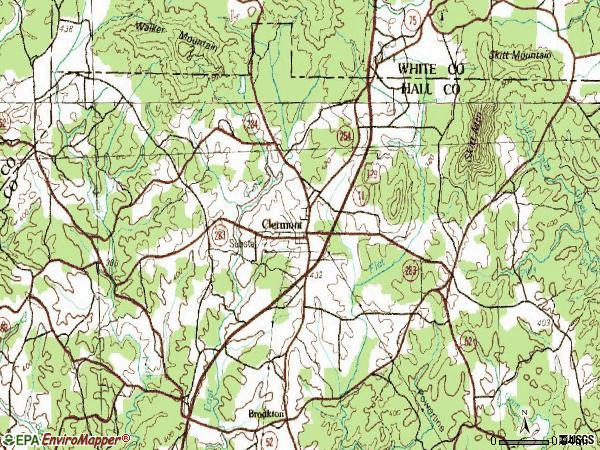
Churches in zip code 30527 include: Holly Springs Church (A), Cross Road Church (B), Christian Hall Church (C), Trinity Church (D), Walka Mountain Church (E). Display/hide their locations on the map
Size of family households: 654 2-persons, 283 3-persons, 194 4-persons, 125 5-persons, 2 6-persons, 36 7-or-more-persons
Size of nonfamily households: 200 1-person, 25 2-persons
633 married couples with children.
134 single-parent households (57 men, 77 women).
98.0% of residents of 30527 zip code speak English at home.
1.3% of residents speak Spanish at home (65% very well, 35% not well).
0.4% of residents speak other Indo-European language at home (100% very well).
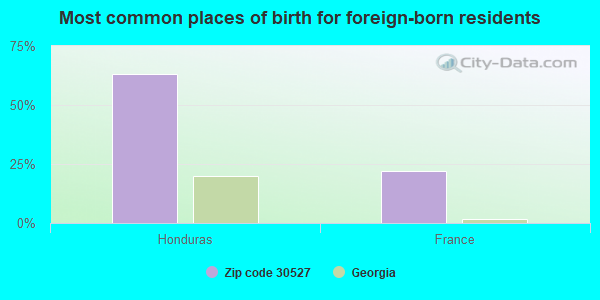
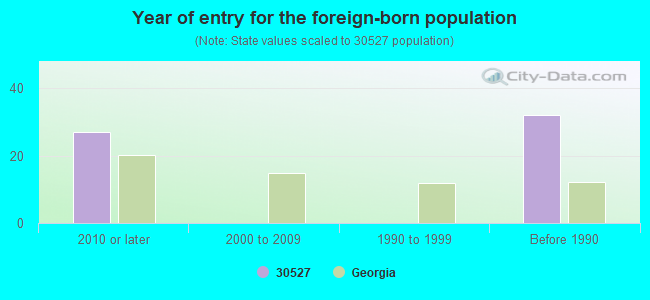
Foreign born population: 28 (0.7%) (100.0% of them are naturalized citizens)
This zip code:
0.7%
Whole state:
10.7%
63%Honduras
22%France
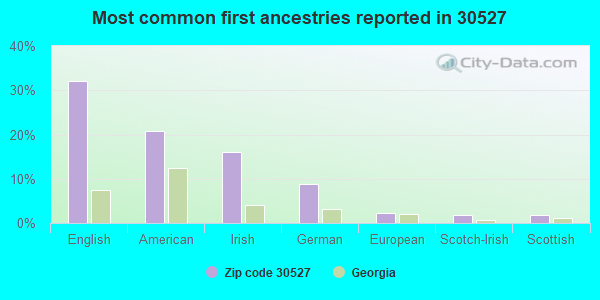
32%English
21%American
16%Irish
9%German
2%European
2%Scotch-Irish
2%Scottish
Year of entry for the foreign-born population
272010 or later
02000 to 2009
01990 to 1999
32Before 1990
Facilities with environmental interests located in this zip code:
CIRCLE M FOOD SHOP #13 (HWY 129 N in CLERMONT, GA)
STATE MASTER (Georgia's Geographic Environmental Information) - UST-1, UNDERGROUND STORAGE TANK PROGRAM, UST-2, UST-4, UST-5, UST-3, (Resource Conservation and Recovery Act (tracking hazardous waste)) Organizations: CLIPPER PETROLEUM INC (CONTACT/OPERATOR)
, PPE (INSTALLER)
Housing units lacking complete plumbing facilities: 6.9% Housing units lacking complete kitchen facilities: 6.9%
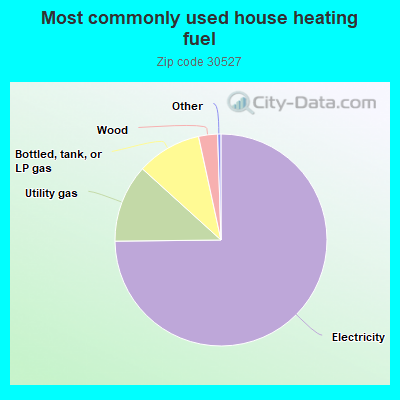
74.9%Electricity
11.9%Utility gas
9.9%Bottled, tank, or LP gas
2.9%Wood
Population in 1990: 2,336. Population change in the 1990s: +674 (+28.9%).
Place of birth for U.S.-born residents:
This state: 3,099
Northeast: 101
Midwest: 255
South: 438
West: 56
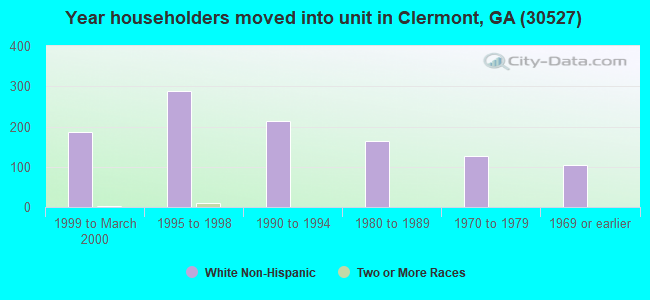
58% of the 30527 zip code residents lived in the same house 5 years ago. Out of people who lived in different houses, 69% lived in this county. Out of people who lived in different counties, 50% lived in Georgia.
94% of the 30527 zip code residents lived in the same house 1 year ago. Out of people who lived in different houses, 53% moved from this county. Out of people who lived in different houses, 39% moved from different county within same state. Out of people who lived in different houses, 5% moved from different state.
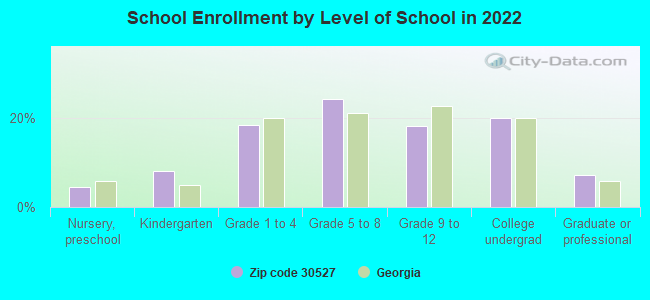
Private vs. public school enrollment:
Students in private schools in grades 1 to 8 (elementary and middle school): 68
Here:
15.2%
Georgia:
12.1%
Students in private schools in grades 9 to 12 (high school):
Here:
0.0%
Georgia:
10.8%
Students in private undergraduate colleges: 58
Here:
28.2%
Georgia:
17.1%
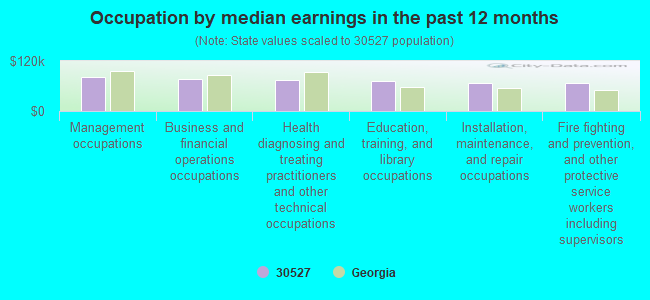
Occupation by median earnings in the past 12 months ($)
82,518Management occupations
77,087Business and financial operations occupations
73,612Health diagnosing and treating practitioners and other technical occupations
72,425Education, training, and library occupations
68,389Installation, maintenance, and repair occupations
66,437Fire fighting and prevention, and other protective service workers including supervisors
Companies with federal contracts located in this zip code:
PATCHIN SOLUABLE INTEGRATED, I (5586 RANSOM FREE ROAD in CLERMONT, GA; small business) : $758,837 in 8 contractsfrom 2004 to 2006
Contracts for Physical Properties Testing and Inspection, Specialized Shipping and Storage Containers by Army Signed by year:2000: $0; 2001: $0; 2002: $0; 2003: $0; 2004: $93,917; 2005: $679,339; 2006: -$14,419.
Biggest contracts:
$322,173 with Army for Physical Properties Testing and Inspection. Signed on 2005-05-12. Completion date: 2006-05-12.
$268,517, same as above.Signed on 2005-07-18. Completion date: 2006-05-12.
$93,917 with Army for Specialized Shipping and Storage Containers. Signed on 2004-09-01. Completion date: 2005-01-31.
$45,257, same as above.Signed on 2005-05-26. Completion date: 2005-06-27.
Top industries in this zip code by the number of employees in 2005:
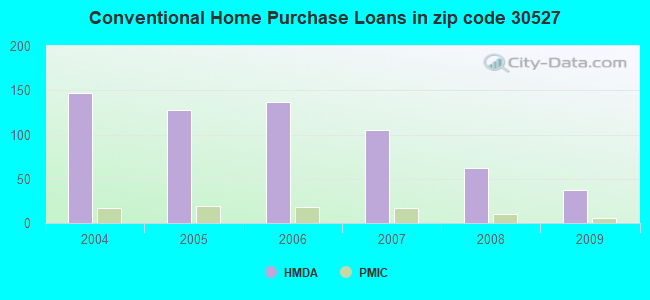
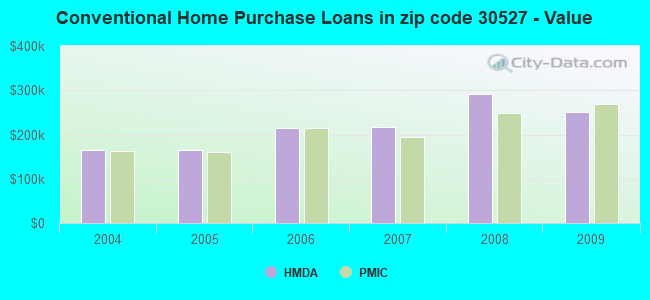
Detailed PMIC statistics for the following Tracts:0002.01
, 0002.02
2002 - 2018 National Fire Incident Reporting System (NFIRS) incidents
Based on the data from the years 2002 - 2018 the average number of fires per year is 21. The highest number of fire incidents - 49 took place in 2008, and the least - 0 in 2004. The data has a declining trend.
When looking into fire subcategories, the most incidents belonged to: Outside Fires (50.6%), and Structure Fires (28.4%).
Fire incident types reported to NFIRS in Zip Code 30527
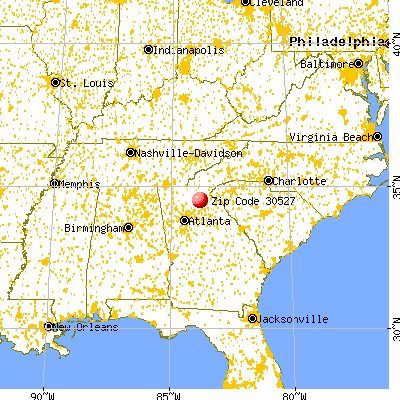


 Nearest zip codes: 30564, 30528, 30554, 30501, 30506, 30531.
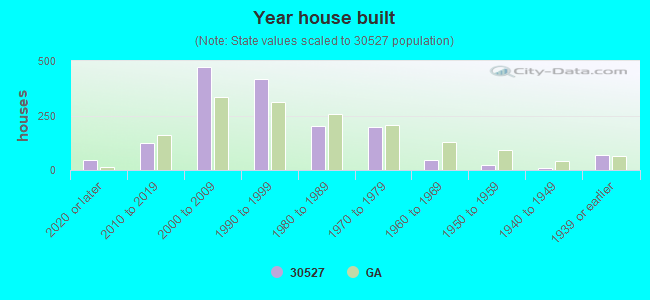


 Based on the data from the years 2002 - 2018 the average number of fires per year is 21. The highest number of fire incidents - 49 took place in 2008, and the least - 0 in 2004. The data has a declining trend.
 When looking into fire subcategories, the most incidents belonged to: Outside Fires (50.6%), and Structure Fires (28.4%).