Estimated zip code population in 2022: 2,394 Zip code population in 2010: 2,061 Zip code population in 2000: 2,079
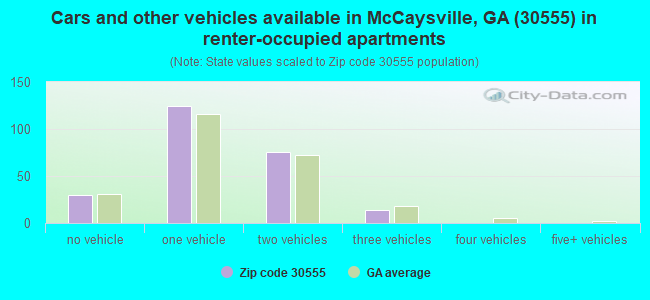
Houses and condos: 1,501 Renter-occupied apartments: 243
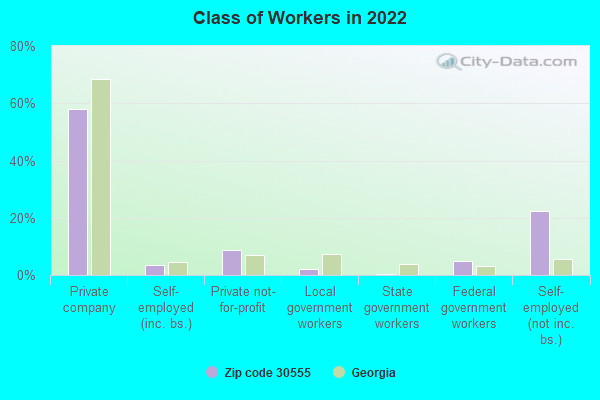
% of renters here:
19%
State:
34%
March 2022 cost of living index in zip code 30555: 81.8 (low, U.S. average is 100)
Land area: 13.2 sq. mi. Water area: 0.0 sq. mi.
Population density: 181 people per square mile
(very low).
OSM Map
General Map
Google Map
MSN Map
OSM Map
General Map
Google Map
MSN Map
OSM Map
General Map
Google Map
MSN Map
OSM Map
General Map
Google Map
MSN Map
Please wait while loading the map...
Real estate property taxes paid for housing units in 2022:
This zip code:
0.4% ($663)
Georgia:
0.7% ($2,160)
Median real estate property taxes paid for housing units with mortgages in 2022: $1,098 (0.4%) Median real estate property taxes paid for housing units with no mortgage in 2022: $400 (0.4%)
Business Search- 14 Million verified businesses
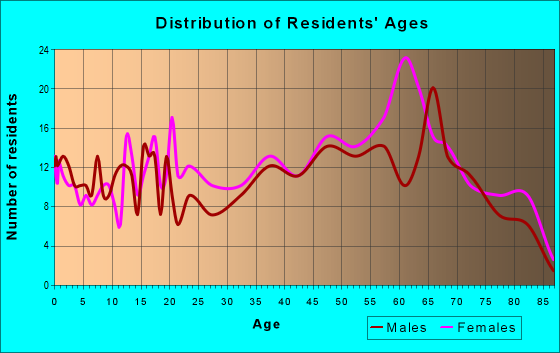
Males: 1,131
(47.3%)
Females: 1,263
(52.7%)
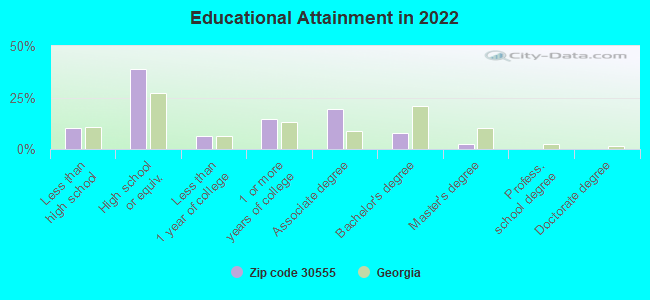
For population 25 years and over in 30555:
High school or higher: 88.3%
Bachelor's degree or higher: 10.1%
Graduate or professional degree: 2.6%
Unemployed: 0.2%
Mean travel time to work (commute): 23.7 minutes
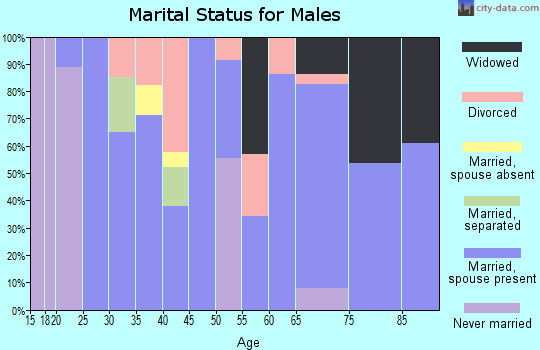
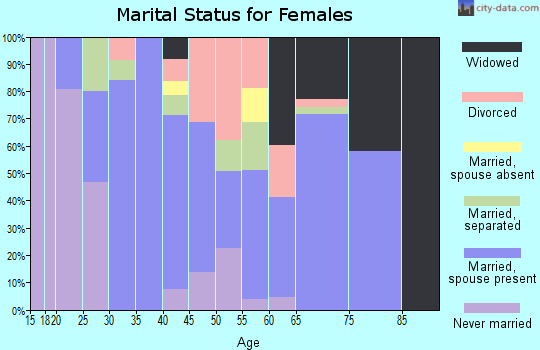
For population 15 years and over in 30555:
Never married: 25.9%
Now married: 40.2%
Separated: 0.6%
Widowed: 16.3%
Divorced: 17.0%
Zip code 30555 compared to state average:
Median household income below state average.
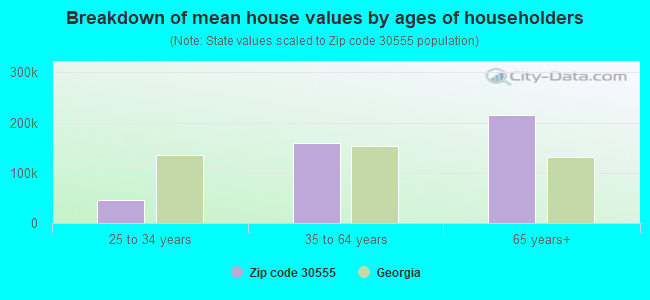
Median house value below state average.
Unemployed percentage significantly below state average.
Black race population percentage significantly below state average.
Median age significantly above state average.
Foreign-born population percentage below state average.
Renting percentage below state average.
Length of stay since moving in significantly above state average.
House age above state average.
Number of college students significantly below state average.
Percentage of population with a bachelor's degree or higher significantly below state average.
Averages for the 2020 tax year for zip code 30555, filed in 2021:
Average Adjusted Gross Income (AGI) in 2020: $49,162 (Individual Income Tax Returns)
Here:
$49,162
State:
$70,847
Salary/wage: $38,557 (reported on 71.6% of returns)
Here:
$38,557
State:
$59,126
(% of AGI for various income ranges: 964.2% for AGIs below $25k, 3547.1% for AGIs $25k-50k, 6420.0% for AGIs $50k-75k, 10335.0% for AGIs $75k-100k, 19087.5% for AGIs $100k-200k)
Taxable interest for individuals: $1,064 (reported on 23.2% of returns)
This zip code:
$1,064
Georgia:
$2,011
(% of AGI for various income ranges: 31.9% for AGIs below $25k, 15.2% for AGIs $25k-50k, 27.1% for AGIs $50k-75k, 130.0% for AGIs $75k-100k, 120.0% for AGIs $100k-200k)
Ordinary dividends: $3,433 (reported on 12.6% of returns)
Here:
$3,433
State:
$8,996
(% of AGI for various income ranges: 16.2% for AGIs below $25k, 47.6% for AGIs $25k-50k, 340.0% for AGIs $75k-100k, 335.0% for AGIs $100k-200k)
Net capital gain/loss in AGI: +$16,592 (reported on 12.6% of returns)
Here:
+$16,592
State:
+$28,402
(% of AGI for various income ranges: 16.2% for AGIs below $25k, 25.7% for AGIs $25k-50k, 91.4% for AGIs $50k-75k, 4577.5% for AGIs $100k-200k)
Profit/loss from business: +$12,277 (reported on 23.2% of returns)
Here:
+$12,277
State:
+$6,707
(% of AGI for various income ranges: 318.1% for AGIs below $25k, 222.4% for AGIs $25k-50k, 555.7% for AGIs $50k-75k, 2545.0% for AGIs $100k-200k)
Taxable individual retirement arrangement distribution: $14,380 (reported on 10.5% of returns)
30555:
$14,380
Georgia:
$20,525
(% of AGI for various income ranges: 122.7% for AGIs below $25k, 558.6% for AGIs $50k-75k, 1820.0% for AGIs $100k-200k)
Total itemized deductions: $28,075 (reported on 4.2% of returns)
Here:
$28,075
State:
$34,001
(% of AGI for various income ranges: 224.8% for AGIs $25k-50k, 1627.5% for AGIs $100k-200k)
Charity contributions: $6,925 (reported on 4.2% of returns)
Here:
$6,925
State:
$14,164
(% of AGI for various income ranges: 692.5% for AGIs $100k-200k)
Taxes paid: $6,525 (reported on 4.2% of returns)
30555:
$6,525
State:
$7,540
(% of AGI for various income ranges: 34.8% for AGIs $25k-50k, 470.0% for AGIs $100k-200k)
Earned income credit: $2,400 (reported on 21.1% of returns)
Here:
$2,400
State:
$2,530
(% of AGI for various income ranges: 120.8% for AGIs below $25k, 79.0% for AGIs $25k-50k)
Percentage of individuals using paid preparers for their 2020 taxes: 92.6%
Here:
93%
State:
93%
(% for various income ranges: 92.3% for AGIs below $25k, 96.3% for AGIs $25k-50k, 90.9% for AGIs $50k-75k, 87.5% for AGIs $75k-100k, 87.5% for AGIs $100k-200k, 100.0% for AGIs over 200k)
Averages for the 2012 tax year for zip code 30555, filed in 2013:
Average Adjusted Gross Income (AGI) in 2012: $34,219 (Individual Income Tax Returns)
Here:
$34,219
State:
$56,131
Salary/wage: $26,750 (reported on 76.9% of returns)
Here:
$26,750
State:
$47,942
(% of AGI for various income ranges: 63.6% for AGIs below $25k, 70.6% for AGIs $25k-50k, 67.2% for AGIs $50k-75k, 57.6% for AGIs $75k-100k, 42.2% for AGIs $100k-200k)
Taxable interest for individuals: $948 (reported on 25.3% of returns)
This zip code:
$948
Georgia:
$1,706
(% of AGI for various income ranges: 1.7% for AGIs below $25k, 0.4% for AGIs $25k-50k, 0.3% for AGIs $50k-75k, 0.3% for AGIs $75k-100k, 0.7% for AGIs $100k-200k)
Ordinary dividends: $1,622 (reported on 9.9% of returns)
Here:
$1,622
State:
$7,265
(% of AGI for various income ranges: 0.6% for AGIs below $25k, 0.7% for AGIs $25k-50k, 1.3% for AGIs $75k-100k)
Net capital gain/loss in AGI: +$1,133 (reported on 6.6% of returns)
Here:
+$1,133
State:
+$16,323
Profit/loss from business: +$8,757 (reported on 23.1% of returns)
Here:
+$8,757
State:
+$7,583
(% of AGI for various income ranges: 15.4% for AGIs below $25k, 7.4% for AGIs $25k-50k, 5.4% for AGIs $50k-75k)
Taxable individual retirement arrangement distribution: $9,911 (reported on 9.9% of returns)
30555:
$9,911
Georgia:
$17,199
(% of AGI for various income ranges: 2.6% for AGIs below $25k, 4.8% for AGIs $25k-50k, 8.5% for AGIs $75k-100k)
Total itemized deductions: $18,176 (28% of AGI, reported on 23.1% of returns)
Here:
$18,176
State:
$23,886
Here:
27.7% of AGI
State:
21.5% of AGI
(% of AGI for various income ranges: 8.1% for AGIs below $25k, 8.8% for AGIs $25k-50k, 14.6% for AGIs $50k-75k, 14.5% for AGIs $75k-100k, 16.0% for AGIs $100k-200k)
Charity contributions: $3,481 (reported on 17.6% of returns)
Here:
$3,481
State:
$5,507
(% of AGI for various income ranges: 0.7% for AGIs below $25k, 1.2% for AGIs $25k-50k, 2.8% for AGIs $50k-75k, 2.1% for AGIs $75k-100k, 2.3% for AGIs $100k-200k)
Taxes paid: $4,135 (reported on 22.0% of returns)
30555:
$4,135
State:
$7,838
(% of AGI for various income ranges: 1.0% for AGIs below $25k, 1.5% for AGIs $25k-50k, 2.7% for AGIs $50k-75k, 3.5% for AGIs $75k-100k, 4.7% for AGIs $100k-200k)
Earned income credit: $2,411 (reported on 30.8% of returns)
Here:
$2,411
State:
$2,589
(% of AGI for various income ranges: 8.9% for AGIs below $25k, 1.5% for AGIs $25k-50k)
Percentage of individuals using paid preparers for their 2012 taxes: 65.9%
Here:
66%
State:
55%
(% for various income ranges: 66.7% for AGIs below $25k, 65.0% for AGIs $25k-50k, 70.0% for AGIs $50k-75k, 60.0% for AGIs $75k-100k, 60.0% for AGIs $100k-200k)
Averages for the 2004 tax year for zip code 30555, filed in 2005:
Average Adjusted Gross Income (AGI) in 2004: $30,926 (Individual Income Tax Returns)
Here:
$30,926
State:
$47,553
Salary/wage: $28,863 (reported on 76.3% of returns)
Here:
$28,863
State:
$42,178
(% of AGI for various income ranges: 114.2% for AGIs below $10k, 68.3% for AGIs $10k-25k, 74.2% for AGIs $25k-50k, 75.5% for AGIs $50k-75k, 60.3% for AGIs $75k-100k, 63.2% for AGIs over 100k)
Taxable interest for individuals: $1,306 (reported on 39.1% of returns)
This zip code:
$1,306
Georgia:
$1,772
(% of AGI for various income ranges: 5.6% for AGIs below $10k, 2.1% for AGIs $10k-25k, 1.5% for AGIs $25k-50k, 1.7% for AGIs $50k-75k, 0.4% for AGIs $75k-100k, 1.6% for AGIs over 100k)
Taxable dividends: $1,752 (reported on 10.8% of returns)
Here:
$1,752
State:
$4,283
(% of AGI for various income ranges: 2.5% for AGIs below $10k, 0.9% for AGIs $10k-25k, 0.7% for AGIs $25k-50k, 0.4% for AGIs $50k-75k, 0.5% for AGIs over 100k)
Net capital gain/loss: +$10,175 (reported on 8.3% of returns)
Here:
+$10,175
State:
+$16,461
(% of AGI for various income ranges: 2.5% for AGIs below $10k, -0.0% for AGIs $10k-25k, 1.1% for AGIs $25k-50k, 2.4% for AGIs $50k-75k, 11.1% for AGIs over 100k)
Profit/loss from business: +$7,402 (reported on 25.4% of returns)
Here:
+$7,402
State:
+$8,201
(% of AGI for various income ranges: 13.0% for AGIs below $10k, 11.2% for AGIs $10k-25k, 6.3% for AGIs $25k-50k, 3.1% for AGIs $50k-75k, 11.1% for AGIs $75k-100k)
IRA payment deduction: $2,133 (reported on 1.5% of returns)
30555:
$2,133
Georgia:
$2,969
Total itemized deductions: $15,412 (27% of AGI, reported on 24.8% of returns)
Here:
$15,412
State:
$19,944
Here:
27.2% of AGI
State:
22.6% of AGI
(% of AGI for various income ranges: 16.8% for AGIs below $10k, 9.4% for AGIs $10k-25k, 11.1% for AGIs $25k-50k, 13.4% for AGIs $50k-75k, 15.3% for AGIs $75k-100k, 13.8% for AGIs over 100k)
Charity contributions deductions: $2,826 (5% of AGI, reported on 20.1% of returns)
Here:
$2,826
State:
$4,354
Here:
4.8% of AGI
State:
4.7% of AGI
(% of AGI for various income ranges: 1.3% for AGIs $10k-25k, 1.5% for AGIs $25k-50k, 1.6% for AGIs $50k-75k, 3.3% for AGIs $75k-100k, 2.7% for AGIs over 100k)
Total tax: $3,663 (reported on 74.6% of returns)
30555:
$3,663
State:
$8,223
(% of AGI for various income ranges: 7.2% for AGIs below $10k, 4.5% for AGIs $10k-25k, 6.5% for AGIs $25k-50k, 9.0% for AGIs $50k-75k, 11.8% for AGIs $75k-100k, 16.0% for AGIs over 100k)
Earned income credit: $1,884 (reported on 23.1% of returns)
Here:
$1,884
State:
$1,986
Percentage of individuals using paid preparers for their 2004 taxes: 73.9%
Here:
74%
State:
62%
(% for various income ranges: 69.1% for AGIs below $10k, 76.9% for AGIs $10k-25k, 70.8% for AGIs $25k-50k, 79.8% for AGIs $50k-75k, 81.1% for AGIs $75k-100k, 72.7% for AGIs over 100k)
Household received Food Stamps/SNAP in the past 12 months: 248 Household did not receive Food Stamps/SNAP in the past 12 months: 1,020
Women who did not have a birth in the past 12 months: 550 (173 now married, 377 unmarried)
Housing units in zip code 30555 with a mortgage: 475 (20 second mortgage) Median monthly owner costs for units with a mortgage: $1,404 Median monthly owner costs for units without a mortgage: $307
Residents with income below the poverty level in 2022:
This zip code:
15.4%
Whole state:
12.7%
Residents with income below 50% of the poverty level in 2022:
This zip code:
6.2%
Whole state:
6.3%
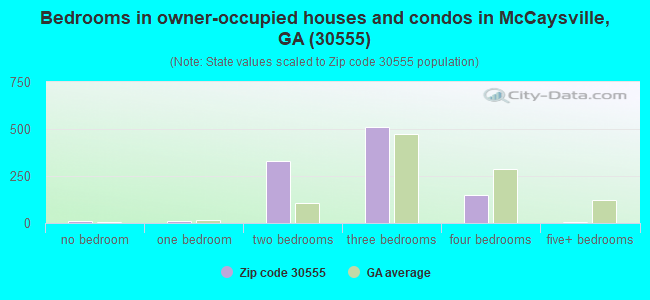
Median number of rooms in houses and condos:
Here:
5.6
State:
6.8
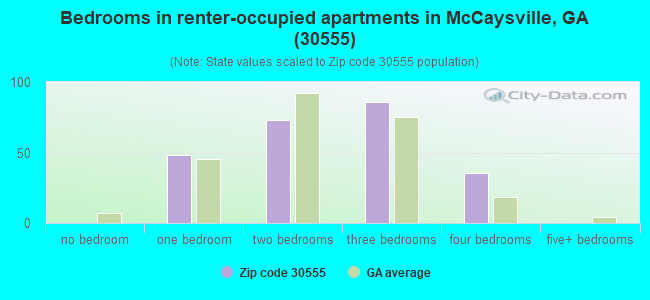
Median number of rooms in apartments:
Here:
4.9
State:
4.6
Notable locations in this zip code not listed on our city pages
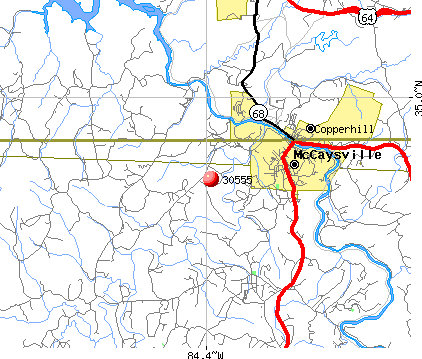
Churches in zip code 30555 include: Shady Grove Church (A), Midway Church (B), First Baptist Church of McCaysville (C), Mobile Baptist Church (D), Mount Liberty Church (E), Mountain View Church (F), Bethel Church (G). Display/hide their locations on the map
Streams, rivers, and creeks: Toccoa River (A), Kingtown Branch (B), Ritchie Creek (C), Grusher Branch (D), Five Mile Cove Branch (E), Madola Mill Creek (F). Display/hide their locations on the map
Size of family households: 309 2-persons, 194 3-persons, 38 4-persons, 92 5-persons, 33 7-or-more-persons
Size of nonfamily households: 576 1-person, 8 2-persons, 4 3-persons
156 married couples with children.
138 single-parent households (70 men, 68 women).
93.6% of residents of 30555 zip code speak English at home.
6.2% of residents speak Spanish at home (43% very well, 34% well, 10% not well, 13% not at all).
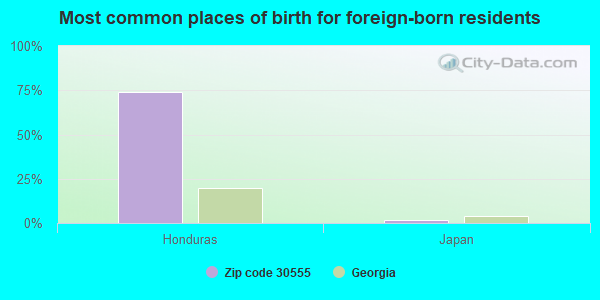
Foreign born population: 132 (5.5%) (20.6% of them are naturalized citizens)
This zip code:
5.5%
Whole state:
10.7%
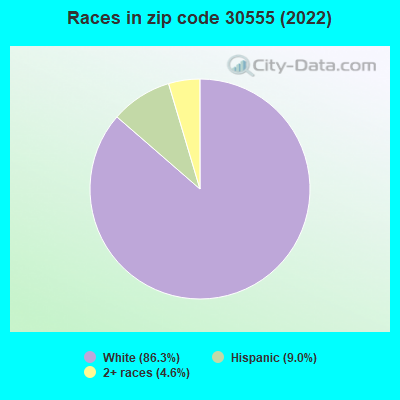
74%Honduras
1%Japan
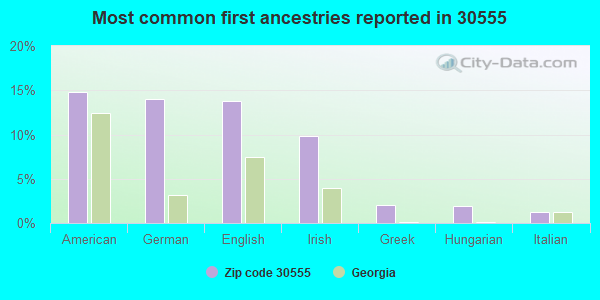
15%American
14%German
14%English
10%Irish
2%Greek
2%Hungarian
1%Italian
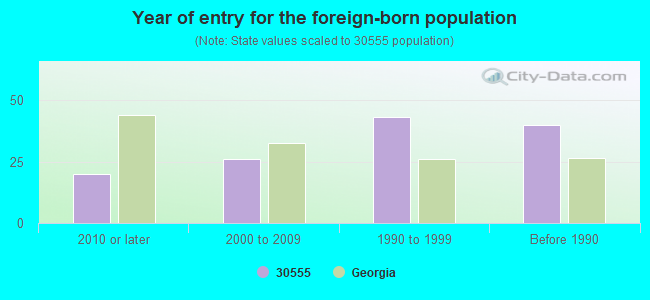
Year of entry for the foreign-born population
202010 or later
262000 to 2009
431990 to 1999
40Before 1990
Facilities with environmental interests located in this zip code:
PANTER CONCRETE PRODUCTS (WILLIAMSTOWN RD in MCCAYSVILLE, GA)
AIR MINOR (AIRS/AFS) Business SIC classification: READY-MIXED CONCRETE
Housing units lacking complete plumbing facilities: 3.1% Housing units lacking complete kitchen facilities: 3.1%
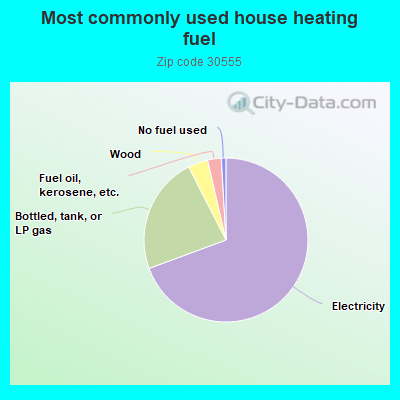
69.3%Electricity
23.1%Bottled, tank, or LP gas
3.9%Wood
2.7%Fuel oil, kerosene, etc.
0.9%No fuel used
Population in 1990: 4,720.
Place of birth for U.S.-born residents:
This state: 971
Northeast: 14
Midwest: 309
South: 926
West: 47
63% of the 30555 zip code residents lived in the same house 5 years ago. Out of people who lived in different houses, 52% lived in this county. Out of people who lived in different counties, 50% lived in Georgia.
92% of the 30555 zip code residents lived in the same house 1 year ago. Out of people who lived in different houses, 48% moved from this county. Out of people who lived in different houses, 27% moved from different county within same state. Out of people who lived in different houses, 20% moved from different state. Out of people who lived in different houses, 3% moved from abroad.
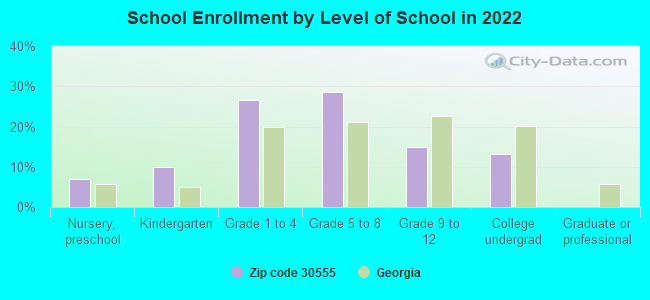
Private vs. public school enrollment:
Students in private schools in grades 1 to 8 (elementary and middle school): 9
Here:
6.2%
Georgia:
12.1%
Students in private schools in grades 9 to 12 (high school): 9
Here:
23.0%
Georgia:
10.8%
Students in private undergraduate colleges:
Here:
0.0%
Georgia:
17.1%
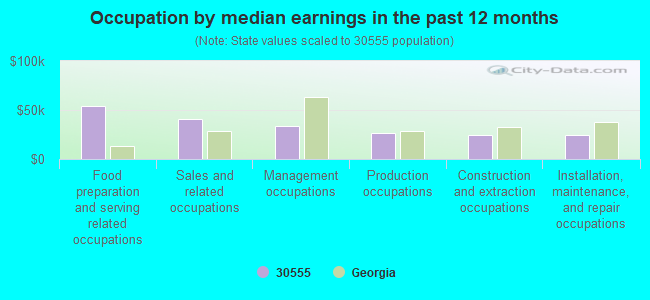
Occupation by median earnings in the past 12 months ($)
53,663Food preparation and serving related occupations
41,312Sales and related occupations
33,742Management occupations
26,400Production occupations
24,651Construction and extraction occupations
24,603Installation, maintenance, and repair occupations
Top industries in this zip code by the number of employees in 2005:
Utilities: Electric Power Distribution (20-49 employees: 1 establishment)
Finance and Insurance: Commercial Banking (20-49: 1)
Accommodation and Food Services: Limited-Service Restaurants (10-19: 2, 1-4: 1)
Accommodation and Food Services: Full-Service Restaurants (10-19: 2, 1-4: 1)
Other Services (except Public Administration): Religious Organizations (5-9: 1, 1-4: 6)
Construction: Plumbing, Heating, and Air-Conditioning Contractors (10-19: 1)
Fatal accident statistics in 2013:
Fatal accident count: 1
Vehicles involved in fatal accidents: 1
Fatal accidents caused by drunken drivers: 0
Fatalities: 1
Persons involved in fatal accidents: 1
Pedestrians involved in fatal accidents: 1
Fatal accident statistics in 2011:
Fatal accident count: 1
Vehicles involved in fatal accidents: 1
Fatal accidents caused by drunken drivers: 0
Fatalities: 1
Persons involved in fatal accidents: 1
Pedestrians involved in fatal accidents: 0
2003 - 2018 National Fire Incident Reporting System (NFIRS) incidents
According to the data from the years 2003 - 2018 the average number of fires per year is 13. The highest number of fires - 19 took place in 2013, and the least - 1 in 2005. The data has a decreasing trend.
When looking into fire subcategories, the most incidents belonged to: Structure Fires (43.1%), and Outside Fires (38.3%).
Fire incident types reported to NFIRS in Zip Code 30555


 Nearest zip codes: 37317, 37326, 30541, 37391, 30559, 30513.
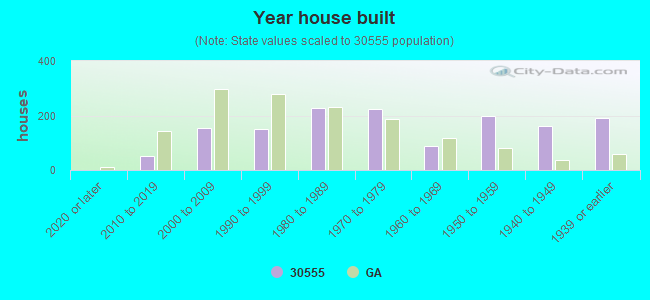


 According to the data from the years 2003 - 2018 the average number of fires per year is 13. The highest number of fires - 19 took place in 2013, and the least - 1 in 2005. The data has a decreasing trend.
 When looking into fire subcategories, the most incidents belonged to: Structure Fires (43.1%), and Outside Fires (38.3%).