Estimated zip code population in 2022: 44,411 Zip code population in 2010: 41,029 Zip code population in 2000: 33,776
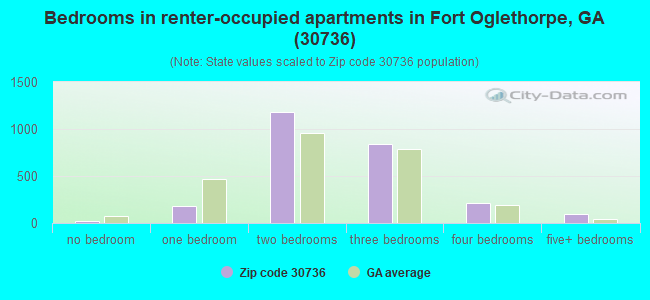
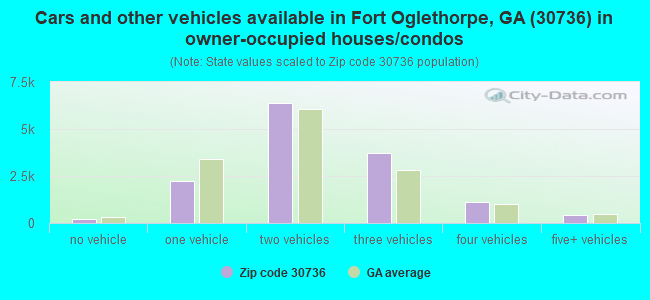
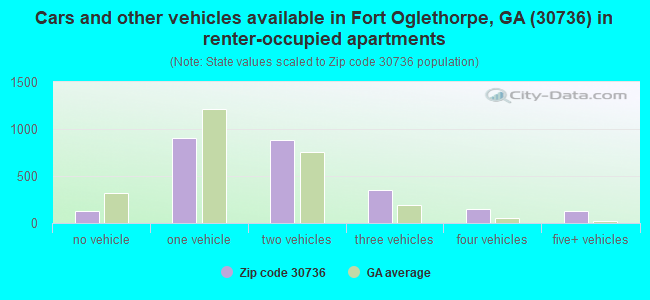
Houses and condos: 17,717 Renter-occupied apartments: 2,529
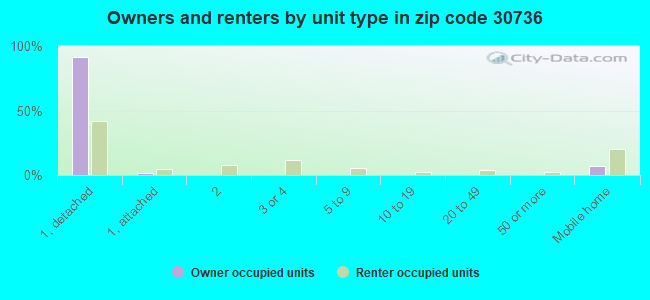
% of renters here:
15%
State:
34%
March 2022 cost of living index in zip code 30736: 87.6 (less than average, U.S. average is 100)
Land area: 128.5 sq. mi. Water area: 0.3 sq. mi.
Population density: 346 people per square mile
(very low).
OSM Map
General Map
Google Map
MSN Map
OSM Map
General Map
Google Map
MSN Map
OSM Map
General Map
Google Map
MSN Map
OSM Map
General Map
Google Map
MSN Map
Please wait while loading the map...
Real estate property taxes paid for housing units in 2022:
This zip code:
0.6% ($1,636)
Georgia:
0.7% ($2,160)
Median real estate property taxes paid for housing units with mortgages in 2022: $1,711 (0.6%) Median real estate property taxes paid for housing units with no mortgage in 2022: $1,360 (0.5%)
Averages for the 2020 tax year for zip code 30736, filed in 2021:
Average Adjusted Gross Income (AGI) in 2020: $63,102 (Individual Income Tax Returns)
Here:
$63,102
State:
$70,847
Salary/wage: $55,170 (reported on 84.6% of returns)
Here:
$55,170
State:
$59,126
(% of AGI for various income ranges: 1187.7% for AGIs below $25k, 3583.4% for AGIs $25k-50k, 6533.7% for AGIs $50k-75k, 9880.1% for AGIs $75k-100k, 17167.3% for AGIs $100k-200k, 60566.0% for AGIs over 200k)
Taxable interest for individuals: $1,241 (reported on 24.2% of returns)
This zip code:
$1,241
Georgia:
$2,011
(% of AGI for various income ranges: 14.3% for AGIs below $25k, 15.0% for AGIs $25k-50k, 30.9% for AGIs $50k-75k, 44.1% for AGIs $75k-100k, 88.8% for AGIs $100k-200k, 836.0% for AGIs over 200k)
Ordinary dividends: $3,493 (reported on 12.0% of returns)
Here:
$3,493
State:
$8,996
(% of AGI for various income ranges: 12.1% for AGIs below $25k, 17.8% for AGIs $25k-50k, 35.2% for AGIs $50k-75k, 67.7% for AGIs $75k-100k, 120.4% for AGIs $100k-200k, 1462.5% for AGIs over 200k)
Net capital gain/loss in AGI: +$14,391 (reported on 11.2% of returns)
Here:
+$14,391
State:
+$28,402
(% of AGI for various income ranges: 6.5% for AGIs below $25k, 21.2% for AGIs $25k-50k, 64.1% for AGIs $50k-75k, 130.7% for AGIs $75k-100k, 403.2% for AGIs $100k-200k, 9616.5% for AGIs over 200k)
Profit/loss from business: +$12,222 (reported on 16.3% of returns)
Here:
+$12,222
State:
+$6,707
(% of AGI for various income ranges: 130.0% for AGIs below $25k, 164.6% for AGIs $25k-50k, 232.0% for AGIs $50k-75k, 338.8% for AGIs $75k-100k, 529.7% for AGIs $100k-200k, 3483.0% for AGIs over 200k)
Taxable individual retirement arrangement distribution: $17,844 (reported on 8.5% of returns)
30736:
$17,844
Georgia:
$20,525
(% of AGI for various income ranges: 60.7% for AGIs below $25k, 99.5% for AGIs $25k-50k, 164.9% for AGIs $50k-75k, 315.5% for AGIs $75k-100k, 589.2% for AGIs $100k-200k, 2070.0% for AGIs over 200k)
Self-employed (Keogh) retirement plans: $17,600 (reported on 0.3% of returns)
30736:
$17,600
Georgia:
$27,751
(% of AGI for various income ranges: 48.9% for AGIs $100k-200k)
Total itemized deductions: $32,518 (reported on 6.9% of returns)
Here:
$32,518
State:
$34,001
(% of AGI for various income ranges: 27.7% for AGIs below $25k, 78.3% for AGIs $25k-50k, 217.6% for AGIs $50k-75k, 282.4% for AGIs $75k-100k, 916.3% for AGIs $100k-200k, 6689.0% for AGIs over 200k)
Charity contributions: $14,590 (reported on 6.1% of returns)
Here:
$14,590
State:
$14,164
(% of AGI for various income ranges: 3.0% for AGIs below $25k, 15.8% for AGIs $25k-50k, 59.8% for AGIs $50k-75k, 86.1% for AGIs $75k-100k, 349.7% for AGIs $100k-200k, 3780.5% for AGIs over 200k)
Taxes paid: $7,107 (reported on 6.7% of returns)
30736:
$7,107
State:
$7,540
(% of AGI for various income ranges: 3.3% for AGIs below $25k, 11.6% for AGIs $25k-50k, 41.0% for AGIs $50k-75k, 63.7% for AGIs $75k-100k, 236.4% for AGIs $100k-200k, 1278.5% for AGIs over 200k)
Earned income credit: $2,205 (reported on 16.2% of returns)
Here:
$2,205
State:
$2,530
(% of AGI for various income ranges: 93.1% for AGIs below $25k, 73.0% for AGIs $25k-50k, 2.3% for AGIs $50k-75k)
Percentage of individuals using paid preparers for their 2020 taxes: 94.0%
Here:
94%
State:
93%
(% for various income ranges: 92.7% for AGIs below $25k, 94.7% for AGIs $25k-50k, 94.0% for AGIs $50k-75k, 93.5% for AGIs $75k-100k, 95.4% for AGIs $100k-200k, 96.6% for AGIs over 200k)
Averages for the 2012 tax year for zip code 30736, filed in 2013:
Average Adjusted Gross Income (AGI) in 2012: $51,956 (Individual Income Tax Returns)
Here:
$51,956
State:
$56,131
Salary/wage: $46,914 (reported on 87.1% of returns)
Here:
$46,914
State:
$47,942
(% of AGI for various income ranges: 76.9% for AGIs below $25k, 82.3% for AGIs $25k-50k, 81.6% for AGIs $50k-75k, 82.9% for AGIs $75k-100k, 80.5% for AGIs $100k-200k, 59.7% for AGIs over 200k)
Taxable interest for individuals: $941 (reported on 26.8% of returns)
This zip code:
$941
Georgia:
$1,706
(% of AGI for various income ranges: 0.9% for AGIs below $25k, 0.4% for AGIs $25k-50k, 0.4% for AGIs $50k-75k, 0.4% for AGIs $75k-100k, 0.4% for AGIs $100k-200k, 0.8% for AGIs over 200k)
Ordinary dividends: $2,158 (reported on 11.1% of returns)
Here:
$2,158
State:
$7,265
(% of AGI for various income ranges: 0.5% for AGIs below $25k, 0.4% for AGIs $25k-50k, 0.3% for AGIs $50k-75k, 0.3% for AGIs $75k-100k, 0.5% for AGIs $100k-200k, 0.8% for AGIs over 200k)
Net capital gain/loss in AGI: +$6,049 (reported on 8.6% of returns)
Here:
+$6,049
State:
+$16,323
(% of AGI for various income ranges: 0.3% for AGIs below $25k, 0.1% for AGIs $25k-50k, 0.3% for AGIs $50k-75k, 0.3% for AGIs $75k-100k, 0.8% for AGIs $100k-200k, 5.4% for AGIs over 200k)
Profit/loss from business: +$10,283 (reported on 17.3% of returns)
Here:
+$10,283
State:
+$7,583
(% of AGI for various income ranges: 9.2% for AGIs below $25k, 3.2% for AGIs $25k-50k, 2.5% for AGIs $50k-75k, 2.1% for AGIs $75k-100k, 2.9% for AGIs $100k-200k, 4.2% for AGIs over 200k)
Taxable individual retirement arrangement distribution: $13,281 (reported on 8.3% of returns)
30736:
$13,281
Georgia:
$17,199
(% of AGI for various income ranges: 2.9% for AGIs below $25k, 2.4% for AGIs $25k-50k, 1.8% for AGIs $50k-75k, 2.0% for AGIs $75k-100k, 2.2% for AGIs $100k-200k, 1.7% for AGIs over 200k)
Self-employment retirement plans: $19,025 (reported on 0.2% of returns)
30736:
$19,025
Georgia:
$23,277
Total itemized deductions: $19,916 (22% of AGI, reported on 35.3% of returns)
Here:
$19,916
State:
$23,886
Here:
21.6% of AGI
State:
21.5% of AGI
(% of AGI for various income ranges: 7.5% for AGIs below $25k, 10.9% for AGIs $25k-50k, 13.6% for AGIs $50k-75k, 15.0% for AGIs $75k-100k, 15.8% for AGIs $100k-200k, 14.4% for AGIs over 200k)
Charity contributions: $5,064 (reported on 29.3% of returns)
Here:
$5,064
State:
$5,507
(% of AGI for various income ranges: 0.9% for AGIs below $25k, 1.7% for AGIs $25k-50k, 2.5% for AGIs $50k-75k, 3.0% for AGIs $75k-100k, 3.5% for AGIs $100k-200k, 4.7% for AGIs over 200k)
Taxes paid: $5,972 (reported on 35.2% of returns)
30736:
$5,972
State:
$7,838
(% of AGI for various income ranges: 1.1% for AGIs below $25k, 2.2% for AGIs $25k-50k, 3.4% for AGIs $50k-75k, 4.4% for AGIs $75k-100k, 5.6% for AGIs $100k-200k, 5.7% for AGIs over 200k)
Earned income credit: $2,344 (reported on 20.0% of returns)
Here:
$2,344
State:
$2,589
(% of AGI for various income ranges: 7.6% for AGIs below $25k, 1.4% for AGIs $25k-50k)
Percentage of individuals using paid preparers for their 2012 taxes: 50.1%
Here:
50%
State:
55%
(% for various income ranges: 48.2% for AGIs below $25k, 49.9% for AGIs $25k-50k, 52.5% for AGIs $50k-75k, 49.1% for AGIs $75k-100k, 51.1% for AGIs $100k-200k, 75.0% for AGIs over 200k)
Averages for the 2004 tax year for zip code 30736, filed in 2005:
Average Adjusted Gross Income (AGI) in 2004: $44,362 (Individual Income Tax Returns)
Here:
$44,362
State:
$47,553
Salary/wage: $41,163 (reported on 88.5% of returns)
Here:
$41,163
State:
$42,178
(% of AGI for various income ranges: 131.8% for AGIs below $10k, 79.7% for AGIs $10k-25k, 85.1% for AGIs $25k-50k, 86.7% for AGIs $50k-75k, 86.1% for AGIs $75k-100k, 71.5% for AGIs over 100k)
Taxable interest for individuals: $1,136 (reported on 36.1% of returns)
This zip code:
$1,136
Georgia:
$1,772
(% of AGI for various income ranges: 5.8% for AGIs below $10k, 1.7% for AGIs $10k-25k, 0.8% for AGIs $25k-50k, 0.6% for AGIs $50k-75k, 0.7% for AGIs $75k-100k, 1.0% for AGIs over 100k)
Taxable dividends: $1,985 (reported on 14.1% of returns)
Here:
$1,985
State:
$4,283
(% of AGI for various income ranges: 2.2% for AGIs below $10k, 0.5% for AGIs $10k-25k, 0.3% for AGIs $25k-50k, 0.3% for AGIs $50k-75k, 0.3% for AGIs $75k-100k, 1.4% for AGIs over 100k)
Net capital gain/loss: +$8,604 (reported on 11.5% of returns)
Here:
+$8,604
State:
+$16,461
(% of AGI for various income ranges: -0.1% for AGIs below $10k, 0.2% for AGIs $10k-25k, 0.5% for AGIs $25k-50k, 0.7% for AGIs $50k-75k, 1.1% for AGIs $75k-100k, 6.5% for AGIs over 100k)
Profit/loss from business: +$7,757 (reported on 18.3% of returns)
Here:
+$7,757
State:
+$8,201
(% of AGI for various income ranges: 6.8% for AGIs below $10k, 7.7% for AGIs $10k-25k, 3.9% for AGIs $25k-50k, 2.6% for AGIs $50k-75k, 2.8% for AGIs $75k-100k, 1.8% for AGIs over 100k)
IRA payment deduction: $3,042 (reported on 2.2% of returns)
30736:
$3,042
Georgia:
$2,969
(% of AGI for various income ranges: 0.2% for AGIs $10k-25k, 0.2% for AGIs $25k-50k, 0.2% for AGIs $50k-75k, 0.1% for AGIs $75k-100k, 0.1% for AGIs over 100k)
Self-employed pension: $17,410 (reported on 0.5% of returns)
Here:
$17,410
Georgia:
$16,203
(% of AGI for various income ranges: 0.1% for AGIs $10k-25k, 0.1% for AGIs $50k-75k, 0.6% for AGIs over 100k)
Total itemized deductions: $17,339 (23% of AGI, reported on 37.8% of returns)
Here:
$17,339
State:
$19,944
Here:
23.2% of AGI
State:
22.6% of AGI
(% of AGI for various income ranges: 11.5% for AGIs below $10k, 13.8% for AGIs $10k-25k, 12.7% for AGIs $25k-50k, 14.7% for AGIs $50k-75k, 16.3% for AGIs $75k-100k, 16.0% for AGIs over 100k)
Charity contributions deductions: $4,048 (5% of AGI, reported on 32.6% of returns)
Here:
$4,048
State:
$4,354
Here:
5.2% of AGI
State:
4.7% of AGI
(% of AGI for various income ranges: 1.1% for AGIs below $10k, 1.3% for AGIs $10k-25k, 2.2% for AGIs $25k-50k, 2.8% for AGIs $50k-75k, 3.2% for AGIs $75k-100k, 4.2% for AGIs over 100k)
Total tax: $5,716 (reported on 77.4% of returns)
30736:
$5,716
State:
$8,223
(% of AGI for various income ranges: 5.0% for AGIs below $10k, 4.3% for AGIs $10k-25k, 6.3% for AGIs $25k-50k, 8.2% for AGIs $50k-75k, 10.0% for AGIs $75k-100k, 16.6% for AGIs over 100k)
Earned income credit: $1,759 (reported on 16.1% of returns)
Here:
$1,759
State:
$1,986
Percentage of individuals using paid preparers for their 2004 taxes: 57.8%
Here:
58%
State:
62%
(% for various income ranges: 49.9% for AGIs below $10k, 61.2% for AGIs $10k-25k, 59.5% for AGIs $25k-50k, 58.5% for AGIs $50k-75k, 54.7% for AGIs $75k-100k, 62.4% for AGIs over 100k)
Likely homosexual households (counted as self-reported same-sex unmarried-partner households)
Lesbian couples: 0.3% of all households
Gay men: 0.0% of all households
Household received Food Stamps/SNAP in the past 12 months: 1,398 Household did not receive Food Stamps/SNAP in the past 12 months: 15,041
Women who had a birth in the past 12 months: 216 (123 now married, 93 unmarried) Women who did not have a birth in the past 12 months: 9,651 (5,155 now married, 4,482 unmarried)
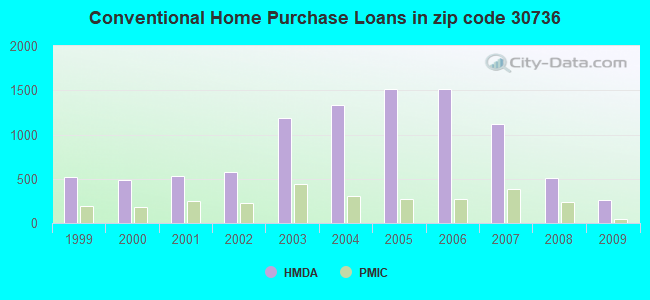
Housing units in zip code 30736 with a mortgage: 9,200 (502 second mortgage, 29 home equity loan, 342 both second mortgage and home equity loan) Houses without a mortgage: 119
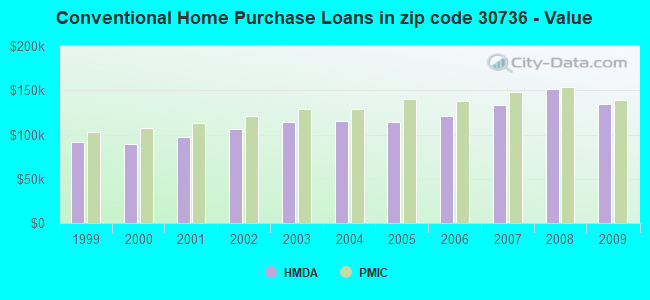
Median monthly owner costs for units with a mortgage: $1,324 Median monthly owner costs for units without a mortgage: $422
Residents with income below the poverty level in 2022:
This zip code:
5.6%
Whole state:
12.7%
Residents with income below 50% of the poverty level in 2022:
This zip code:
2.7%
Whole state:
6.3%
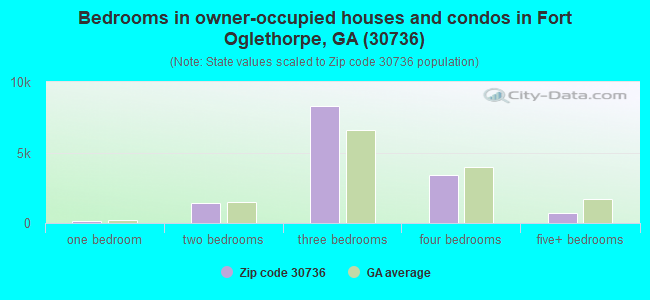
Median number of rooms in houses and condos:
Here:
6.6
State:
6.8
Median number of rooms in apartments:
Here:
4.9
State:
4.6
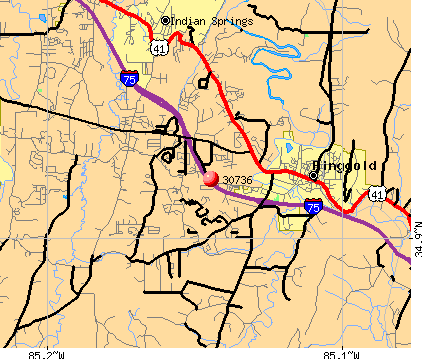
Notable locations in this zip code not listed on our city pages
Notable locations in zip code 30736: Camp Canaan (A), Catoosa Target Range (B), Poe Field (C), Kelly Field (D), Battlefield Golf Club and Estates (E), Wood Station (F), Catoosa Memorial Gardens (G), Camp Scott Patterson (H), Ringgold - Catoosa County Volunteer Fire and Rescue Station 2 (I), Kelly House (J), Ringgold - Catoosa County Volunteer Fire and Rescue Station 3 (K), Ringgold - Catoosa County Volunteer Fire and Rescue Station 4 (L), Brotherton House (M), Ringgold - Catoosa County Volunteer Fire and Rescue Station 1 (N), Hutcheson Medical Center Emergency Medical Services Ringgold (O), Viniard House (P), Salem Community Center (Q), Ringgold City Hall (R), See Remarks (S), Fort Oglethorpe Fire Department Station 3 (T). Display/hide their locations on the map
Churches in zip code 30736 include: Yates Spring Church (A), Pine Grove Church (B), Salem Baptist Church (C), Pine Grove Church (D), New Heights Baptist Church (E), New Bethel Church (F), Midway Church (G), John Calvin Church (H), House of Prayer Church (I). Display/hide their locations on the map
Cemeteries: Yates Cemetery (1), New Boynton Cemetery (2), Blackwell Cemetery (3), Dedmon Cemetery (4), Dietz Cemetery (5), Dixon Cemetery (6), Gordy Cemetery (7). Display/hide their locations on the map
Streams, rivers, and creeks: Tiger Creek (A), Peters Branch (B), Peavine Creek (C), Hurricane Creek (D), Little Chickamauga Creek (E), Kettle Branch (F), East Chickamauga Creek (G), Dry Branch (H), Catoosa Springs Branch (I). Display/hide their locations on the map
Parks in zip code 30736 include: Colquitt Monument (1), Bushrod R Johnson Monument (2), Baldwin Monument (3), Alabama Monument (4), Chickamauga and Chattanooga National Military Park (5), King Monument (6), Kentucky Monument (7), Helm Monument (8), Heg Monument (9). Display/hide their locations on the map
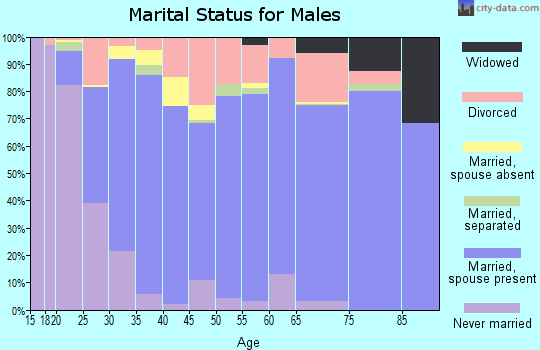
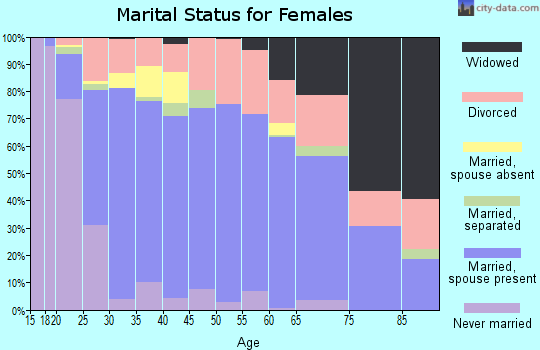
7,404 married couples with children.
1,562 single-parent households (470 men, 1,092 women).
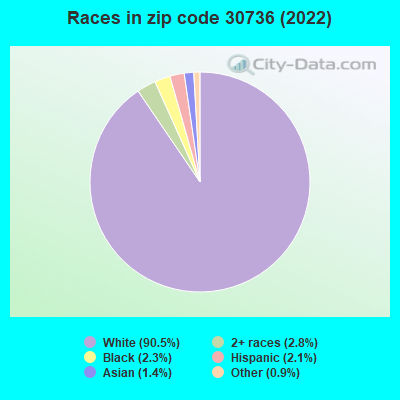
95.7% of residents of 30736 zip code speak English at home.
1.3% of residents speak Spanish at home (55% very well, 17% well, 25% not well, 3% not at all).
1.7% of residents speak other Indo-European language at home (96% very well, 3% well, 2% not well).
1.1% of residents speak Asian or Pacific Island language at home (63% very well, 19% well, 18% not well).
0.1% of residents speak other language at home (100% very well).
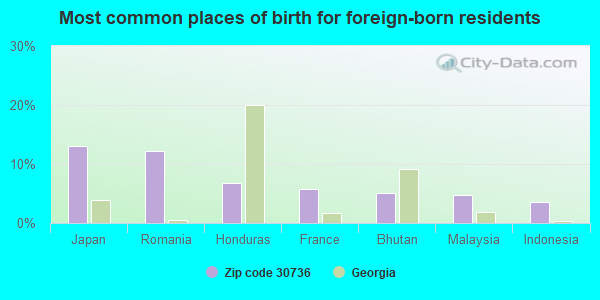
Foreign born population: 966 (2.2%) (79.9% of them are naturalized citizens)
This zip code:
2.2%
Whole state:
10.7%
13%Japan
12%Romania
7%Honduras
6%France
5%Bhutan
5%Malaysia
4%Indonesia
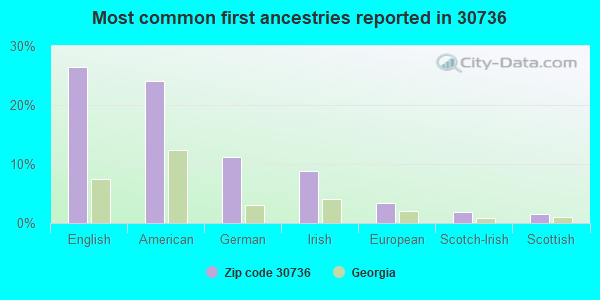
27%English
24%American
11%German
9%Irish
3%European
2%Scotch-Irish
1%Scottish
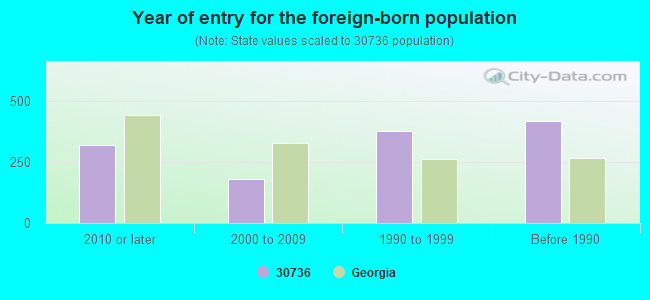
Year of entry for the foreign-born population
3202010 or later
1812000 to 2009
3771990 to 1999
415Before 1990
Major facilities with environmental interests located in this zip code:
MR. ZIP CONVENIENCE STORE #525 (4553 CLOUD SPRINGS RD in RINGGOLD, GA)
STATE MASTER (Georgia's Geographic Environmental Information) - UST-1, UNDERGROUND STORAGE TANK PROGRAM, UST-2, UST-3, (Integrated Compliance Information System) - ICIS-04-1998-0566, FORMAL ENFORCEMENT ACTION Organizations: MR ZIP INC OF TENNESSEE (CONTACT/OPERATOR)
, ESTES (INSTALLER)
Alternative names: MR ZIP STORE #525
BOYNTON ELEMENTARY SCHOOL (3938 BOYNTON DRIVE in RINGGOLD, GA)
(Geographic Names Information System) (National Center for Education Statistics) - STATE ID-1050 Organizations: CATOOSA COUNTY (SCHOOL DISTRICT)
BABB LUMBER COMPANY (6652 HWY. 41 N. in RINGGOLD, GA)
AIR MINOR (AIRS/AFS) Small Quantity Generators, between 100 kg and 1000 kg of hazardous waste/month (Resource Conservation and Recovery Act (tracking hazardous waste)) TRI REPORTER (Tracking of toxic chemicals releasing facilities) Business SIC classification: SAWMILLS AND PLANING MILLS, GENERAL; WOOD PRESERVING Business NAICS classification: SAWMILLS.; SOFTWOOD VENEER AND PLYWOOD MANUFACTURING.; METAL WINDOW AND DOOR MANUFACTURING. Organizations: OPERNAME (CONTACT/OPERATOR)
, DAVID L BABB (CONTACT/OPERATOR)
, BABB LUMBER CO INC (CONTACT/OWNER)
Alternative names: BABB LUMBER CO-RINGGOLD
CATOOSA COUNTY PUBLIC SCHOOLS PREKINDERGARTEN (307 CLEVELAND STREET in RINGGOLD, GA)
(National Center for Education Statistics) - STATE ID-6101
PENSKE TRUCK LEASING CO LP (INDUSTRIAL BLVD in RINGGOLD, GA)
(Resource Conservation and Recovery Act (tracking hazardous waste)) Organizations: OPERNAME (CONTACT/OPERATOR)
, SALEM CARPET MILLS INC (PROP. OWNER) (CONTACT/OWNER)
Alternative names: PENSKE TRUCK LEASING (FORMER)
BOC GROUP INC BOC GASES AMERICAS (54 BIGGS ROAD in RINGGOLD, GA)
National Pollutant Discharge Elimination System NON-MAJOR (Tracking pollutant discharge elimination systems) - permit TRI REPORTER (Tracking of toxic chemicals releasing facilities) Business SIC classification: INDUSTRIAL GASES Organizations: AIRGAS SOUTH INC (CONTACT/OWNER)
Alternative names: AIRGAS SOUTH INC., BOC-RINGGOLD
CATOOSA COUNTY DEVELOPMENT AUTHORITY (746 SHOPE RIDGE RD in RINGGOLD, GA)
(Resource Conservation and Recovery Act (tracking hazardous waste))
OLDCASTLE MATERIALS SOUTHEAST (SRM) (67 LOVINGOOD ROAD in RINGGOLD, GA)
AIR SYNTHETIC MINOR (AIRS/AFS) National Pollutant Discharge Elimination System NON-MAJOR (Tracking pollutant discharge elimination systems) - permit Business SIC classification: CRUSHED AND BROKEN LIMESTONE; CRUSHED AND BROKEN GRANITE Organizations: SRM AGGREGATES (CONTACT/OWNER)
Alternative names: OLDCASTLE (SRM AGGREGATES), SRM AGG-RINGGOLD QUARRY, STONE MAN, INC.
ESLINGER CONTRACTING CO INC (4849 CLOUD SPRINGS RD in RINGGOLD, GA)
Conditionally Exempt Small Quantity Generators, less than 100 kg/month of hazardous waste (Resource Conservation and Recovery Act (tracking hazardous waste)) - notification Organizations: OPERNAME (CONTACT/OPERATOR)
, RAY ESLINGER (CONTACT/OPERATOR)
, ESLINGER CONT CO INC (CONTACT/OWNER)
, CLARENCE L ESLINGER (CONTACT/OWNER)
JEFFERSON RECYCLING LLC (8310 HWY 41 SOUTH in RINGGOLD, GA)
(Resource Conservation and Recovery Act (tracking hazardous waste)) Organizations: BARRY FORD (CONTACT/OPERATOR)
, BRRY FORD (CONTACT/OWNER)
LEN LIEDEL BODY SHOP (2400 HWY 41 SOUTH in RINGGOLD, GA)
Conditionally Exempt Small Quantity Generators, less than 100 kg/month of hazardous waste (Resource Conservation and Recovery Act (tracking hazardous waste)) Organizations: OPERNAME (CONTACT/OPERATOR)
, LEIDEL LEN (CONTACT/OWNER)
, PHIL SPENCER (CONTACT/OWNER)
Alternative names: LENS BODY SHOP
MARCO TRANSPORTATION (208 S DEPOT ST in RINGGOLD, GA)
(Resource Conservation and Recovery Act (tracking hazardous waste)) Organizations: OPERNAME (CONTACT/OPERATOR)
, WINSKY RAY (CONTACT/OWNER)
MURPHYS BODY SHOP (RT 4 HWY 41 N in RINGGOLD, GA)
(Resource Conservation and Recovery Act (tracking hazardous waste)) Organizations: OPERNAME (CONTACT/OPERATOR)
, MURPHY JIMMY (CONTACT/OWNER)
Housing units lacking complete plumbing facilities: 1.7% Housing units lacking complete kitchen facilities: 1.2%
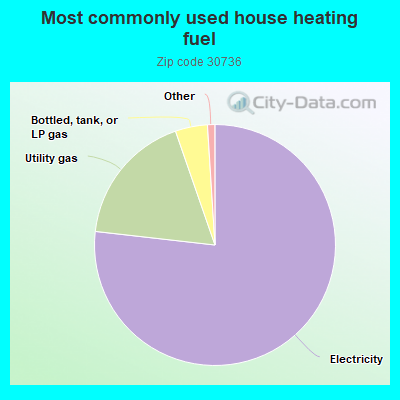
76.8%Electricity
17.9%Utility gas
4.3%Bottled, tank, or LP gas
Population in 1990: 25,360. Population change in the 1990s: +8,416 (+33.2%).
Place of birth for U.S.-born residents:
This state: 14,626
Northeast: 1,281
Midwest: 2,914
South: 23,191
West: 1,315
56% of the 30736 zip code residents lived in the same house 5 years ago. Out of people who lived in different houses, 43% lived in this county. Out of people who lived in different counties, 50% lived in Georgia.
90% of the 30736 zip code residents lived in the same house 1 year ago. Out of people who lived in different houses, 33% moved from this county. Out of people who lived in different houses, 26% moved from different county within same state. Out of people who lived in different houses, 44% moved from different state.
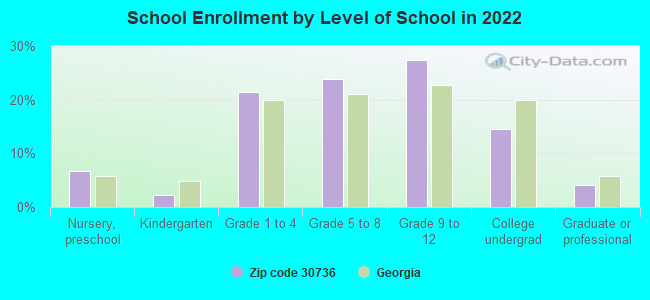
Private vs. public school enrollment:
Students in private schools in grades 1 to 8 (elementary and middle school): 789
Here:
16.0%
Georgia:
12.1%
Students in private schools in grades 9 to 12 (high school): 196
Here:
6.6%
Georgia:
10.8%
Students in private undergraduate colleges: 167
Here:
10.7%
Georgia:
17.1%
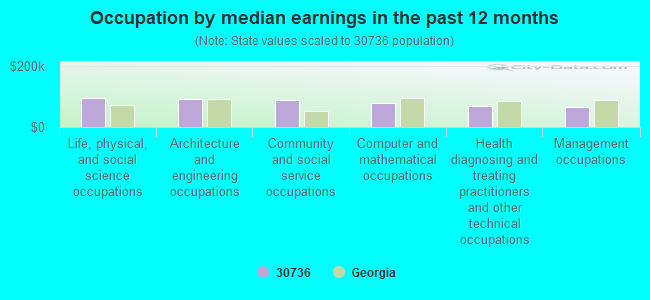
Occupation by median earnings in the past 12 months ($)
96,634Life, physical, and social science occupations
93,429Architecture and engineering occupations
87,320Community and social service occupations
79,515Computer and mathematical occupations
68,354Health diagnosing and treating practitioners and other technical occupations
66,787Management occupations
Companies with federal contracts located in this zip code:
COCHRAN'S AUTO TRUCK STOP INC (11343 HIGHWAY 41 in RINGGOLD, GA; small business) : $8,744 in 2 contractsfrom 2004 to 2005
$13,955 with Army for Fuel Oils. Signed on 2004-01-02. Completion date: 2004-01-04.
-$5,211, same as above.Signed on 2005-07-22. Completion date: 2004-01-04.
ALL WASTE DISPOSAL LLC (75 LARRY DR in RINGGOLD, GA; small business)
$3,780 with Army for Construction of Structures and Facilities -- Sewage and Waste Facilities. Taking place in MS. Signed on 2004-09-07. Completion date: 2004-01-02.
Top industries in this zip code by the number of employees in 2005:
2002 - 2018 National Fire Incident Reporting System (NFIRS) incidents
Based on the data from the years 2002 - 2018 the average number of fires per year is 238. The highest number of reported fire incidents - 311 took place in 2016, and the least - 85 in 2005. The data has an increasing trend.
When looking into fire subcategories, the most reports belonged to: Outside Fires (46.0%), and Structure Fires (33.6%).
Fire incident types reported to NFIRS in Zip Code 30736


 Nearest zip codes: 30726, 30755, 30742, 30739, 37421, 37412.
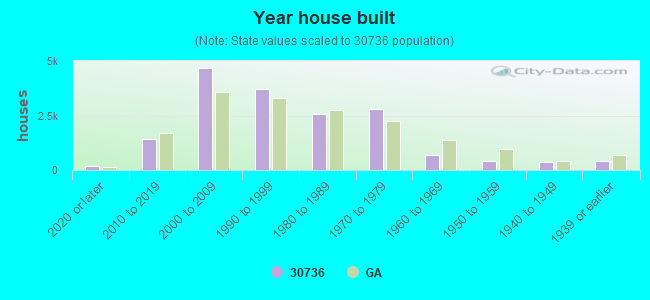


 Based on the data from the years 2002 - 2018 the average number of fires per year is 238. The highest number of reported fire incidents - 311 took place in 2016, and the least - 85 in 2005. The data has an increasing trend.
 When looking into fire subcategories, the most reports belonged to: Outside Fires (46.0%), and Structure Fires (33.6%).