Estimated zip code population in 2022: 43,721 Zip code population in 2010: 39,640 Zip code population in 2000: 37,487
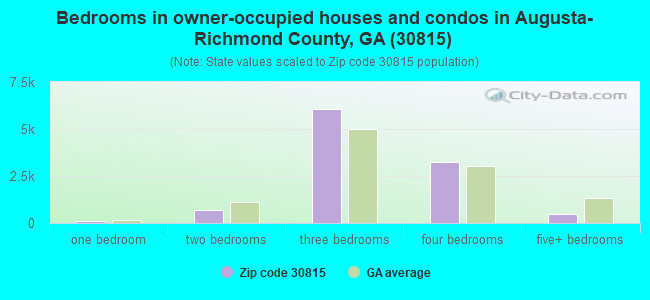
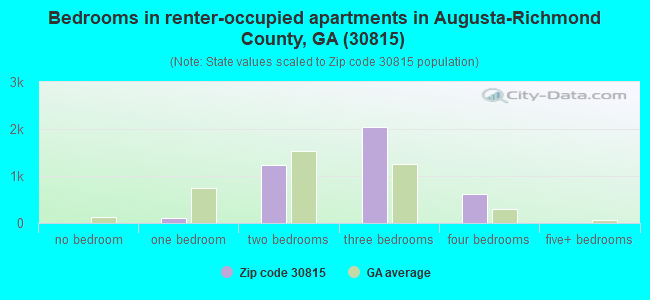
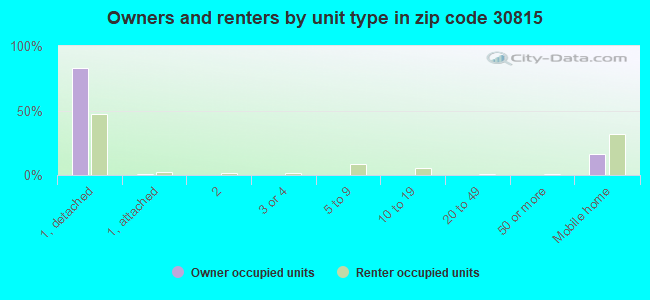
Houses and condos: 15,960 Renter-occupied apartments: 4,036
% of renters here:
27%
State:
34%
March 2022 cost of living index in zip code 30815: 89.5 (less than average, U.S. average is 100)
Land area: 130.7 sq. mi. Water area: 0.6 sq. mi.
Population density: 334 people per square mile
(very low).
OSM Map
General Map
Google Map
MSN Map
OSM Map
General Map
Google Map
MSN Map
OSM Map
General Map
Google Map
MSN Map
OSM Map
General Map
Google Map
MSN Map
Please wait while loading the map...
Real estate property taxes paid for housing units in 2022:
This zip code:
0.9% ($1,429)
Georgia:
0.7% ($2,160)
Median real estate property taxes paid for housing units with mortgages in 2022: $1,755 (0.9%) Median real estate property taxes paid for housing units with no mortgage in 2022: $815 (0.7%)
Averages for the 2020 tax year for zip code 30815, filed in 2021:
Average Adjusted Gross Income (AGI) in 2020: $43,990 (Individual Income Tax Returns)
Here:
$43,990
State:
$70,847
Salary/wage: $39,938 (reported on 83.2% of returns)
Here:
$39,938
State:
$59,126
(% of AGI for various income ranges: 1249.2% for AGIs below $25k, 3647.6% for AGIs $25k-50k, 6771.5% for AGIs $50k-75k, 10154.8% for AGIs $75k-100k, 17836.8% for AGIs $100k-200k, 38194.3% for AGIs over 200k)
Taxable interest for individuals: $725 (reported on 14.3% of returns)
This zip code:
$725
Georgia:
$2,011
(% of AGI for various income ranges: 4.3% for AGIs below $25k, 9.4% for AGIs $25k-50k, 19.4% for AGIs $50k-75k, 33.0% for AGIs $75k-100k, 62.0% for AGIs $100k-200k, 168.6% for AGIs over 200k)
Ordinary dividends: $1,758 (reported on 5.9% of returns)
Here:
$1,758
State:
$8,996
(% of AGI for various income ranges: 2.5% for AGIs below $25k, 6.5% for AGIs $25k-50k, 18.2% for AGIs $50k-75k, 33.6% for AGIs $75k-100k, 81.8% for AGIs $100k-200k, 307.1% for AGIs over 200k)
Net capital gain/loss in AGI: +$5,795 (reported on 5.2% of returns)
Here:
+$5,795
State:
+$28,402
(% of AGI for various income ranges: 0.6% for AGIs below $25k, 7.3% for AGIs $25k-50k, 32.0% for AGIs $50k-75k, 81.8% for AGIs $75k-100k, 320.6% for AGIs $100k-200k, 1937.1% for AGIs over 200k)
Taxable individual retirement arrangement distribution: $15,534 (reported on 4.6% of returns)
30815:
$15,534
Georgia:
$20,525
(% of AGI for various income ranges: 15.9% for AGIs below $25k, 47.8% for AGIs $25k-50k, 150.2% for AGIs $50k-75k, 199.0% for AGIs $75k-100k, 456.0% for AGIs $100k-200k, 3085.7% for AGIs over 200k)
Total itemized deductions: $27,013 (reported on 8.7% of returns)
Here:
$27,013
State:
$34,001
(% of AGI for various income ranges: 24.1% for AGIs below $25k, 176.5% for AGIs $25k-50k, 601.6% for AGIs $50k-75k, 884.4% for AGIs $75k-100k, 1686.0% for AGIs $100k-200k, 3738.6% for AGIs over 200k)
Charity contributions: $11,017 (reported on 7.8% of returns)
Here:
$11,017
State:
$14,164
(% of AGI for various income ranges: 5.6% for AGIs below $25k, 49.9% for AGIs $25k-50k, 194.5% for AGIs $50k-75k, 324.7% for AGIs $75k-100k, 751.8% for AGIs $100k-200k, 1654.3% for AGIs over 200k)
Taxes paid: $5,790 (reported on 8.6% of returns)
30815:
$5,790
State:
$7,540
(% of AGI for various income ranges: 3.2% for AGIs below $25k, 27.3% for AGIs $25k-50k, 109.4% for AGIs $50k-75k, 204.6% for AGIs $75k-100k, 440.8% for AGIs $100k-200k, 848.6% for AGIs over 200k)
Earned income credit: $2,612 (reported on 28.6% of returns)
Here:
$2,612
State:
$2,530
(% of AGI for various income ranges: 152.3% for AGIs below $25k, 99.4% for AGIs $25k-50k, 1.2% for AGIs $50k-75k)
Percentage of individuals using paid preparers for their 2020 taxes: 93.3%
Here:
93%
State:
93%
(% for various income ranges: 93.7% for AGIs below $25k, 93.7% for AGIs $25k-50k, 91.7% for AGIs $50k-75k, 93.1% for AGIs $75k-100k, 92.9% for AGIs $100k-200k, 93.8% for AGIs over 200k)
Averages for the 2012 tax year for zip code 30815, filed in 2013:
Average Adjusted Gross Income (AGI) in 2012: $38,632 (Individual Income Tax Returns)
Here:
$38,632
State:
$56,131
Salary/wage: $35,126 (reported on 86.2% of returns)
Here:
$35,126
State:
$47,942
(% of AGI for various income ranges: 80.4% for AGIs below $25k, 82.4% for AGIs $25k-50k, 77.7% for AGIs $50k-75k, 78.6% for AGIs $75k-100k, 78.9% for AGIs $100k-200k, 33.2% for AGIs over 200k)
Taxable interest for individuals: $646 (reported on 16.2% of returns)
This zip code:
$646
Georgia:
$1,706
(% of AGI for various income ranges: 0.5% for AGIs below $25k, 0.2% for AGIs $25k-50k, 0.2% for AGIs $50k-75k, 0.2% for AGIs $75k-100k, 0.2% for AGIs $100k-200k, 0.4% for AGIs over 200k)
Ordinary dividends: $1,409 (reported on 6.7% of returns)
Here:
$1,409
State:
$7,265
(% of AGI for various income ranges: 0.2% for AGIs below $25k, 0.1% for AGIs $25k-50k, 0.2% for AGIs $50k-75k, 0.2% for AGIs $75k-100k, 0.5% for AGIs $100k-200k, 0.3% for AGIs over 200k)
Net capital gain/loss in AGI: +$2,727 (reported on 4.0% of returns)
Here:
+$2,727
State:
+$16,323
(% of AGI for various income ranges: 0.2% for AGIs $75k-100k, 0.4% for AGIs $100k-200k, 4.9% for AGIs over 200k)
Profit/loss from business: +$2,441 (reported on 15.7% of returns)
Here:
+$2,441
State:
+$7,583
(% of AGI for various income ranges: 6.7% for AGIs below $25k, 0.1% for AGIs $100k-200k)
Taxable individual retirement arrangement distribution: $10,895 (reported on 4.6% of returns)
30815:
$10,895
Georgia:
$17,199
(% of AGI for various income ranges: 1.0% for AGIs below $25k, 1.3% for AGIs $25k-50k, 1.2% for AGIs $50k-75k, 1.4% for AGIs $75k-100k, 1.7% for AGIs $100k-200k)
Total itemized deductions: $18,434 (27% of AGI, reported on 31.8% of returns)
Here:
$18,434
State:
$23,886
Here:
27.2% of AGI
State:
21.5% of AGI
(% of AGI for various income ranges: 7.3% for AGIs below $25k, 14.7% for AGIs $25k-50k, 18.2% for AGIs $50k-75k, 17.5% for AGIs $75k-100k, 17.7% for AGIs $100k-200k, 10.6% for AGIs over 200k)
Charity contributions: $4,821 (reported on 28.1% of returns)
Here:
$4,821
State:
$5,507
(% of AGI for various income ranges: 1.2% for AGIs below $25k, 3.1% for AGIs $25k-50k, 4.2% for AGIs $50k-75k, 4.3% for AGIs $75k-100k, 4.5% for AGIs $100k-200k, 3.2% for AGIs over 200k)
Taxes paid: $5,014 (reported on 31.6% of returns)
30815:
$5,014
State:
$7,838
(% of AGI for various income ranges: 1.1% for AGIs below $25k, 3.0% for AGIs $25k-50k, 4.6% for AGIs $50k-75k, 5.3% for AGIs $75k-100k, 6.1% for AGIs $100k-200k, 5.4% for AGIs over 200k)
Earned income credit: $2,704 (reported on 33.5% of returns)
Here:
$2,704
State:
$2,589
(% of AGI for various income ranges: 12.2% for AGIs below $25k, 1.7% for AGIs $25k-50k)
Percentage of individuals using paid preparers for their 2012 taxes: 54.5%
Here:
55%
State:
55%
(% for various income ranges: 50.2% for AGIs below $25k, 53.7% for AGIs $25k-50k, 60.3% for AGIs $50k-75k, 64.3% for AGIs $75k-100k, 65.3% for AGIs $100k-200k, 80.0% for AGIs over 200k)
Averages for the 2004 tax year for zip code 30815, filed in 2005:
Average Adjusted Gross Income (AGI) in 2004: $32,360 (Individual Income Tax Returns)
Here:
$32,360
State:
$47,553
Salary/wage: $30,758 (reported on 90.6% of returns)
Here:
$30,758
State:
$42,178
(% of AGI for various income ranges: 103.0% for AGIs below $10k, 85.7% for AGIs $10k-25k, 88.0% for AGIs $25k-50k, 85.7% for AGIs $50k-75k, 86.2% for AGIs $75k-100k, 77.9% for AGIs over 100k)
Taxable interest for individuals: $626 (reported on 22.8% of returns)
This zip code:
$626
Georgia:
$1,772
(% of AGI for various income ranges: 1.4% for AGIs below $10k, 0.4% for AGIs $10k-25k, 0.4% for AGIs $25k-50k, 0.3% for AGIs $50k-75k, 0.3% for AGIs $75k-100k, 0.8% for AGIs over 100k)
Taxable dividends: $1,123 (reported on 8.5% of returns)
Here:
$1,123
State:
$4,283
(% of AGI for various income ranges: 0.4% for AGIs below $10k, 0.2% for AGIs $10k-25k, 0.1% for AGIs $25k-50k, 0.2% for AGIs $50k-75k, 0.2% for AGIs $75k-100k, 1.3% for AGIs over 100k)
Net capital gain/loss: +$2,255 (reported on 5.7% of returns)
Here:
+$2,255
State:
+$16,461
(% of AGI for various income ranges: -0.2% for AGIs below $10k, -0.0% for AGIs $10k-25k, 0.1% for AGIs $25k-50k, 0.2% for AGIs $50k-75k, 0.4% for AGIs $75k-100k, 2.4% for AGIs over 100k)
Profit/loss from business: +$2,922 (reported on 13.0% of returns)
Here:
+$2,922
State:
+$8,201
(% of AGI for various income ranges: 0.0% for AGIs below $10k, 3.6% for AGIs $10k-25k, 1.1% for AGIs $25k-50k, 0.0% for AGIs $50k-75k, 0.3% for AGIs $75k-100k, 1.7% for AGIs over 100k)
IRA payment deduction: $2,183 (reported on 2.7% of returns)
30815:
$2,183
Georgia:
$2,969
(% of AGI for various income ranges: 0.2% for AGIs $10k-25k, 0.3% for AGIs $25k-50k, 0.2% for AGIs $50k-75k, 0.0% for AGIs $75k-100k, 0.1% for AGIs over 100k)
Self-employed pension: $3,222 (reported on 0.3% of returns)
Here:
$3,222
Georgia:
$16,203
Total itemized deductions: $16,241 (30% of AGI, reported on 35.2% of returns)
Here:
$16,241
State:
$19,944
Here:
29.6% of AGI
State:
22.6% of AGI
(% of AGI for various income ranges: 6.3% for AGIs below $10k, 8.9% for AGIs $10k-25k, 19.5% for AGIs $25k-50k, 20.8% for AGIs $50k-75k, 19.7% for AGIs $75k-100k, 19.0% for AGIs over 100k)
Charity contributions deductions: $3,948 (7% of AGI, reported on 32.8% of returns)
Here:
$3,948
State:
$4,354
Here:
7.1% of AGI
State:
4.7% of AGI
(% of AGI for various income ranges: 0.6% for AGIs below $10k, 1.6% for AGIs $10k-25k, 4.0% for AGIs $25k-50k, 4.7% for AGIs $50k-75k, 4.9% for AGIs $75k-100k, 5.5% for AGIs over 100k)
Total tax: $3,418 (reported on 63.1% of returns)
30815:
$3,418
State:
$8,223
(% of AGI for various income ranges: 2.5% for AGIs below $10k, 2.8% for AGIs $10k-25k, 4.7% for AGIs $25k-50k, 7.3% for AGIs $50k-75k, 9.1% for AGIs $75k-100k, 13.7% for AGIs over 100k)
Earned income credit: $2,139 (reported on 31.7% of returns)
Here:
$2,139
State:
$1,986
Percentage of individuals using paid preparers for their 2004 taxes: 67.4%
Here:
67%
State:
62%
(% for various income ranges: 60.6% for AGIs below $10k, 69.3% for AGIs $10k-25k, 69.4% for AGIs $25k-50k, 68.6% for AGIs $50k-75k, 67.4% for AGIs $75k-100k, 70.8% for AGIs over 100k)
Likely homosexual households (counted as self-reported same-sex unmarried-partner households)
Lesbian couples: 0.4% of all households
Gay men: 0.0% of all households
Household received Food Stamps/SNAP in the past 12 months: 2,436 Household did not receive Food Stamps/SNAP in the past 12 months: 12,281
Women who had a birth in the past 12 months: 660 (241 now married, 417 unmarried) Women who did not have a birth in the past 12 months: 10,505 (2,942 now married, 7,575 unmarried)
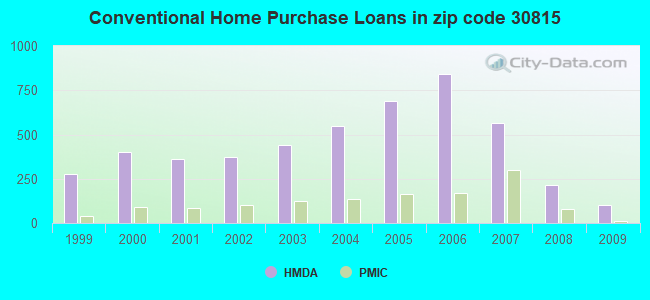
Housing units in zip code 30815 with a mortgage: 6,576 (189 second mortgage, 175 both second mortgage and home equity loan) Houses without a mortgage: 72
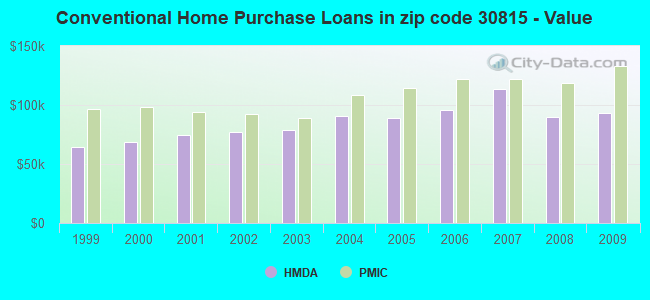
Median monthly owner costs for units with a mortgage: $1,279 Median monthly owner costs for units without a mortgage: $394
Residents with income below the poverty level in 2022:
This zip code:
13.0%
Whole state:
12.7%
Residents with income below 50% of the poverty level in 2022:
This zip code:
8.3%
Whole state:
6.3%
Median number of rooms in houses and condos:
Here:
6.6
State:
6.8
Median number of rooms in apartments:
Here:
5.2
State:
4.6
Notable locations in this zip code not listed on our city pages
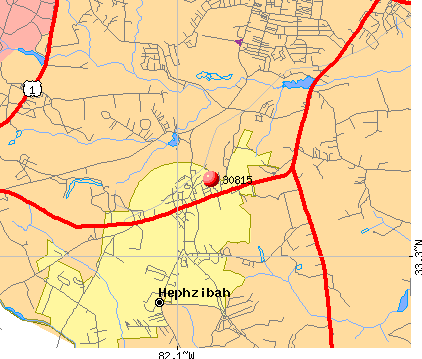
Notable locations in zip code 30815: Augusta Racetrack (A), Hephzibah Fire Department (B), Augusta Fire Department Station 18 (C), Burke County Emergency Management Agency Engine Company 3 (D), Augusta Fire Department Station 19 (E). Display/hide their locations on the map
Churches in zip code 30815 include: Berlin Church (A), Chalk Mine Memorial Church (B), Ebenezer Church (C), Franklin Covenant Church (D), Friendship Church (E), Green Branch Church (F), Johnsons Grove Church (G), New Hope Church (H), Liberty Church (I). Display/hide their locations on the map
Cemeteries: Atkins Cemetery (1), Saxon Cemetery (2), Malone Cemetery (3), Brothersville Cemetery (4), Burton Cemetery (5), Clarks Chapel Cemetery (6), George Palmer Cemetery (7). Display/hide their locations on the map
Reservoirs: Dorns Pond (A), Hancock Millpond (B), James Pond (C), Jolly Pond (D), Lombard Millpond (E), Marks Mill Pond (F), McDonald Pond (G), Rhodes Pond (H). Display/hide their locations on the map
Streams, rivers, and creeks: Wheeler Branch (A), Camp Branch (B), Johnsons Branch (C), Jennys Branch (D), Spirit Creek (E), Allen Branch (F), South Prong Creek (G), Travers Branch (H), Smith Branch (I). Display/hide their locations on the map
3,579 married couples with children.
4,651 single-parent households (985 men, 3,666 women).
92.5% of residents of 30815 zip code speak English at home.
3.0% of residents speak Spanish at home (67% very well, 25% well, 7% not well, 1% not at all).
2.3% of residents speak other Indo-European language at home (90% very well, 10% well).
1.4% of residents speak Asian or Pacific Island language at home (55% very well, 24% well, 10% not well, 11% not at all).
0.5% of residents speak other language at home (72% very well, 28% well).
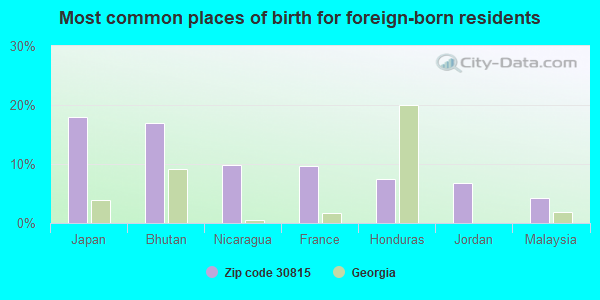
Foreign born population: 1,739 (4.0%) (80.0% of them are naturalized citizens)
This zip code:
4.0%
Whole state:
10.7%
18%Japan
17%Bhutan
10%Nicaragua
10%France
7%Honduras
7%Jordan
4%Malaysia
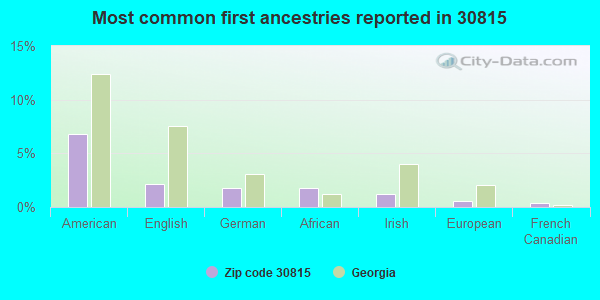
7%American
2%English
2%German
2%African
1%Irish
1%European
0%French Canadian
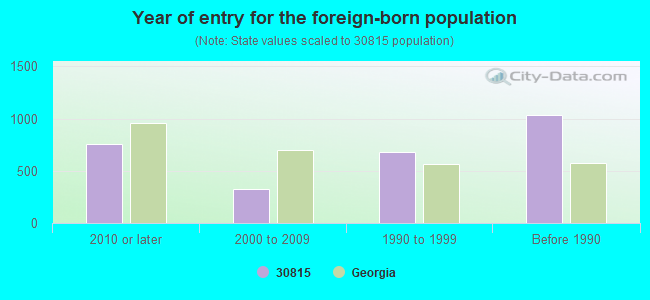
Year of entry for the foreign-born population
7582010 or later
3252000 to 2009
6811990 to 1999
1,035Before 1990
Facilities with environmental interests located in this zip code:
MORGAN ROAD MIDDLE SCHOOL (3635 HIERS BOULEVARD in HEPHZIBAH, GA)
(Geographic Names Information System) (National Center for Education Statistics) - STATE ID-0184 Organizations: RICHMOND COUNTY (SCHOOL DISTRICT)
MCBEAN ELEMENTARY SCHOOL (1165 HEPHZIBAH/MCBEAN ROAD in HEPHZIBAH, GA)
(National Center for Education Statistics) - STATE ID-0297 Organizations: RICHMOND COUNTY (SCHOOL DISTRICT)
RACO 88 (2501 HWY 88 in HEPHZIBAH, GA)
(Integrated Compliance Information System) - ICIS-04-2004-9803, FORMAL ENFORCEMENT ACTION
FAST FARE GA-507 (3501 WINDSOR SPRING RD in HEPHZIBAH, GA)
(Resource Conservation and Recovery Act (tracking hazardous waste)) Organizations: FAST FARE INC (CONTACT/OWNER)
Alternative names: CROWN GA-507/ZIPPY MART #434
FAST FARE GA-511 (2759 TOBACCO RD in HEPHZIBAH, GA)
(Resource Conservation and Recovery Act (tracking hazardous waste)) Organizations: CROWN CENTRAL PETROLEUM CORP (CONTACT/OWNER)
Alternative names: CROWN GA-511
JEFFERSON EMC (2547 HIGHWAY 88 in HEPHZIBAH, GA)
(Resource Conservation and Recovery Act (tracking hazardous waste)) Organizations: JEFFERSON ELECT MEMBERSHIP CORPORATION (CONTACT/OWNER)
BP OIL SITE #00016 (3601 WINDSOR SPRINGS RD in HEPHZIBAH, GA)
Conditionally Exempt Small Quantity Generators, less than 100 kg/month of hazardous waste (Resource Conservation and Recovery Act (tracking hazardous waste)) - notification Organizations: BP OIL-COMPANY OP (CONTACT/OWNER)
OGLETHORPE POWER CORP (4185 WINDSOR SPRINGS in HEPHZIBAH, GA)
AIR SYNTHETIC MINOR (AIRS/AFS) Business SIC classification: ELECTRIC SERVICES Alternative names: JEFFERSON ENERGY COOPERATIVE BOYKIN RD, JEFFERSON ENERGY COOPERATIVE BOYKIN RD
OGLETHORPE POWER CORP (2936 OLD TOBACCO RD in HEPHZIBAH, GA)
AIR SYNTHETIC MINOR (AIRS/AFS) Business SIC classification: ELECTRIC SERVICES Alternative names: OGLETHORPE POWER CORP-TOBACCO RD
FAST FARE #508 (2490 HWY 88 in HEPZIBAH, GA)
ENFORCEMENT/COMPLIANCE ACTIVITY (Integrated Compliance Information System)
Housing units lacking complete plumbing facilities: 0.7% Housing units lacking complete kitchen facilities: 2.0%
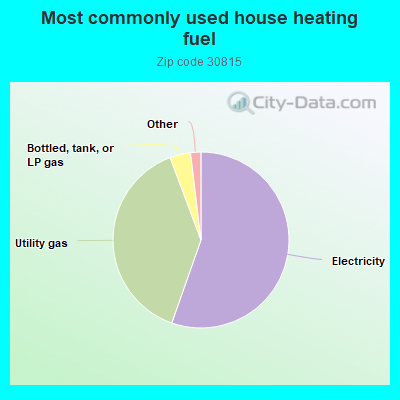
55.4%Electricity
38.9%Utility gas
3.8%Bottled, tank, or LP gas
0.7%Fuel oil, kerosene, etc.
0.6%Wood
Population in 1990: 27,838. Population change in the 1990s: +9,649 (+34.7%).
Place of birth for U.S.-born residents:
This state: 27,226
Northeast: 1,767
Midwest: 2,397
South: 7,526
West: 1,803
55% of the 30815 zip code residents lived in the same house 5 years ago. Out of people who lived in different houses, 62% lived in this county. Out of people who lived in different counties, 50% lived in Georgia.
90% of the 30815 zip code residents lived in the same house 1 year ago. Out of people who lived in different houses, 49% moved from this county. Out of people who lived in different houses, 22% moved from different county within same state. Out of people who lived in different houses, 26% moved from different state. Out of people who lived in different houses, 2% moved from abroad.
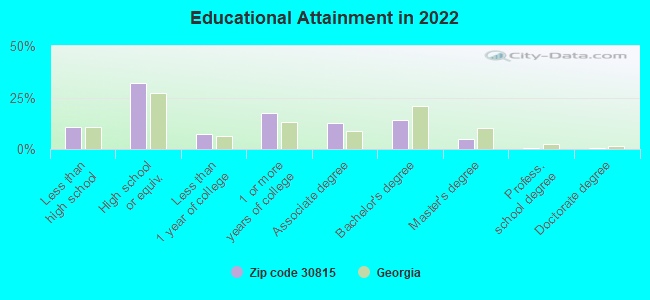
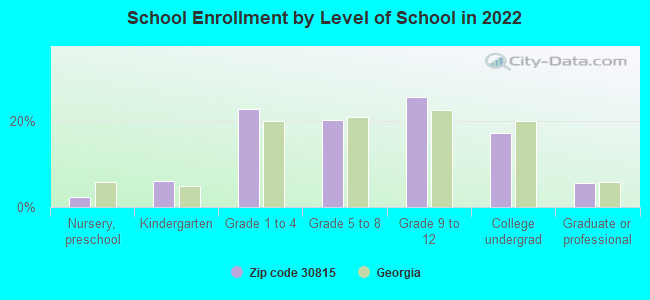
Private vs. public school enrollment:
Students in private schools in grades 1 to 8 (elementary and middle school): 400
Here:
8.7%
Georgia:
12.1%
Students in private schools in grades 9 to 12 (high school): 269
Here:
9.8%
Georgia:
10.8%
Students in private undergraduate colleges: 229
Here:
12.4%
Georgia:
17.1%
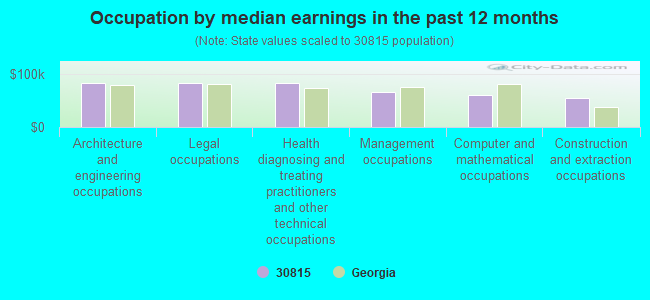
Occupation by median earnings in the past 12 months ($)
82,754Architecture and engineering occupations
82,749Legal occupations
82,025Health diagnosing and treating practitioners and other technical occupations
66,517Management occupations
59,677Computer and mathematical occupations
54,118Construction and extraction occupations
Companies with federal contracts located in this zip code (HEPHZIBAH, GA):
CSRA OFFICIALS ASSOCIATION (2709 CROSSHAVEN DR; small business) : $617,914 in 18 contractsfrom 1999 to 2005
Contracts for Recreational Services by Army Signed by year:2000: $27,300; 2001: $0; 2002: $358,241; 2003: $112,920; 2004: $134,877; 2005: -$44,382; 2006: $0.
Biggest contracts:
$127,689 with Army for Recreational Services. Signed on 2003-10-28. Completion date: 2004-09-30.
$120,159, same as above.Signed on 2002-10-30. Completion date: 2003-09-30.
$120,159, same as above.Signed on 2002-08-22. Completion date: 2003-09-30.
$116,781, same as above.Signed on 2004-11-04. Completion date: 2004-09-30.
FRANKLIN D NEELY AND SON FARMS (5171 NEELY ROAD; small business) : $233,903 in 6 contractsfrom 2002 to 2005
Contracts for Fruits and Vegetables by Defense Logistics Agency Signed by year:2000: $0; 2001: $0; 2002: $208,361; 2003: $0; 2004: $22,394; 2005: $3,148; 2006: $0.
Biggest contracts:
$208,361 with Defense Logistics Agency for Fruits and Vegetables. Signed on 2002-06-10. Completion date: 2002-06-10.
$7,940, same as above.Signed on 2004-10-02. Completion date: 2004-10-02.
$7,725, same as above.Signed on 2004-12-28. Completion date: 2004-12-28.
$4,218, same as above.Signed on 2004-12-01. Completion date: 2004-12-01.
OPTIMUM CARE SERVICE INC (3699 WOODCOCK DR; small business) : $112,720 in 3 contractsfrom 2002 to 2004
$96,000 with Army for Drugs and Biologicals. Signed on 2002-03-27. Completion date: 2002-10-18.
$25,920 with Army for Nursing Services. Signed on 2002-03-22. Completion date: 2002-06-25.
-$9,200 with Army for Drugs and Biologicals. Signed on 2004-02-10. Completion date: 2002-10-18.
ELA ENTERPRISES INC (4333 BIG DIPPER CIR; small business) : $100,000 in 2 contractsin 2003
$102,821 with Army for Maintenance, Repair or Alteration of Real Property -- Other Non-Building Facilities. Signed on 2003-09-30. Completion date: 2003-12-15.
-$2,821, same as above.Signed on 2003-11-17. Completion date: 2003-12-15.
MARGARET WARD (2382 TURKEY TRAIL DR; small business) : $98,080 in 7 contractsfrom 2003 to 2006
Contracts for Operation of Government-Owned Facilities -- Recreation Facilities (Non-Building) by U.S. Army Corps of Engineers - civil program financing only, Army Signed by year:2000: $0; 2001: $0; 2002: $0; 2003: $39,596; 2004: $0; 2005: $39,416; 2006: $19,068.
Biggest contracts:
$19,798 with U.S. Army Corps of Engineers - civil program financing only for Operation of Government-Owned Facilities -- Recreation Facilities (Non-Building). Taking place in SC. Signed on 2003-12-23. Completion date: 2005-02-19.
$19,798 with Army for Operation of Government-Owned Facilities -- Recreation Facilities (Non-Building). Taking place in SC. Signed on 2003-12-23. Completion date: 2005-02-19.
$19,708, same as above.Signed on 2005-02-22. Completion date: 2005-02-19.
$19,708 with U.S. Army Corps of Engineers - civil program financing only for Operation of Government-Owned Facilities -- Recreation Facilities (Non-Building). Taking place in SC. Signed on 2005-02-22. Completion date: 2005-02-19.
TOBACCO ROAD GARDEN CENTER (2749 TOBACCO RD; small business) : $26,840 in 9 contractsfrom 2004 to 2006
Contracts for Non-Food Items For Resale by Defense Commissary Agency Signed by year:2000: $0; 2001: $0; 2002: $0; 2003: $0; 2004: $11,828; 2005: $10,744; 2006: $4,268.
Biggest contracts:
$11,828 with Defense Commissary Agency for Non-Food Items For Resale. Signed on 2004-10-01. Completion date: 2005-03-31.
$4,902, same as above.Signed on 2005-04-01. Completion date: 2005-06-30.
$2,965, same as above.Signed on 2006-03-01. Completion date: 2006-03-31.
$1,461, same as above.Signed on 2005-08-01. Completion date: 2005-08-31.
FLYING COLOR PAINTBALL & RECRE (5149 WESTBROOK RD; small business)
$5,910 with Army for Recreational and Gymnastic Equipment. Signed on 2005-08-17. Completion date: 2005-08-17.
GODLY CARE LAWN SERVICE, LLC (2110 STOREY MILL ESTATE DR; small business)
$2,040 with Army for Landscaping/Groundskeeping Services. Signed on 2006-06-01. Completion date: 2006-05-31.
TOTAL FORCE INC (3002 TOBACCO RD; small business)
$83 with Navy for Laundry and DryCleaning Services. Signed on 2004-02-11. Completion date: 2004-10-12.
Top industries in this zip code by the number of employees in 2005:
2002 - 2018 National Fire Incident Reporting System (NFIRS) incidents
Based on the data from the years 2002 - 2018 the average number of fires per year is 146. The highest number of reported fire incidents - 324 took place in 2014, and the least - 19 in 2003. The data has a dropping trend.
When looking into fire subcategories, the most incidents belonged to: Outside Fires (55.9%), and Structure Fires (30.4%).
Fire incident types reported to NFIRS in Zip Code 30815

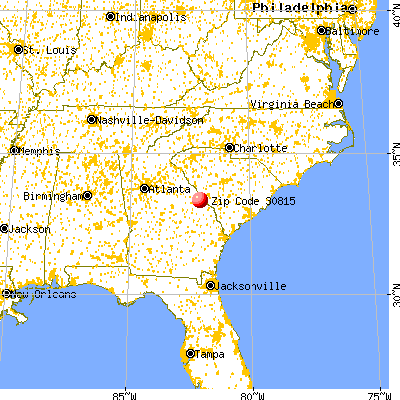


 Nearest zip codes: 30812, 30805, 30906, 30905, 30816, 30909.


 Based on the data from the years 2002 - 2018 the average number of fires per year is 146. The highest number of reported fire incidents - 324 took place in 2014, and the least - 19 in 2003. The data has a dropping trend.
 When looking into fire subcategories, the most incidents belonged to: Outside Fires (55.9%), and Structure Fires (30.4%).