Estimated zip code population in 2022: 2,249 Zip code population in 2010: 2,683 Zip code population in 2000: 2,246
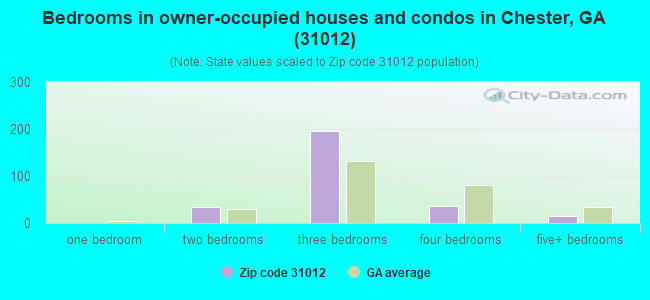
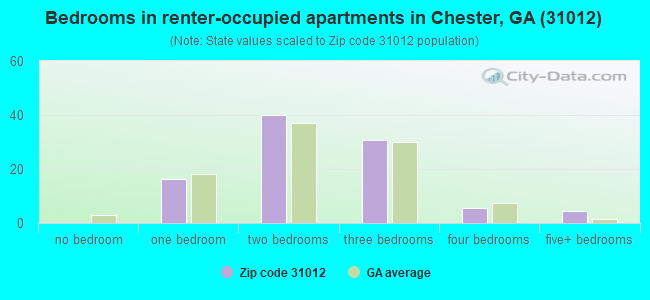
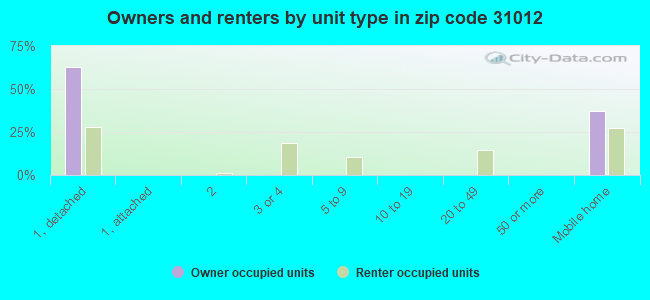
Houses and condos: 515 Renter-occupied apartments: 97
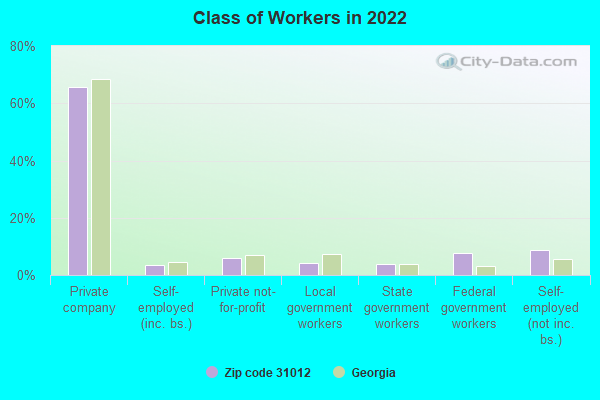
% of renters here:
26%
State:
34%
March 2022 cost of living index in zip code 31012: 78.3 (low, U.S. average is 100)
Land area: 54.4 sq. mi. Water area: 0.8 sq. mi.
Population density: 41 people per square mile
(very low).
OSM Map
General Map
Google Map
MSN Map
OSM Map
General Map
Google Map
MSN Map
OSM Map
General Map
Google Map
MSN Map
OSM Map
General Map
Google Map
MSN Map
Please wait while loading the map...
Real estate property taxes paid for housing units in 2022:
This zip code:
0.5% ($738)
Georgia:
0.7% ($2,160)
Median real estate property taxes paid for housing units with mortgages in 2022: $1,233 (0.5%) Median real estate property taxes paid for housing units with no mortgage in 2022: $578 (0.5%)
Business Search- 14 Million verified businesses
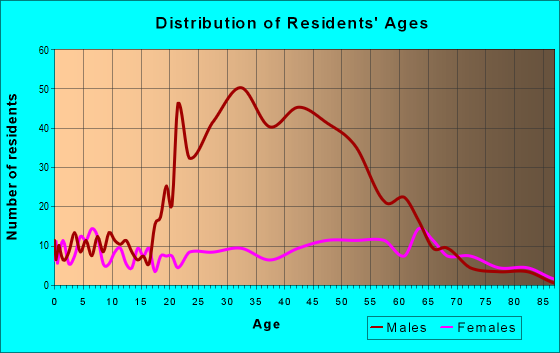
Males: 1,766
(78.6%)
Females: 479
(21.4%)
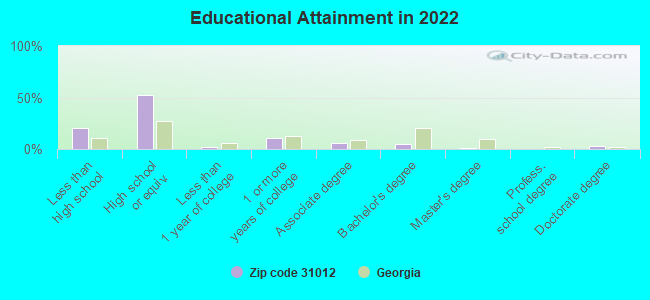
For population 25 years and over in 31012:
High school or higher: 78.2%
Bachelor's degree or higher: 8.7%
Graduate or professional degree: 4.2%
Unemployed: 0.9%
Mean travel time to work (commute): 36.8 minutes
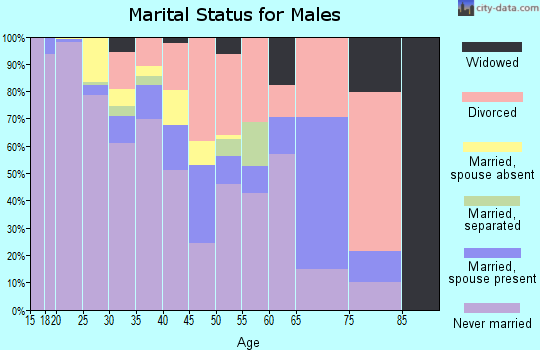
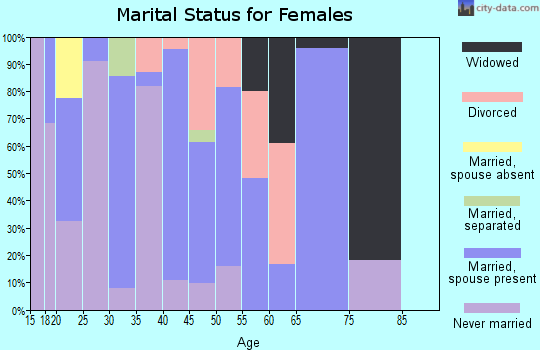
For population 15 years and over in 31012:
Never married: 44.0%
Now married: 27.2%
Separated: 3.4%
Widowed: 3.1%
Divorced: 22.3%
Zip code 31012 compared to state average:
Median house value below state average.
Unemployed percentage significantly below state average.
Hispanic race population percentage below state average.
Foreign-born population percentage significantly below state average.
Length of stay since moving in significantly above state average.
Number of college students below state average.
Percentage of population with a bachelor's degree or higher significantly below state average.
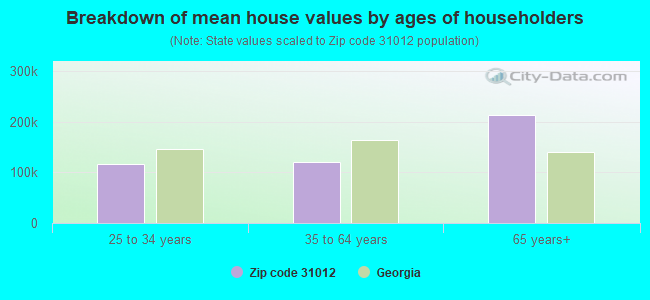
Estimated median house/condo value in 2022: $146,825
31012:
$146,825
Georgia:
$297,400
According to our research of Georgia and other state lists, there were 6 registered sex offenders living in 31012 zip code as of April 27, 2024. The ratio of all residents to sex offenders in zip code 31012 is 470 to 1. The ratio of registered sex offenders to all residents in this zip code is near the state average.
Median resident age:
This zip code:
41.4 years
Georgia median age:
37.6 years
Average household size:
This zip code:
2.7 people
Georgia:
2.6 people
Averages for the 2020 tax year for zip code 31012, filed in 2021:
Average Adjusted Gross Income (AGI) in 2020: $43,973 (Individual Income Tax Returns)
Here:
$43,973
State:
$70,847
Salary/wage: $43,188 (reported on 76.4% of returns)
Here:
$43,188
State:
$59,126
(% of AGI for various income ranges: 1456.5% for AGIs below $25k, 3797.0% for AGIs $25k-50k, 6721.7% for AGIs $50k-75k, 9736.7% for AGIs $75k-100k, 16373.3% for AGIs $100k-200k)
Taxable interest for individuals: $459 (reported on 30.9% of returns)
This zip code:
$459
Georgia:
$2,011
(% of AGI for various income ranges: 5.3% for AGIs below $25k, 6.0% for AGIs $25k-50k, 75.0% for AGIs $50k-75k, 60.0% for AGIs $100k-200k)
Ordinary dividends: $1,375 (reported on 7.3% of returns)
Here:
$1,375
State:
$8,996
(% of AGI for various income ranges: 91.7% for AGIs $50k-75k)
Net capital gain/loss in AGI: +$1,325 (reported on 7.3% of returns)
Here:
+$1,325
State:
+$28,402
(% of AGI for various income ranges: 88.3% for AGIs $50k-75k)
Taxable individual retirement arrangement distribution: $8,467 (reported on 5.5% of returns)
31012:
$8,467
Georgia:
$20,525
(% of AGI for various income ranges: 254.0% for AGIs $25k-50k)
Total itemized deductions: $27,650 (reported on 3.6% of returns)
Here:
$27,650
State:
$34,001
(% of AGI for various income ranges: 553.0% for AGIs $25k-50k)
Charity contributions: $14,000 (reported on 3.6% of returns)
Here:
$14,000
State:
$14,164
(% of AGI for various income ranges: 280.0% for AGIs $25k-50k)
Taxes paid: $4,950 (reported on 3.6% of returns)
31012:
$4,950
State:
$7,540
(% of AGI for various income ranges: 99.0% for AGIs $25k-50k)
Earned income credit: $3,007 (reported on 25.5% of returns)
Here:
$3,007
State:
$2,530
(% of AGI for various income ranges: 181.2% for AGIs below $25k, 113.0% for AGIs $25k-50k)
Percentage of individuals using paid preparers for their 2020 taxes: 89.1%
Here:
89%
State:
93%
(% for various income ranges: 80.0% for AGIs below $25k, 92.3% for AGIs $25k-50k, 100.0% for AGIs $50k-75k, 100.0% for AGIs $75k-100k, 100.0% for AGIs $100k-200k)
Averages for the 2012 tax year for zip code 31012, filed in 2013:
Average Adjusted Gross Income (AGI) in 2012: $40,134 (Individual Income Tax Returns)
Here:
$40,134
State:
$56,131
Salary/wage: $34,844 (reported on 82.0% of returns)
Here:
$34,844
State:
$47,942
(% of AGI for various income ranges: 80.8% for AGIs below $25k, 82.5% for AGIs $25k-50k, 75.7% for AGIs $50k-75k, 78.0% for AGIs $75k-100k, 45.4% for AGIs $100k-200k)
Taxable interest for individuals: $647 (reported on 30.0% of returns)
This zip code:
$647
Georgia:
$1,706
(% of AGI for various income ranges: 0.9% for AGIs below $25k, 0.5% for AGIs $25k-50k, 0.4% for AGIs $50k-75k, 0.9% for AGIs $75k-100k)
Ordinary dividends: $1,000 (reported on 4.0% of returns)
Here:
$1,000
State:
$7,265
Net capital gain/loss in AGI: +$2,350 (reported on 4.0% of returns)
Here:
+$2,350
State:
+$16,323
Profit/loss from business: +$4,857 (reported on 14.0% of returns)
Here:
+$4,857
State:
+$7,583
Taxable individual retirement arrangement distribution: $9,167 (reported on 6.0% of returns)
31012:
$9,167
Georgia:
$17,199
Total itemized deductions: $18,664 (22% of AGI, reported on 22.0% of returns)
Here:
$18,664
State:
$23,886
Here:
22.2% of AGI
State:
21.5% of AGI
(% of AGI for various income ranges: 11.1% for AGIs $25k-50k, 12.8% for AGIs $50k-75k, 11.6% for AGIs $75k-100k, 12.9% for AGIs $100k-200k)
Charity contributions: $6,400 (reported on 18.0% of returns)
Here:
$6,400
State:
$5,507
(% of AGI for various income ranges: 2.0% for AGIs $25k-50k, 5.7% for AGIs $50k-75k, 5.0% for AGIs $100k-200k)
Taxes paid: $5,145 (reported on 22.0% of returns)
31012:
$5,145
State:
$7,838
(% of AGI for various income ranges: 2.0% for AGIs $25k-50k, 3.5% for AGIs $50k-75k, 3.6% for AGIs $75k-100k, 4.3% for AGIs $100k-200k)
Earned income credit: $2,679 (reported on 28.0% of returns)
Here:
$2,679
State:
$2,589
(% of AGI for various income ranges: 10.3% for AGIs below $25k, 1.1% for AGIs $25k-50k)
Percentage of individuals using paid preparers for their 2012 taxes: 66.0%
Here:
66%
State:
55%
(% for various income ranges: 60.9% for AGIs below $25k, 61.5% for AGIs $25k-50k, 71.4% for AGIs $50k-75k, 75.0% for AGIs $75k-100k, 100.0% for AGIs $100k-200k)
Averages for the 2004 tax year for zip code 31012, filed in 2005:
Average Adjusted Gross Income (AGI) in 2004: $31,313 (Individual Income Tax Returns)
Here:
$31,313
State:
$47,553
Salary/wage: $29,586 (reported on 84.3% of returns)
Here:
$29,586
State:
$42,178
(% of AGI for various income ranges: 91.6% for AGIs below $10k, 80.1% for AGIs $10k-25k, 84.4% for AGIs $25k-50k, 81.5% for AGIs $50k-75k, 88.2% for AGIs $75k-100k, 54.4% for AGIs over 100k)
Taxable interest for individuals: $1,514 (reported on 33.5% of returns)
This zip code:
$1,514
Georgia:
$1,772
(% of AGI for various income ranges: 3.1% for AGIs below $10k, 0.8% for AGIs $10k-25k, 0.7% for AGIs $25k-50k, 1.9% for AGIs $50k-75k, 0.3% for AGIs $75k-100k, 4.8% for AGIs over 100k)
Taxable dividends: $1,918 (reported on 8.9% of returns)
Here:
$1,918
State:
$4,283
Net capital gain/loss: +$10,081 (reported on 6.7% of returns)
Here:
+$10,081
State:
+$16,461
Profit/loss from business: +$3,942 (reported on 15.6% of returns)
Here:
+$3,942
State:
+$8,201
(% of AGI for various income ranges: 8.9% for AGIs below $10k, 5.2% for AGIs $10k-25k, 2.5% for AGIs $25k-50k, 0.0% for AGIs $50k-75k)
Total itemized deductions: $14,764 (24% of AGI, reported on 19.9% of returns)
Here:
$14,764
State:
$19,944
Here:
24.1% of AGI
State:
22.6% of AGI
(% of AGI for various income ranges: 3.5% for AGIs $10k-25k, 9.9% for AGIs $25k-50k, 10.4% for AGIs $50k-75k, 14.0% for AGIs $75k-100k, 13.0% for AGIs over 100k)
Charity contributions deductions: $4,279 (7% of AGI, reported on 18.8% of returns)
Here:
$4,279
State:
$4,354
Here:
7.0% of AGI
State:
4.7% of AGI
(% of AGI for various income ranges: 0.8% for AGIs $10k-25k, 2.2% for AGIs $25k-50k, 3.2% for AGIs $50k-75k, 3.8% for AGIs $75k-100k, 4.1% for AGIs over 100k)
Total tax: $3,394 (reported on 70.7% of returns)
31012:
$3,394
State:
$8,223
(% of AGI for various income ranges: 3.0% for AGIs below $10k, 3.4% for AGIs $10k-25k, 6.6% for AGIs $25k-50k, 8.2% for AGIs $50k-75k, 10.1% for AGIs $75k-100k, 14.0% for AGIs over 100k)
Earned income credit: $1,776 (reported on 28.2% of returns)
Here:
$1,776
State:
$1,986
Percentage of individuals using paid preparers for their 2004 taxes: 71.6%
Here:
72%
State:
62%
(% for various income ranges: 72.5% for AGIs below $10k, 70.7% for AGIs $10k-25k, 70.5% for AGIs $25k-50k, 73.7% for AGIs $50k-75k, 73.9% for AGIs $75k-100k, 72.2% for AGIs over 100k)
Household received Food Stamps/SNAP in the past 12 months: 74 Household did not receive Food Stamps/SNAP in the past 12 months: 307
Women who had a birth in the past 12 months: 16 (9 now married, 7 unmarried) Women who did not have a birth in the past 12 months: 143 (60 now married, 83 unmarried)
Housing units in zip code 31012 with a mortgage: 68 (2 second mortgage, 2 both second mortgage and home equity loan) Houses without a mortgage: 3
Median monthly owner costs for units with a mortgage: $1,055 Median monthly owner costs for units without a mortgage: $372
Residents with income below the poverty level in 2022:
This zip code:
29.8%
Whole state:
12.7%
Residents with income below 50% of the poverty level in 2022:
This zip code:
12.9%
Whole state:
6.3%
Median number of rooms in houses and condos:
Here:
6.3
State:
6.8
Median number of rooms in apartments:
Here:
5.9
State:
4.6
Notable locations in this zip code not listed on our city pages
Notable locations in zip code 31012: Chester Volunteer Fire Department (A), Dodge State Prison Fire Department (B), Dodge Correctional Institution (C). Display/hide their locations on the map
Churches in zip code 31012 include: Christian Hope Church (A), Chester Baptist Church (B), Little Bethel Church (C), Middle Grounds Church (D), Pine Level Church (E), Rowland Chapel (F), Salem Baptist Church (G), Trail Branch Church (H), Welcome Friend Church (I). Display/hide their locations on the map
In group quarters: 1,209 (-1 institutionalized population)
Size of family households: 140 2-persons, 36 3-persons, 31 4-persons, 32 5-persons, 7 6-persons, 4 7-or-more-persons
Size of nonfamily households: 104 1-person, 18 2-persons, 4 3-persons
44 married couples with children.
120 single-parent households (23 men, 97 women).
94.6% of residents of 31012 zip code speak English at home.
4.1% of residents speak Spanish at home (29% very well, 29% well, 21% not well, 22% not at all).
0.3% of residents speak other Indo-European language at home (100% very well).
0.1% of residents speak other language at home (100% not at all).
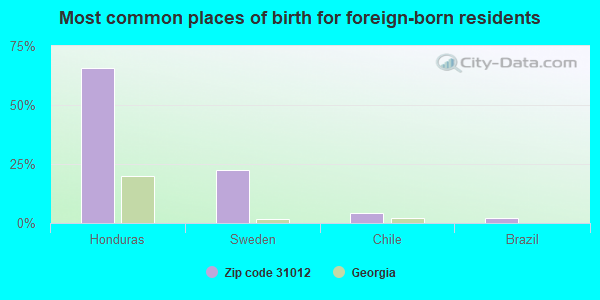
Foreign born population: 91 (4.1%) (23.9% of them are naturalized citizens)
This zip code:
4.1%
Whole state:
10.7%
66%Honduras
23%Sweden
4%Chile
2%Brazil
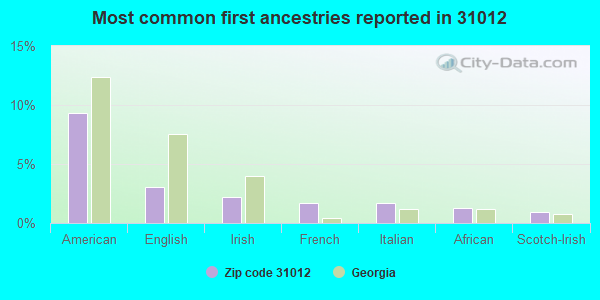
9%American
3%English
2%Irish
2%French
2%Italian
1%African
1%Scotch-Irish
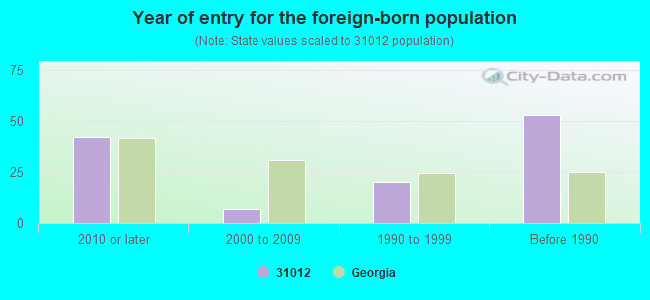
Year of entry for the foreign-born population
422010 or later
72000 to 2009
201990 to 1999
53Before 1990
Facilities with environmental interests located in this zip code:
WOOLFOLK CHEM WRKS DUBLIN WHSE (RAILROAD AVE in DUBLIN, GA)
National Pollutant Discharge Elimination System NON-MAJOR (Tracking pollutant discharge elimination systems) - permit Business SIC classification: SEWERAGE SYSTEMS Organizations: TOWN OF CHESTER (CONTACT/OWNER)
Alternative names: CHESTER, CITY OF, CHESTER, TOWN OF
Housing units lacking complete plumbing facilities: 7.3% Housing units lacking complete kitchen facilities: 6.2%
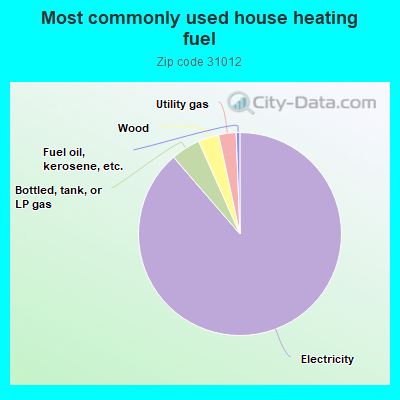
89.1%Electricity
4.7%Bottled, tank, or LP gas
3.3%Wood
2.8%Utility gas
0.6%Fuel oil, kerosene, etc.
Population in 1990: 1,517. Population change in the 1990s: +729 (+48.1%).
Place of birth for U.S.-born residents:
This state: 1,579
Northeast: 63
Midwest: 185
South: 271
West: 10
57% of the 31012 zip code residents lived in the same house 5 years ago. Out of people who lived in different houses, 28% lived in this county. Out of people who lived in different counties, 50% lived in Georgia.
76% of the 31012 zip code residents lived in the same house 1 year ago. Out of people who lived in different houses, 4% moved from this county. Out of people who lived in different houses, 87% moved from different county within same state. Out of people who lived in different houses, 4% moved from different state. Out of people who lived in different houses, 3% moved from abroad.
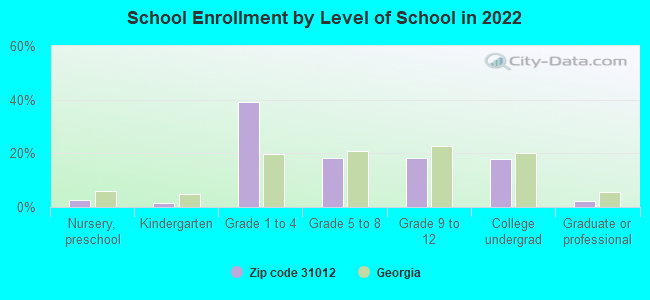
Private vs. public school enrollment:
Students in private schools in grades 1 to 8 (elementary and middle school): 31
Here:
23.5%
Georgia:
12.1%
Students in private schools in grades 9 to 12 (high school): 3
Here:
9.6%
Georgia:
10.8%
Students in private undergraduate colleges: 12
Here:
31.2%
Georgia:
17.1%
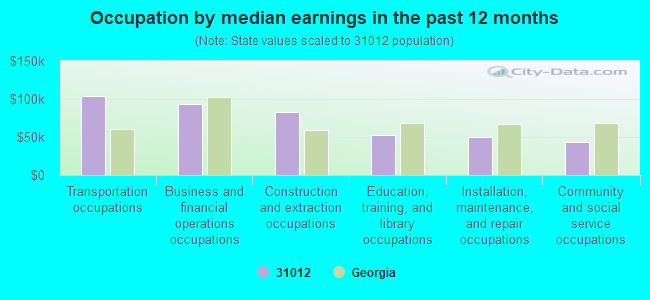
Occupation by median earnings in the past 12 months ($)
104,351Transportation occupations
92,767Business and financial operations occupations
83,085Construction and extraction occupations
52,524Education, training, and library occupations
50,014Installation, maintenance, and repair occupations
43,660Community and social service occupations
Top industries in this zip code by the number of employees in 2005:
Other Services (except Public Administration): Religious Organizations (1-4 employees: 2 establishments)
Construction: Poured Concrete Foundation and Structure Contractors (1-4: 1)
Mining: Support Activities for Nonmetallic Minerals (except Fuels) (1-4: 1)
People in group quarters in 2010:
1,232 people in state prisons
People in group quarters in 2000:
1,005 people in state prisons
Fatal accident statistics in 2013:
Fatal accident count: 1
Vehicles involved in fatal accidents: 2
Fatal accidents caused by drunken drivers: 0
Fatalities: 1
Persons involved in fatal accidents: 2
Pedestrians involved in fatal accidents: 0
Fatal accident statistics in 2012:
Fatal accident count: 1
Vehicles involved in fatal accidents: 2
Fatal accidents caused by drunken drivers: 0
Fatalities: 1
Persons involved in fatal accidents: 3
Pedestrians involved in fatal accidents: 0
2002 - 2018 National Fire Incident Reporting System (NFIRS) incidents
According to the data from the years 2002 - 2018 the average number of fires per year is 8. The highest number of fire incidents - 21 took place in 2009, and the least - 0 in 2006. The data has a growing trend.
When looking into fire subcategories, the most incidents belonged to: Outside Fires (61.5%), and Structure Fires (29.4%).
Fire incident types reported to NFIRS in Zip Code 31012
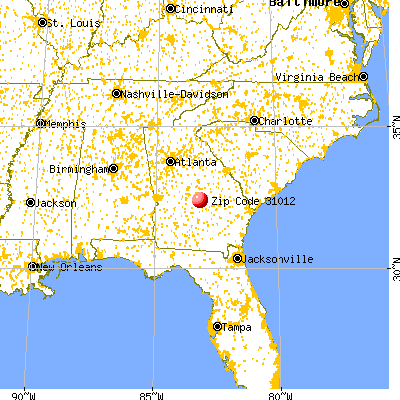


 Nearest zip codes: 31019, 31022, 31065, 31014, 31009, 31023.
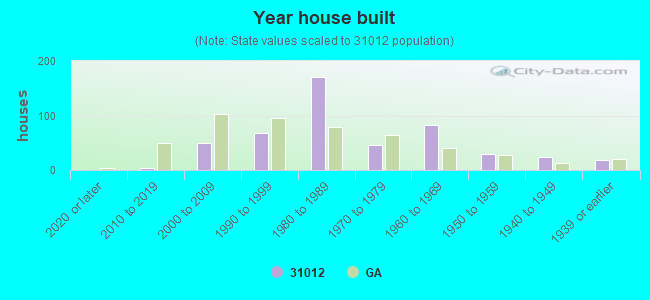


 According to the data from the years 2002 - 2018 the average number of fires per year is 8. The highest number of fire incidents - 21 took place in 2009, and the least - 0 in 2006. The data has a growing trend.
 When looking into fire subcategories, the most incidents belonged to: Outside Fires (61.5%), and Structure Fires (29.4%).