Estimated zip code population in 2022: 9,120 Zip code population in 2010: 8,652 Zip code population in 2000: 6,872
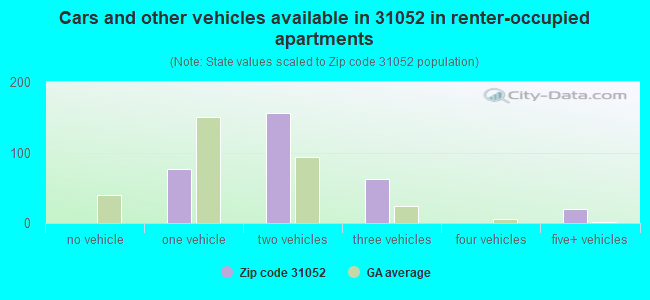
Houses and condos: 3,406 Renter-occupied apartments: 309
% of renters here:
10%
State:
34%
March 2022 cost of living index in zip code 31052: 81.0 (low, U.S. average is 100)
Land area: 70.3 sq. mi. Water area: 0.8 sq. mi.
Population density: 130 people per square mile
(very low).
OSM Map
General Map
Google Map
MSN Map
OSM Map
General Map
Google Map
MSN Map
OSM Map
General Map
Google Map
MSN Map
OSM Map
General Map
Google Map
MSN Map
Please wait while loading the map...
Real estate property taxes paid for housing units in 2022:
This zip code:
1.0% ($2,317)
Georgia:
0.7% ($2,160)
Median real estate property taxes paid for housing units with mortgages in 2022: $2,531 (1.0%) Median real estate property taxes paid for housing units with no mortgage in 2022: $1,952 (1.0%)
Business Search- 14 Million verified businesses
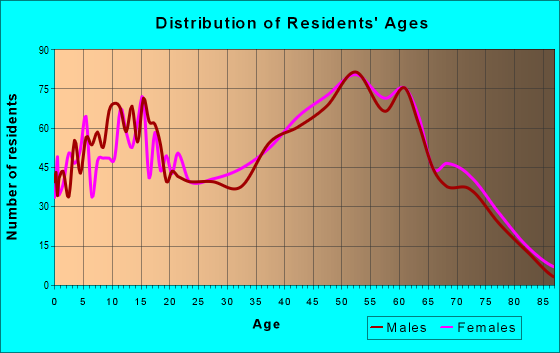
Males: 4,472
(49.0%)
Females: 4,647
(51.0%)
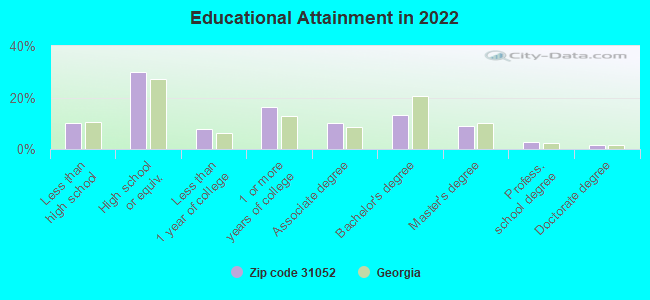
For population 25 years and over in 31052:
High school or higher: 89.7%
Bachelor's degree or higher: 26.0%
Graduate or professional degree: 13.0%
Unemployed: 2.1%
Mean travel time to work (commute): 28.5 minutes
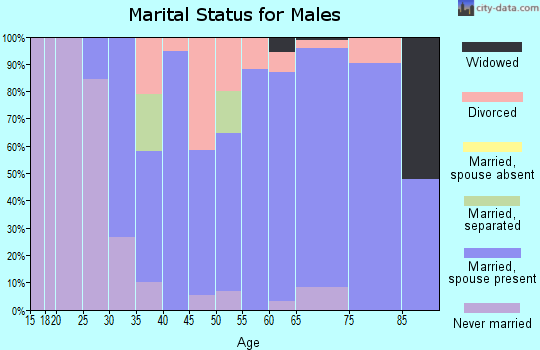
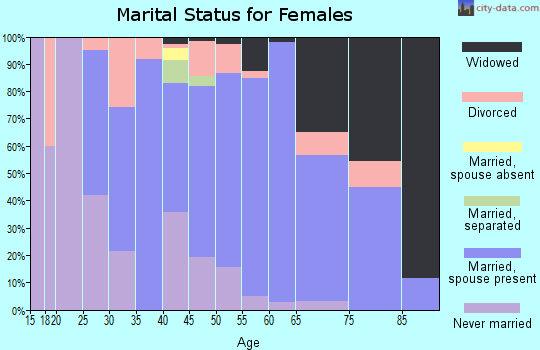
For population 15 years and over in 31052:
Never married: 25.0%
Now married: 59.6%
Separated: 1.7%
Widowed: 5.8%
Divorced: 8.0%
Zip code 31052 compared to state average:
Unemployed percentage below state average.
Hispanic race population percentage significantly below state average.
Median age above state average.
Foreign-born population percentage significantly below state average.
Renting percentage significantly below state average.
Length of stay since moving in significantly above state average.
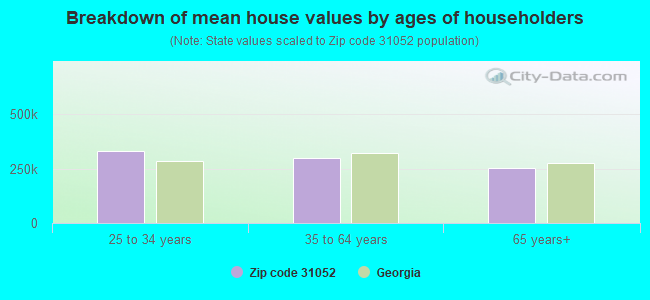
Estimated median house/condo value in 2022: $235,598
31052:
$235,598
Georgia:
$297,400
According to our research of Georgia and other state lists, there were 21 registered sex offenders living in 31052 zip code as of April 27, 2024. The ratio of all residents to sex offenders in zip code 31052 is 408 to 1. The ratio of registered sex offenders to all residents in this zip code is near the state average.
Median resident age:
This zip code:
45.2 years
Georgia median age:
37.6 years
Average household size:
This zip code:
2.8 people
Georgia:
2.6 people
Averages for the 2020 tax year for zip code 31052, filed in 2021:
Average Adjusted Gross Income (AGI) in 2020: $63,225 (Individual Income Tax Returns)
Here:
$63,225
State:
$70,847
Salary/wage: $51,370 (reported on 78.1% of returns)
Here:
$51,370
State:
$59,126
(% of AGI for various income ranges: 1151.5% for AGIs below $25k, 3410.6% for AGIs $25k-50k, 6466.7% for AGIs $50k-75k, 9205.9% for AGIs $75k-100k, 17979.7% for AGIs $100k-200k, 95195.0% for AGIs over 200k)
Taxable interest for individuals: $1,084 (reported on 31.0% of returns)
This zip code:
$1,084
Georgia:
$2,011
(% of AGI for various income ranges: 11.8% for AGIs below $25k, 17.4% for AGIs $25k-50k, 39.6% for AGIs $50k-75k, 95.2% for AGIs $75k-100k, 109.0% for AGIs $100k-200k, 1815.0% for AGIs over 200k)
Ordinary dividends: $4,115 (reported on 12.9% of returns)
Here:
$4,115
State:
$8,996
(% of AGI for various income ranges: 8.8% for AGIs below $25k, 20.4% for AGIs $25k-50k, 52.7% for AGIs $50k-75k, 75.2% for AGIs $75k-100k, 190.3% for AGIs $100k-200k, 4695.0% for AGIs over 200k)
Net capital gain/loss in AGI: +$17,196 (reported on 10.7% of returns)
Here:
+$17,196
State:
+$28,402
(% of AGI for various income ranges: 6.5% for AGIs below $25k, 4.7% for AGIs $25k-50k, 49.6% for AGIs $50k-75k, 149.0% for AGIs $75k-100k, 459.7% for AGIs $100k-200k, 27990.0% for AGIs over 200k)
Profit/loss from business: +$2,956 (reported on 19.0% of returns)
Here:
+$2,956
State:
+$6,707
(% of AGI for various income ranges: 45.2% for AGIs below $25k, 70.0% for AGIs $75k-100k, 465.7% for AGIs $100k-200k, 6250.0% for AGIs over 200k)
Taxable individual retirement arrangement distribution: $16,779 (reported on 9.3% of returns)
31052:
$16,779
Georgia:
$20,525
(% of AGI for various income ranges: 39.8% for AGIs below $25k, 115.1% for AGIs $25k-50k, 229.3% for AGIs $50k-75k, 374.8% for AGIs $75k-100k, 1025.0% for AGIs $100k-200k)
Total itemized deductions: $30,290 (reported on 11.7% of returns)
Here:
$30,290
State:
$34,001
(% of AGI for various income ranges: 37.0% for AGIs below $25k, 245.2% for AGIs $25k-50k, 634.9% for AGIs $50k-75k, 871.4% for AGIs $75k-100k, 1590.3% for AGIs $100k-200k, 11565.0% for AGIs over 200k)
Charity contributions: $12,858 (reported on 10.7% of returns)
Here:
$12,858
State:
$14,164
(% of AGI for various income ranges: 82.0% for AGIs $25k-50k, 192.2% for AGIs $50k-75k, 345.9% for AGIs $75k-100k, 666.0% for AGIs $100k-200k, 6280.0% for AGIs over 200k)
Taxes paid: $6,778 (reported on 11.7% of returns)
31052:
$6,778
State:
$7,540
(% of AGI for various income ranges: 7.6% for AGIs below $25k, 41.5% for AGIs $25k-50k, 132.0% for AGIs $50k-75k, 196.9% for AGIs $75k-100k, 417.7% for AGIs $100k-200k, 2435.0% for AGIs over 200k)
Earned income credit: $2,299 (reported on 17.1% of returns)
Here:
$2,299
State:
$2,530
(% of AGI for various income ranges: 100.9% for AGIs below $25k, 73.6% for AGIs $25k-50k)
Percentage of individuals using paid preparers for their 2020 taxes: 92.4%
Here:
92%
State:
93%
(% for various income ranges: 92.7% for AGIs below $25k, 93.2% for AGIs $25k-50k, 90.9% for AGIs $50k-75k, 93.3% for AGIs $75k-100k, 91.4% for AGIs $100k-200k, 90.9% for AGIs over 200k)
Averages for the 2012 tax year for zip code 31052, filed in 2013:
Average Adjusted Gross Income (AGI) in 2012: $54,438 (Individual Income Tax Returns)
Here:
$54,438
State:
$56,131
Salary/wage: $45,491 (reported on 81.2% of returns)
Here:
$45,491
State:
$47,942
(% of AGI for various income ranges: 71.6% for AGIs below $25k, 75.4% for AGIs $25k-50k, 72.0% for AGIs $50k-75k, 73.1% for AGIs $75k-100k, 74.0% for AGIs $100k-200k, 38.4% for AGIs over 200k)
Taxable interest for individuals: $925 (reported on 33.4% of returns)
This zip code:
$925
Georgia:
$1,706
(% of AGI for various income ranges: 1.2% for AGIs below $25k, 0.7% for AGIs $25k-50k, 0.5% for AGIs $50k-75k, 0.3% for AGIs $75k-100k, 0.5% for AGIs $100k-200k, 0.6% for AGIs over 200k)
Ordinary dividends: $2,423 (reported on 14.1% of returns)
Here:
$2,423
State:
$7,265
(% of AGI for various income ranges: 0.6% for AGIs below $25k, 0.5% for AGIs $25k-50k, 0.7% for AGIs $50k-75k, 0.4% for AGIs $75k-100k, 0.7% for AGIs $100k-200k, 0.8% for AGIs over 200k)
Net capital gain/loss in AGI: +$3,865 (reported on 10.1% of returns)
Here:
+$3,865
State:
+$16,323
(% of AGI for various income ranges: 0.2% for AGIs $50k-75k, 0.5% for AGIs $100k-200k, 3.6% for AGIs over 200k)
Profit/loss from business: +$7,627 (reported on 18.6% of returns)
Here:
+$7,627
State:
+$7,583
(% of AGI for various income ranges: 8.2% for AGIs below $25k, 1.4% for AGIs $25k-50k, 1.0% for AGIs $50k-75k, 0.1% for AGIs $75k-100k, 0.9% for AGIs $100k-200k, 7.9% for AGIs over 200k)
Taxable individual retirement arrangement distribution: $14,456 (reported on 10.3% of returns)
31052:
$14,456
Georgia:
$17,199
(% of AGI for various income ranges: 2.9% for AGIs below $25k, 2.3% for AGIs $25k-50k, 2.4% for AGIs $50k-75k, 2.5% for AGIs $75k-100k, 5.2% for AGIs $100k-200k)
Total itemized deductions: $21,439 (24% of AGI, reported on 40.2% of returns)
Here:
$21,439
State:
$23,886
Here:
23.6% of AGI
State:
21.5% of AGI
(% of AGI for various income ranges: 12.1% for AGIs below $25k, 14.9% for AGIs $25k-50k, 17.3% for AGIs $50k-75k, 18.2% for AGIs $75k-100k, 17.8% for AGIs $100k-200k, 11.6% for AGIs over 200k)
Charity contributions: $5,683 (reported on 35.9% of returns)
Here:
$5,683
State:
$5,507
(% of AGI for various income ranges: 1.7% for AGIs below $25k, 2.8% for AGIs $25k-50k, 3.8% for AGIs $50k-75k, 4.4% for AGIs $75k-100k, 4.4% for AGIs $100k-200k, 4.0% for AGIs over 200k)
Taxes paid: $6,576 (reported on 40.2% of returns)
31052:
$6,576
State:
$7,838
(% of AGI for various income ranges: 2.6% for AGIs below $25k, 3.3% for AGIs $25k-50k, 4.6% for AGIs $50k-75k, 5.4% for AGIs $75k-100k, 6.5% for AGIs $100k-200k, 4.8% for AGIs over 200k)
Earned income credit: $2,446 (reported on 21.4% of returns)
Here:
$2,446
State:
$2,589
(% of AGI for various income ranges: 8.8% for AGIs below $25k, 1.2% for AGIs $25k-50k)
Percentage of individuals using paid preparers for their 2012 taxes: 53.3%
Here:
53%
State:
55%
(% for various income ranges: 50.0% for AGIs below $25k, 51.0% for AGIs $25k-50k, 57.4% for AGIs $50k-75k, 55.8% for AGIs $75k-100k, 58.5% for AGIs $100k-200k, 71.4% for AGIs over 200k)
Averages for the 2004 tax year for zip code 31052, filed in 2005:
Average Adjusted Gross Income (AGI) in 2004: $45,475 (Individual Income Tax Returns)
Here:
$45,475
State:
$47,553
Salary/wage: $42,441 (reported on 84.1% of returns)
Here:
$42,441
State:
$42,178
(% of AGI for various income ranges: 148.9% for AGIs below $10k, 73.8% for AGIs $10k-25k, 77.9% for AGIs $25k-50k, 79.4% for AGIs $50k-75k, 85.2% for AGIs $75k-100k, 72.8% for AGIs over 100k)
Taxable interest for individuals: $1,118 (reported on 40.0% of returns)
This zip code:
$1,118
Georgia:
$1,772
(% of AGI for various income ranges: 5.6% for AGIs below $10k, 1.9% for AGIs $10k-25k, 1.1% for AGIs $25k-50k, 1.0% for AGIs $50k-75k, 0.4% for AGIs $75k-100k, 0.8% for AGIs over 100k)
Taxable dividends: $1,392 (reported on 18.4% of returns)
Here:
$1,392
State:
$4,283
(% of AGI for various income ranges: 1.2% for AGIs below $10k, 0.6% for AGIs $10k-25k, 0.5% for AGIs $25k-50k, 0.3% for AGIs $50k-75k, 0.4% for AGIs $75k-100k, 0.8% for AGIs over 100k)
Net capital gain/loss: +$6,149 (reported on 13.3% of returns)
Here:
+$6,149
State:
+$16,461
(% of AGI for various income ranges: -0.6% for AGIs below $10k, 0.2% for AGIs $10k-25k, 0.2% for AGIs $25k-50k, 0.6% for AGIs $50k-75k, 0.8% for AGIs $75k-100k, 4.9% for AGIs over 100k)
Profit/loss from business: +$8,216 (reported on 18.0% of returns)
Here:
+$8,216
State:
+$8,201
(% of AGI for various income ranges: 4.5% for AGIs below $10k, 6.4% for AGIs $10k-25k, 2.2% for AGIs $25k-50k, 2.5% for AGIs $50k-75k, 1.0% for AGIs $75k-100k, 5.0% for AGIs over 100k)
IRA payment deduction: $2,929 (reported on 2.6% of returns)
31052:
$2,929
Georgia:
$2,969
(% of AGI for various income ranges: 0.3% for AGIs $25k-50k, 0.2% for AGIs $50k-75k, 0.2% for AGIs $75k-100k, 0.1% for AGIs over 100k)
Total itemized deductions: $17,613 (24% of AGI, reported on 42.9% of returns)
Here:
$17,613
State:
$19,944
Here:
23.6% of AGI
State:
22.6% of AGI
(% of AGI for various income ranges: 16.5% for AGIs below $10k, 12.2% for AGIs $10k-25k, 16.9% for AGIs $25k-50k, 19.1% for AGIs $50k-75k, 17.7% for AGIs $75k-100k, 15.3% for AGIs over 100k)
Charity contributions deductions: $4,239 (6% of AGI, reported on 39.4% of returns)
Here:
$4,239
State:
$4,354
Here:
5.6% of AGI
State:
4.7% of AGI
(% of AGI for various income ranges: 1.2% for AGIs below $10k, 2.1% for AGIs $10k-25k, 3.3% for AGIs $25k-50k, 4.3% for AGIs $50k-75k, 4.1% for AGIs $75k-100k, 3.8% for AGIs over 100k)
Total tax: $6,162 (reported on 76.5% of returns)
31052:
$6,162
State:
$8,223
(% of AGI for various income ranges: 3.8% for AGIs below $10k, 3.9% for AGIs $10k-25k, 6.1% for AGIs $25k-50k, 8.3% for AGIs $50k-75k, 9.7% for AGIs $75k-100k, 17.1% for AGIs over 100k)
Earned income credit: $1,919 (reported on 16.0% of returns)
Here:
$1,919
State:
$1,986
Percentage of individuals using paid preparers for their 2004 taxes: 58.9%
Here:
59%
State:
62%
(% for various income ranges: 49.1% for AGIs below $10k, 61.8% for AGIs $10k-25k, 59.2% for AGIs $25k-50k, 63.4% for AGIs $50k-75k, 58.4% for AGIs $75k-100k, 62.5% for AGIs over 100k)
Household received Food Stamps/SNAP in the past 12 months: 429 Household did not receive Food Stamps/SNAP in the past 12 months: 2,798
Women who had a birth in the past 12 months: 87 (88 now married, 0 unmarried) Women who did not have a birth in the past 12 months: 1,816 (1,001 now married, 812 unmarried)
Housing units in zip code 31052 with a mortgage: 1,677 (99 second mortgage, 17 home equity loan, 37 both second mortgage and home equity loan) Houses without a mortgage: 72
Median monthly owner costs for units with a mortgage: $1,471 Median monthly owner costs for units without a mortgage: $586
Residents with income below the poverty level in 2022:
This zip code:
7.9%
Whole state:
12.7%
Residents with income below 50% of the poverty level in 2022:
This zip code:
4.7%
Whole state:
6.3%
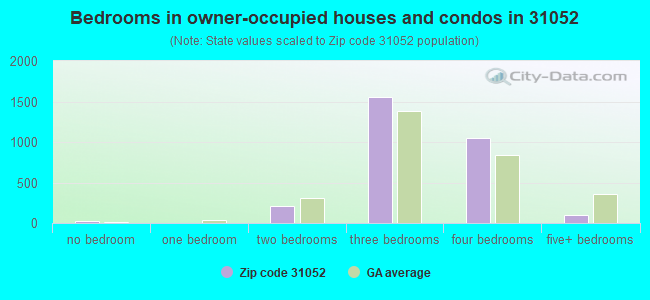
Median number of rooms in houses and condos:
Here:
6.8
State:
6.8
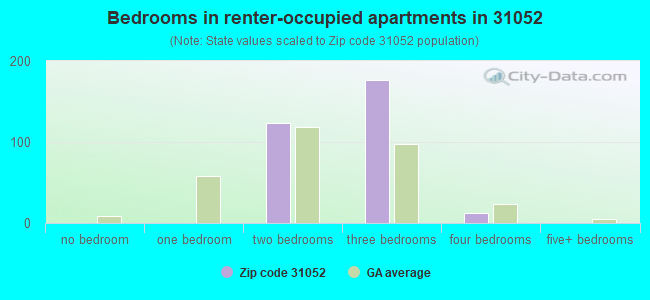
Median number of rooms in apartments:
Here:
4.7
State:
4.6
Notable locations in this zip code not listed on our city pages
Notable locations in zip code 31052: Camp Martha Johnston (A), Southeastern Holiness Camp (B), Crawford County Fire Department Station 8 (C), Crawford County Fire Department Station 3 (D), Macon - Bibb County Fire Department Station 105 (E), Macon - Bibb County Fire Department Station 104 (F). Display/hide their locations on the map
Churches in zip code 31052 include: Bethel Church (A), Lizella Church (B), Faith Temple (C), Damascus Church (D), Midway Church (E), Mount Paran Church (F), Open Bible Tabernacle (G), Pleasant Grove Church (H), Friendship Chapel (I). Display/hide their locations on the map
Cemeteries: Bethany Cemetery (1), Cloud Cemetery (2), Dixon Cemetery (3), Fellowship Cemetery (4), Spring Hill Cemetery (5), Waldron Cemetery (6). Display/hide their locations on the map
Reservoirs: Dougherty Lake (A), Tobesofkee Creek Structure Number One L (B), Herds Pond (C), Newberry Lake (D), Merritt Lake (E), Stackler Lake (F), Rowell Lake (G). Display/hide their locations on the map
Streams, rivers, and creeks: Sweetwater Creek (A), Hammock Branch (B), Gum Branch (C), Deep Creek (D), Morris Branch (E), Lamar Branch (F). Display/hide their locations on the map
Tourist attractions (not listed on the city page) : H & H Moonwalk & Carousel Rentals (Water Parks & Slides; 210 Laurel Ln) (1), Lizella Recreation Club (Recreation Areas; 3308 Holley Road) (2). Display/hide their approximate locations on the map
In group quarters: 3 (-1 institutionalized population)
Size of family households: 1,418 2-persons, 456 3-persons, 262 4-persons, 212 5-persons, 83 6-persons, 90 7-or-more-persons
Size of nonfamily households: 517 1-person, 164 2-persons, 38 3-persons
1,219 married couples with children.
279 single-parent households (161 men, 118 women).
96.1% of residents of 31052 zip code speak English at home.
2.4% of residents speak Spanish at home (100% very well).
0.4% of residents speak other Indo-European language at home (79% very well, 21% well).
0.5% of residents speak Asian or Pacific Island language at home (67% very well, 33% well).
0.9% of residents speak other language at home (100% very well).
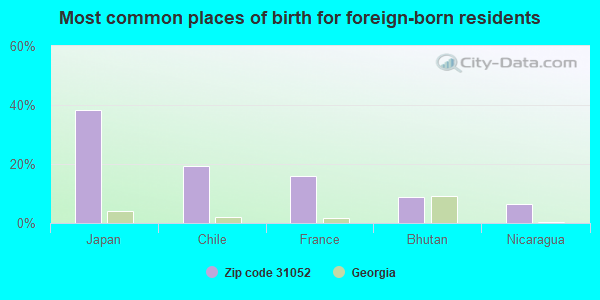
Foreign born population: 131 (1.4%) (100.0% of them are naturalized citizens)
This zip code:
1.4%
Whole state:
10.7%
38%Japan
19%Chile
16%France
9%Bhutan
6%Nicaragua
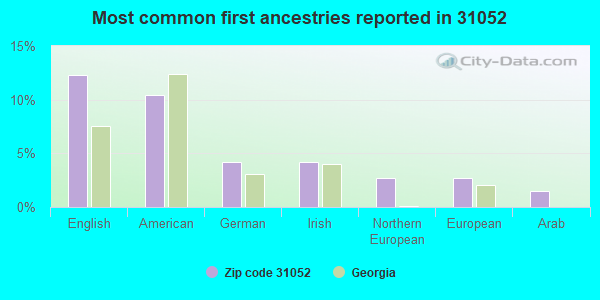
12%English
10%American
4%German
4%Irish
3%Northern European
3%European
1%Arab
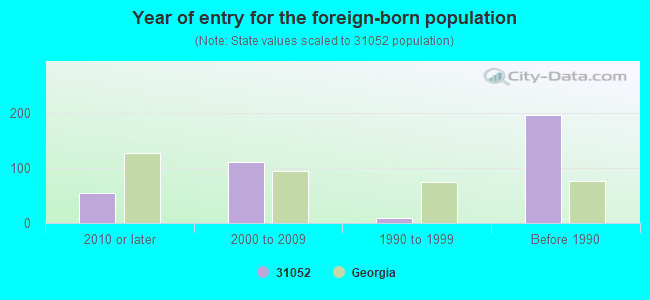
Year of entry for the foreign-born population
542010 or later
1112000 to 2009
101990 to 1999
197Before 1990
Facilities with environmental interests located in this zip code:
REDDING ELEMENTARY SCHOOL (8062 EISENHOWER PARKWAY in LIZELLA, GA)
(National Center for Education Statistics) - STATE ID-4067 Organizations: BIBB COUNTY (SCHOOL DISTRICT)
LAMAR EMC-FULTON HILL (5410 FULTON MILL RD. in LIZELLA, GA)
AIR SYNTHETIC MINOR (AIRS/AFS) Business SIC classification: ELECTRIC SERVICES Alternative names: LAMAR EMC FULTON HILL SUBSTATION
Housing units lacking complete plumbing facilities: 0.5% Housing units lacking complete kitchen facilities: 1.1%
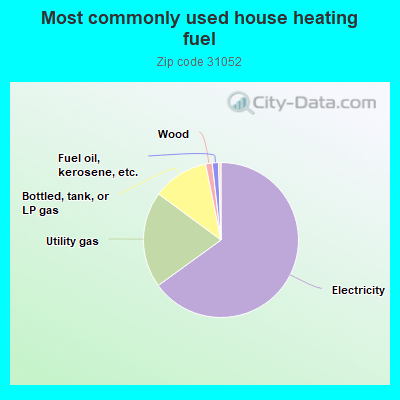
65.1%Electricity
20.1%Utility gas
11.7%Bottled, tank, or LP gas
1.4%Wood
1.3%Fuel oil, kerosene, etc.
0.5%No fuel used
Population in 1990: 6,992.
Place of birth for U.S.-born residents:
This state: 6,473
Northeast: 290
Midwest: 279
South: 1,440
West: 182
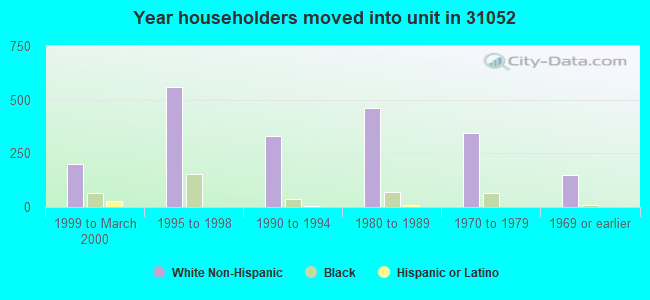
66% of the 31052 zip code residents lived in the same house 5 years ago. Out of people who lived in different houses, 55% lived in this county. Out of people who lived in different counties, 50% lived in Georgia.
94% of the 31052 zip code residents lived in the same house 1 year ago. Out of people who lived in different houses, 31% moved from this county. Out of people who lived in different houses, 25% moved from different county within same state. Out of people who lived in different houses, 52% moved from different state.
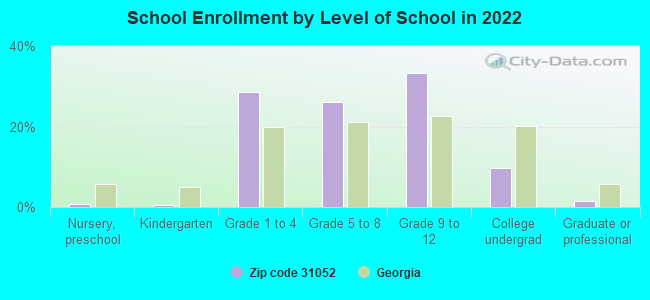
Private vs. public school enrollment:
Students in private schools in grades 1 to 8 (elementary and middle school): 256
Here:
24.4%
Georgia:
12.1%
Students in private schools in grades 9 to 12 (high school): 196
Here:
31.3%
Georgia:
10.8%
Students in private undergraduate colleges: 70
Here:
38.6%
Georgia:
17.1%
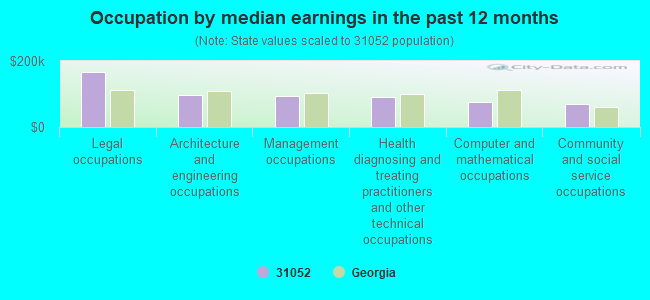
Occupation by median earnings in the past 12 months ($)
167,023Legal occupations
97,453Architecture and engineering occupations
94,306Management occupations
92,232Health diagnosing and treating practitioners and other technical occupations
76,514Computer and mathematical occupations
70,658Community and social service occupations
Companies with federal contracts located in this zip code:
THURMAN MCDOWELL (5381 ROGERS RD in LIZELLA, GA; small business) : $327,589 in 6 contractsfrom 2001 to 2006
Contracts for Other Professional Services, Program Management/Support Services, Maintenance, Repair and Rebuilding of Equipment -- Miscellaneous, Engineering and Technical Services by Air Force Signed by year:2000: $0; 2001: $59,786; 2002: $62,779; 2003: $65,911; 2004: $67,860; 2005: $0; 2006: $71,253.
Biggest contracts:
$71,253 with Air Force for Other Professional Services. Signed on 2006-01-23. Completion date: 2007-01-22.
$67,860 with Air Force for Program Management/Support Services. Signed on 2004-11-15. Completion date: 2005-11-14.
$65,911 with Air Force for Maintenance, Repair and Rebuilding of Equipment -- Miscellaneous. Signed on 2003-11-15. Completion date: 2004-11-14.
$62,779 with Air Force for Engineering and Technical Services. Signed on 2002-11-15. Completion date: 2003-11-14.
DIXON, DON (5397 MARSHALL MILL RD in LIZELLA, GA; small business) : $150,748 in 2 contractsfrom 2004 to 2005
$83,253 with Air Force for Other Management Support Services. Signed on 2005-07-05. Completion date: 2009-08-08.
$67,495, same as above.Signed on 2004-08-02. Completion date: 2009-08-08.
Top industries in this zip code by the number of employees in 2005:
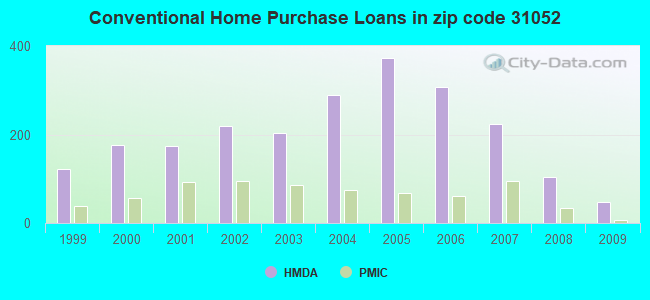
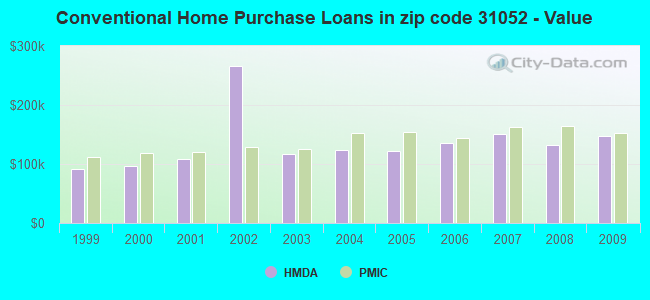
Detailed PMIC statistics for the following Tracts:0136.01
, 0136.02
2005 - 2018 National Fire Incident Reporting System (NFIRS) incidents
Based on the data from the years 2005 - 2018 the average number of fires per year is 25. The highest number of fire incidents - 58 took place in 2006, and the least - 3 in 2009. The data has a growing trend.
When looking into fire subcategories, the most incidents belonged to: Outside Fires (61.5%), and Structure Fires (23.0%).
Fire incident types reported to NFIRS in Zip Code 31052


 Nearest zip codes: 31220, 31050, 31008, 31206, 31210, 31216.
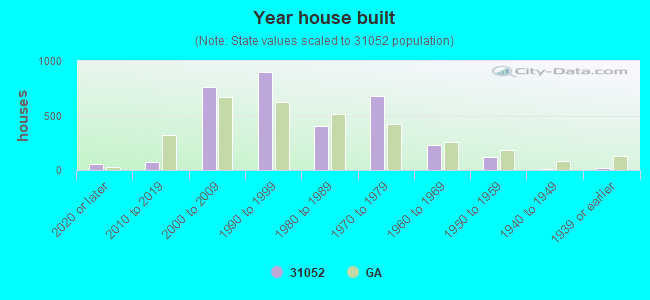


 Based on the data from the years 2005 - 2018 the average number of fires per year is 25. The highest number of fire incidents - 58 took place in 2006, and the least - 3 in 2009. The data has a growing trend.
 When looking into fire subcategories, the most incidents belonged to: Outside Fires (61.5%), and Structure Fires (23.0%).