Estimated zip code population in 2022: 2,044 Zip code population in 2010: 1,999 Zip code population in 2000: 2,034
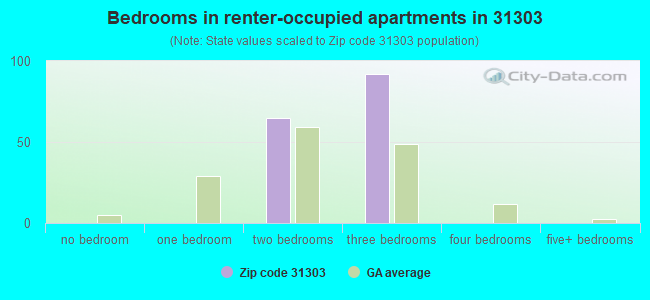
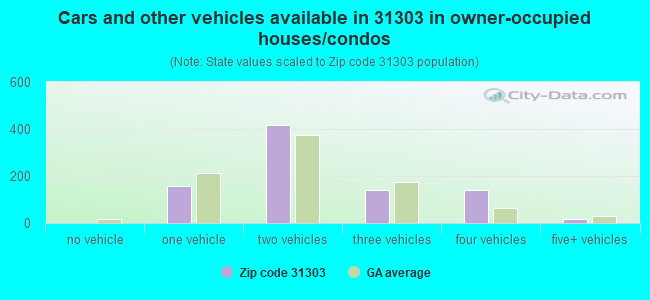
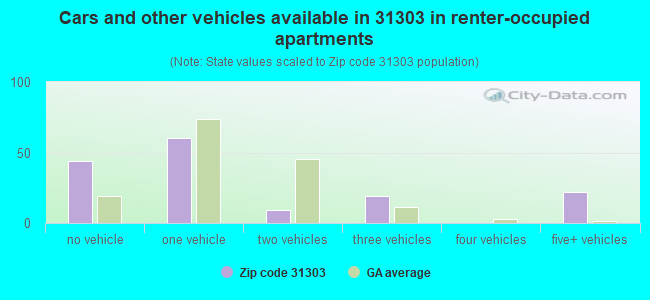
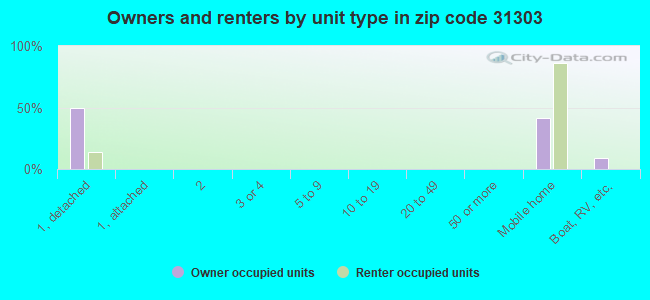
Houses and condos: 1,080 Renter-occupied apartments: 154
% of renters here:
15%
State:
34%
March 2022 cost of living index in zip code 31303: 81.8 (low, U.S. average is 100)
Land area: 81.4 sq. mi. Water area: 1.6 sq. mi.
Population density: 25 people per square mile
(very low).
OSM Map
General Map
Google Map
MSN Map
OSM Map
General Map
Google Map
MSN Map
OSM Map
General Map
Google Map
MSN Map
OSM Map
General Map
Google Map
MSN Map
Please wait while loading the map...
Real estate property taxes paid for housing units in 2022:
This zip code:
0.7% ($1,564)
Georgia:
0.7% ($2,160)
Median real estate property taxes paid for housing units with mortgages in 2022: $1,914 Median real estate property taxes paid for housing units with no mortgage in 2022: $1,331
Business Search- 14 Million verified businesses
Males: 1,089
(53.3%)
Females: 954
(46.7%)
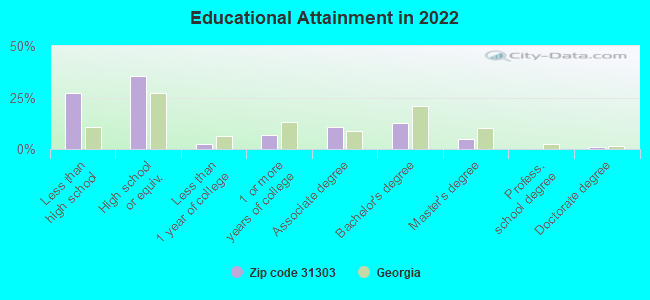
For population 25 years and over in 31303:
High school or higher: 70.2%
Bachelor's degree or higher: 17.3%
Graduate or professional degree: 5.3%
Mean travel time to work (commute): 46.4 minutes
For population 15 years and over in 31303:
Never married: 12.8%
Now married: 60.3%
Separated: 0.9%
Widowed: 8.2%
Divorced: 17.9%
Zip code 31303 compared to state average:
Median household income significantly below state average.
Unemployed percentage significantly below state average.
Black race population percentage below state average.
Hispanic race population percentage significantly below state average.
Median age significantly above state average.
Foreign-born population percentage significantly below state average.
Renting percentage below state average.
Length of stay since moving in significantly above state average.
House age below state average.
Number of college students significantly below state average.
Percentage of population with a bachelor's degree or higher below state average.
Averages for the 2020 tax year for zip code 31303, filed in 2021:
Average Adjusted Gross Income (AGI) in 2020: $57,458 (Individual Income Tax Returns)
Here:
$57,458
State:
$70,847
Salary/wage: $53,252 (reported on 84.3% of returns)
Here:
$53,252
State:
$59,126
(% of AGI for various income ranges: 1224.2% for AGIs below $25k, 3791.8% for AGIs $25k-50k, 6467.5% for AGIs $50k-75k, 11257.1% for AGIs $75k-100k, 18522.0% for AGIs $100k-200k)
Taxable interest for individuals: $1,011 (reported on 17.6% of returns)
This zip code:
$1,011
Georgia:
$2,011
(% of AGI for various income ranges: 3.1% for AGIs below $25k, 6.4% for AGIs $25k-50k, 5.0% for AGIs $50k-75k, 11.4% for AGIs $75k-100k, 156.0% for AGIs $100k-200k)
Ordinary dividends: $2,744 (reported on 8.3% of returns)
Here:
$2,744
State:
$8,996
(% of AGI for various income ranges: 18.8% for AGIs below $25k, 87.5% for AGIs $50k-75k, 93.0% for AGIs $100k-200k)
Net capital gain/loss in AGI: +$23,150 (reported on 9.3% of returns)
Here:
+$23,150
State:
+$28,402
(% of AGI for various income ranges: 0.8% for AGIs below $25k, 43.3% for AGIs $50k-75k, 2261.0% for AGIs $100k-200k)
Profit/loss from business: +$2,700 (reported on 16.7% of returns)
Here:
+$2,700
State:
+$6,707
(% of AGI for various income ranges: 165.8% for AGIs below $25k, 36.8% for AGIs $25k-50k, 39.0% for AGIs $100k-200k)
Taxable individual retirement arrangement distribution: $15,500 (reported on 4.6% of returns)
31303:
$15,500
Georgia:
$20,525
(% of AGI for various income ranges: 105.0% for AGIs $25k-50k, 777.1% for AGIs $75k-100k)
Total itemized deductions: $28,145 (reported on 10.2% of returns)
Here:
$28,145
State:
$34,001
(% of AGI for various income ranges: 1030.8% for AGIs $50k-75k, 1859.0% for AGIs $100k-200k)
Charity contributions: $10,600 (reported on 8.3% of returns)
Here:
$10,600
State:
$14,164
(% of AGI for various income ranges: 193.3% for AGIs $50k-75k, 722.0% for AGIs $100k-200k)
Taxes paid: $6,964 (reported on 10.2% of returns)
31303:
$6,964
State:
$7,540
(% of AGI for various income ranges: 216.7% for AGIs $50k-75k, 506.0% for AGIs $100k-200k)
Earned income credit: $2,495 (reported on 19.4% of returns)
Here:
$2,495
State:
$2,530
(% of AGI for various income ranges: 125.4% for AGIs below $25k, 90.0% for AGIs $25k-50k)
Percentage of individuals using paid preparers for their 2020 taxes: 95.4%
Here:
95%
State:
93%
(% for various income ranges: 94.3% for AGIs below $25k, 96.3% for AGIs $25k-50k, 93.8% for AGIs $50k-75k, 100.0% for AGIs $75k-100k, 94.1% for AGIs $100k-200k, 100.0% for AGIs over 200k)
Averages for the 2012 tax year for zip code 31303, filed in 2013:
Average Adjusted Gross Income (AGI) in 2012: $44,630 (Individual Income Tax Returns)
Here:
$44,630
State:
$56,131
Salary/wage: $41,408 (reported on 86.0% of returns)
Here:
$41,408
State:
$47,942
(% of AGI for various income ranges: 79.8% for AGIs below $25k, 81.2% for AGIs $25k-50k, 86.4% for AGIs $50k-75k, 85.9% for AGIs $75k-100k, 71.5% for AGIs $100k-200k)
Taxable interest for individuals: $664 (reported on 23.7% of returns)
This zip code:
$664
Georgia:
$1,706
(% of AGI for various income ranges: 0.3% for AGIs below $25k, 0.4% for AGIs $25k-50k, 0.4% for AGIs $50k-75k, 0.2% for AGIs $75k-100k, 0.4% for AGIs $100k-200k)
Ordinary dividends: $850 (reported on 8.6% of returns)
Here:
$850
State:
$7,265
Net capital gain/loss in AGI: +$8,929 (reported on 7.5% of returns)
Here:
+$8,929
State:
+$16,323
Profit/loss from business: +$5,314 (reported on 15.1% of returns)
Here:
+$5,314
State:
+$7,583
(% of AGI for various income ranges: 5.2% for AGIs below $25k, 3.0% for AGIs $25k-50k, 1.2% for AGIs $50k-75k, 2.0% for AGIs $75k-100k)
Taxable individual retirement arrangement distribution: $8,983 (reported on 6.5% of returns)
31303:
$8,983
Georgia:
$17,199
Total itemized deductions: $19,823 (26% of AGI, reported on 33.3% of returns)
Here:
$19,823
State:
$23,886
Here:
25.6% of AGI
State:
21.5% of AGI
(% of AGI for various income ranges: 7.7% for AGIs below $25k, 11.6% for AGIs $25k-50k, 15.5% for AGIs $50k-75k, 17.1% for AGIs $75k-100k, 17.5% for AGIs $100k-200k)
Charity contributions: $4,568 (reported on 26.9% of returns)
Here:
$4,568
State:
$5,507
(% of AGI for various income ranges: 2.9% for AGIs $25k-50k, 2.3% for AGIs $50k-75k, 3.2% for AGIs $75k-100k, 3.7% for AGIs $100k-200k)
Taxes paid: $5,948 (reported on 33.3% of returns)
31303:
$5,948
State:
$7,838
(% of AGI for various income ranges: 1.0% for AGIs below $25k, 2.7% for AGIs $25k-50k, 4.0% for AGIs $50k-75k, 5.7% for AGIs $75k-100k, 6.2% for AGIs $100k-200k)
Earned income credit: $2,396 (reported on 24.7% of returns)
Here:
$2,396
State:
$2,589
(% of AGI for various income ranges: 8.9% for AGIs below $25k, 1.3% for AGIs $25k-50k)
Percentage of individuals using paid preparers for their 2012 taxes: 54.8%
Here:
55%
State:
55%
(% for various income ranges: 52.5% for AGIs below $25k, 57.1% for AGIs $25k-50k, 58.3% for AGIs $50k-75k, 50.0% for AGIs $75k-100k, 60.0% for AGIs $100k-200k)
Averages for the 2004 tax year for zip code 31303, filed in 2005:
Average Adjusted Gross Income (AGI) in 2004: $35,634 (Individual Income Tax Returns)
Here:
$35,634
State:
$47,553
Salary/wage: $33,784 (reported on 88.8% of returns)
Here:
$33,784
State:
$42,178
(% of AGI for various income ranges: 151.2% for AGIs below $10k, 80.3% for AGIs $10k-25k, 92.2% for AGIs $25k-50k, 86.4% for AGIs $50k-75k, 86.9% for AGIs $75k-100k, 66.4% for AGIs over 100k)
Taxable interest for individuals: $1,276 (reported on 28.5% of returns)
This zip code:
$1,276
Georgia:
$1,772
(% of AGI for various income ranges: 6.5% for AGIs below $10k, 1.5% for AGIs $10k-25k, 0.3% for AGIs $25k-50k, 1.8% for AGIs $50k-75k, 0.4% for AGIs $75k-100k, 0.7% for AGIs over 100k)
Taxable dividends: $1,318 (reported on 10.0% of returns)
Here:
$1,318
State:
$4,283
(% of AGI for various income ranges: 2.6% for AGIs below $10k, 0.1% for AGIs $25k-50k, 0.8% for AGIs $50k-75k, 0.0% for AGIs $75k-100k, 0.6% for AGIs over 100k)
Net capital gain/loss: +$13,362 (reported on 9.1% of returns)
Here:
+$13,362
State:
+$16,461
(% of AGI for various income ranges: -1.7% for AGIs below $10k, 1.1% for AGIs $10k-25k, -0.0% for AGIs $25k-50k, 1.5% for AGIs $50k-75k, 14.3% for AGIs over 100k)
Profit/loss from business: +$4,254 (reported on 13.9% of returns)
Here:
+$4,254
State:
+$8,201
(% of AGI for various income ranges: 8.2% for AGIs below $10k, 5.7% for AGIs $10k-25k, 0.9% for AGIs $25k-50k, 0.8% for AGIs $50k-75k, 2.3% for AGIs $75k-100k)
IRA payment deduction: $2,364 (reported on 1.3% of returns)
31303:
$2,364
Georgia:
$2,969
Total itemized deductions: $16,859 (26% of AGI, reported on 33.2% of returns)
Here:
$16,859
State:
$19,944
Here:
26.4% of AGI
State:
22.6% of AGI
(% of AGI for various income ranges: 9.0% for AGIs $10k-25k, 15.7% for AGIs $25k-50k, 19.1% for AGIs $50k-75k, 19.7% for AGIs $75k-100k, 14.9% for AGIs over 100k)
Charity contributions deductions: $3,702 (6% of AGI, reported on 28.3% of returns)
Here:
$3,702
State:
$4,354
Here:
5.6% of AGI
State:
4.7% of AGI
(% of AGI for various income ranges: 1.4% for AGIs $10k-25k, 2.7% for AGIs $25k-50k, 3.8% for AGIs $50k-75k, 3.5% for AGIs $75k-100k, 3.2% for AGIs over 100k)
Total tax: $4,118 (reported on 67.0% of returns)
31303:
$4,118
State:
$8,223
(% of AGI for various income ranges: 3.4% for AGIs below $10k, 3.3% for AGIs $10k-25k, 5.2% for AGIs $25k-50k, 7.2% for AGIs $50k-75k, 8.9% for AGIs $75k-100k, 14.0% for AGIs over 100k)
Earned income credit: $1,891 (reported on 26.1% of returns)
Here:
$1,891
State:
$1,986
Percentage of individuals using paid preparers for their 2004 taxes: 66.0%
Here:
66%
State:
62%
(% for various income ranges: 55.9% for AGIs below $10k, 70.4% for AGIs $10k-25k, 67.3% for AGIs $25k-50k, 67.5% for AGIs $50k-75k, 66.0% for AGIs $75k-100k, 72.3% for AGIs over 100k)
Household received Food Stamps/SNAP in the past 12 months: 0 Household did not receive Food Stamps/SNAP in the past 12 months: 1,007
Women who had a birth in the past 12 months: 52 (53 now married, 0 unmarried) Women who did not have a birth in the past 12 months: 260 (89 now married, 171 unmarried)
Housing units in zip code 31303 with a mortgage: 484 (11 second mortgage, 12 both second mortgage and home equity loan) Median monthly owner costs for units with a mortgage: $1,084 Median monthly owner costs for units without a mortgage: $503
Residents with income below the poverty level in 2022:
This zip code:
4.9%
Whole state:
12.7%
Residents with income below 50% of the poverty level in 2022:
This zip code:
2.0%
Whole state:
6.3%
Median number of rooms in houses and condos:
Here:
6.5
State:
6.8
Median number of rooms in apartments:
Here:
5.6
State:
4.6
Notable locations in this zip code not listed on our city pages
Notable locations in zip code 31303: Sisters Ferry Landing (A), Tuckasee King Landing (B), Cedar Bluff Landing (C), Frying Pan Landing (D), Gaffneys Landing (E), Effingham Fire / Rescue Station 7 (F), Effingham Fire / Rescue Station 1 (G). Display/hide their locations on the map
Churches in zip code 31303 include: Bethel Church (A), Mount Pisgah Church (B), Mount Zion Church (C), Clyo Lutheran Parish Church (D), Laurel Hill Church (E), Mizpah Church (F), Mount Pleasant Church (G), New Zion Holiness Church (H), Taylor Church (I). Display/hide their locations on the map
Cemeteries: Cedar Grove Cemetery (1), Coursey Cemetery (2), Metzger Cemetery (3), Morgan Cemetery (4), Ryal Cemetery (5), Wheeler Cemetery (6), Pisgah Cemetery (7). Display/hide their locations on the map
Lakes, reservoirs, and swamps: Sand Pond (A), Old River (B), Kennedy Lake (C), Webster Lake (D), Haddon Lake (E), Gin Raw Lake (F), Finch Lake (G), Lakeside Farms Pond (H). Display/hide their locations on the map
Streams, rivers, and creeks: Turkey Branch (A), Strong Creek (B), Runs Branch (C), Devils Branch (D), Deep Branch (E), Cowpen Branch (F), Plank Creek (G), Nanny Branch (H). Display/hide their locations on the map
Size of family households: 539 2-persons, 58 3-persons, 64 4-persons, 4 5-persons
Size of nonfamily households: 322 1-person, 26 2-persons
213 married couples with children.
51 single-parent households (27 men, 24 women).
100.8% of residents of 31303 zip code speak English at home.
Foreign born population: 0 (0.0%)
:
0.0%
Whole state:
10.7%
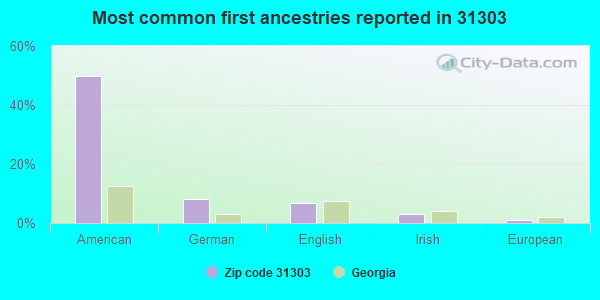
50%American
8%German
7%English
3%Irish
1%European
0%Austrian
0%Pennsylvania German
Facilities with environmental interests located in this zip code:
GOLD KIST FERTILIZER PLT (GA HWY 119 in CLYO, GA)
AIR MINOR (AIRS/AFS) (Resource Conservation and Recovery Act (tracking hazardous waste)) Business SIC classification: FERTILIZERS, MIXING ONLY Business NAICS classification: FERTILIZER (MIXING ONLY) MANUFACTURING. Organizations: OPERNAME (CONTACT/OPERATOR)
, OWNERNAME (CONTACT/OWNER)
Alternative names: GOLD KIST INC/FERTILIZER PLT
GEORGIA-PACIFIC CORP TIMBER DIV (SR 119 in CLYO, GA)
(Resource Conservation and Recovery Act (tracking hazardous waste)) Business NAICS classification: WOOD PRESERVATION. Organizations: OPERNAME (CONTACT/OPERATOR)
, OWNERNAME (CONTACT/OWNER)
J W EXLEY LUMBER CO (1427 REIDSVILLE RD in CLYO, GA)
AIR MINOR (AIRS/AFS) Business SIC classification: SAWMILLS AND PLANING MILLS, GENERAL
Housing units lacking complete plumbing facilities: 5.3% Housing units lacking complete kitchen facilities: 3.7%
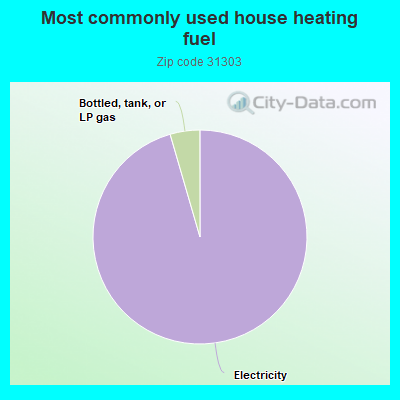
95.7%Electricity
4.5%Bottled, tank, or LP gas
Population in 1990: 400. Population change in the 1990s: +1,634 (+408.5%).
Place of birth for U.S.-born residents:
This state: 1,334
Northeast: 77
Midwest: 16
South: 513
West: 92
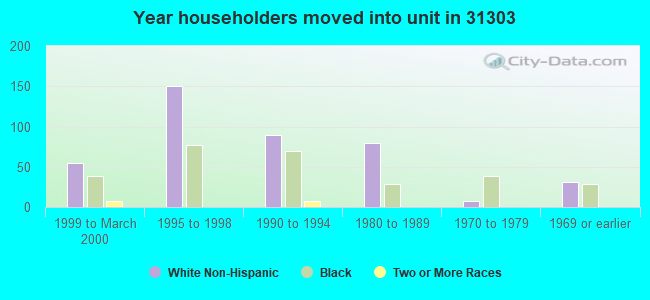
72% of the 31303 zip code residents lived in the same house 5 years ago. Out of people who lived in different houses, 56% lived in this county. Out of people who lived in different counties, 50% lived in Georgia.
98% of the 31303 zip code residents lived in the same house 1 year ago. Out of people who lived in different houses, 62% moved from this county. Out of people who lived in different houses, 12% moved from different county within same state. Out of people who lived in different houses, 30% moved from different state.
Private vs. public school enrollment:
Students in private schools in grades 1 to 8 (elementary and middle school):
Here:
0.0%
Georgia:
12.1%
Students in private schools in grades 9 to 12 (high school):
Here:
0.0%
Georgia:
10.8%
Students in private undergraduate colleges: 9
Here:
69.8%
Georgia:
17.1%
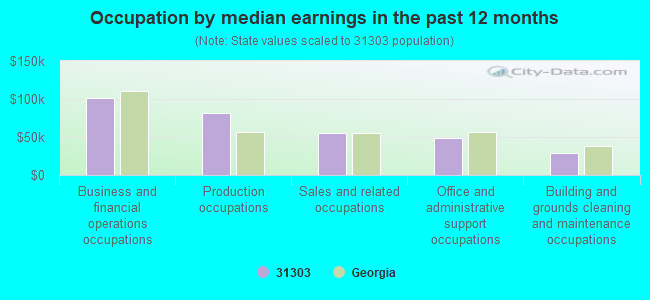
Occupation by median earnings in the past 12 months ($)
101,668Business and financial operations occupations
81,679Production occupations
55,875Sales and related occupations
48,729Office and administrative support occupations
29,136Building and grounds cleaning and maintenance occupations
Companies with federal contracts located in this zip code:
SAVANNAH RIVER TIMBER (P O BOX 7 in CLYO, GA; small business)
$12,950 with Army for Other Range/Forest Improvements Services (non-construction). Signed on 2004-06-15. Completion date: 2004-06-30.
Top industries in this zip code by the number of employees in 2005:
Construction: Drywall and Insulation Contractors (20-49 employees: 1 establishment)
Administrative and Support and Waste Management and Remediation Services: Exterminating and Pest Control Services (10-19: 1)
Administrative and Support and Waste Management and Remediation Services: Janitorial Services (5-9: 1)
Real Estate and Rental and Leasing: Offices of Real Estate Agents and Brokers (1-4: 2)
Professional, Scientific, and Technical Services: Offices of Lawyers (1-4: 1)
Other Services (except Public Administration): Religious Organizations (1-4: 1)
Real Estate and Rental and Leasing: Offices of Real Estate Appraisers (1-4: 1)
Fatal accident statistics in 2014:
Fatal accident count: 1
Vehicles involved in fatal accidents: 1
Fatal accidents caused by drunken drivers: 0
Fatalities: 1
Persons involved in fatal accidents: 2
Pedestrians involved in fatal accidents: 0
Fatal accident statistics in 2012:
Fatal accident count: 1
Vehicles involved in fatal accidents: 1
Fatal accidents caused by drunken drivers: 0
Fatalities: 1
Persons involved in fatal accidents: 1
Pedestrians involved in fatal accidents: 0
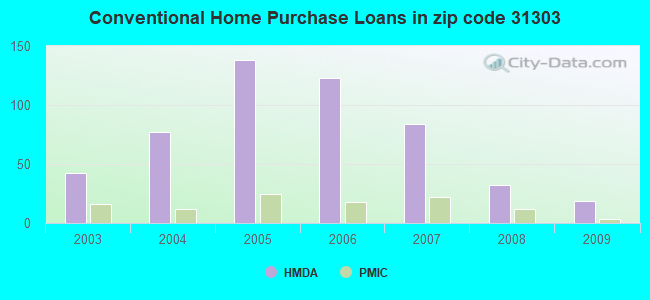
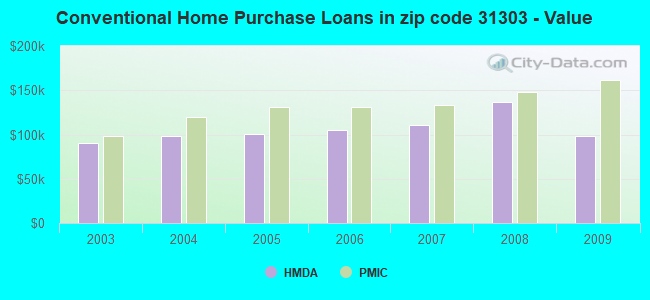
Home Mortgage Disclosure Act Aggregated Statistics For Year 2009 (Based on 4 partial tracts)
A) FHA, FSA/RHS & VA Home Purchase Loans
B) Conventional Home Purchase Loans
C) Refinancings
D) Home Improvement Loans
E) Loans on Dwellings For 5+ Families
F) Non-occupant Loans on < 5 Family Dwellings (A B C & D)
G) Loans On Manufactured Home Dwelling (A B C & D)
Number
Average Value
Number
Average Value
Number
Average Value
Number
Average Value
Number
Average Value
Number
Average Value
Number
Average Value
LOANS ORIGINATED
30
$135,443
19
$98,515
110
$148,469
6
$29,583
1
$73,430
26
$125,492
25
$62,889
APPLICATIONS APPROVED, NOT ACCEPTED
1
$63,020
2
$140,680
13
$161,935
2
$149,480
0
$0
1
$61,730
3
$105,920
APPLICATIONS DENIED
10
$128,632
4
$70,708
60
$173,365
6
$31,563
0
$0
7
$62,823
18
$74,147
APPLICATIONS WITHDRAWN
7
$103,504
2
$115,340
25
$158,822
1
$58,480
0
$0
0
$0
6
$98,958
FILES CLOSED FOR INCOMPLETENESS
2
$265,430
0
$0
6
$145,777
1
$149,480
0
$0
0
$0
1
$73,430
Aggregated Statistics For Year 2008 (Based on 4 partial tracts)
A) FHA, FSA/RHS & VA Home Purchase Loans
B) Conventional Home Purchase Loans
C) Refinancings
D) Home Improvement Loans
E) Loans on Dwellings For 5+ Families
F) Non-occupant Loans on < 5 Family Dwellings (A B C & D)
G) Loans On Manufactured Home Dwelling (A B C & D)
Number
Average Value
Number
Average Value
Number
Average Value
Number
Average Value
Number
Average Value
Number
Average Value
Number
Average Value
LOANS ORIGINATED
31
$138,376
32
$137,092
99
$126,029
13
$91,158
1
$345,820
43
$105,708
33
$72,233
APPLICATIONS APPROVED, NOT ACCEPTED
1
$81,870
5
$87,080
7
$156,287
2
$124,705
0
$0
2
$72,720
4
$71,060
APPLICATIONS DENIED
5
$135,080
11
$126,056
74
$150,139
18
$74,268
0
$0
5
$128,922
17
$88,485
APPLICATIONS WITHDRAWN
5
$174,956
1
$159,180
32
$160,438
3
$134,690
0
$0
1
$149,110
4
$124,702
FILES CLOSED FOR INCOMPLETENESS
0
$0
2
$110,290
7
$176,756
2
$38,380
0
$0
0
$0
1
$116,960
Aggregated Statistics For Year 2007 (Based on 4 partial tracts)
A) FHA, FSA/RHS & VA Home Purchase Loans
B) Conventional Home Purchase Loans
C) Refinancings
D) Home Improvement Loans
E) Loans on Dwellings For 5+ Families
F) Non-occupant Loans on < 5 Family Dwellings (A B C & D)
G) Loans On Manufactured Home Dwelling (A B C & D)
Number
Average Value
Number
Average Value
Number
Average Value
Number
Average Value
Number
Average Value
Number
Average Value
Number
Average Value
LOANS ORIGINATED
16
$129,038
84
$111,073
103
$133,219
13
$77,971
1
$339,360
28
$93,769
45
$66,358
APPLICATIONS APPROVED, NOT ACCEPTED
0
$0
5
$74,118
24
$116,103
4
$70,952
0
$0
2
$50,500
6
$62,467
APPLICATIONS DENIED
2
$132,915
29
$87,632
86
$131,040
27
$64,738
0
$0
5
$82,248
17
$66,045
APPLICATIONS WITHDRAWN
3
$165,103
15
$129,234
31
$133,259
9
$90,613
0
$0
1
$88,070
7
$86,914
FILES CLOSED FOR INCOMPLETENESS
1
$87,070
2
$183,260
11
$144,885
1
$9,750
0
$0
0
$0
0
$0
Aggregated Statistics For Year 2006 (Based on 4 partial tracts)
A) FHA, FSA/RHS & VA Home Purchase Loans
B) Conventional Home Purchase Loans
C) Refinancings
D) Home Improvement Loans
F) Non-occupant Loans on < 5 Family Dwellings (A B C & D)
G) Loans On Manufactured Home Dwelling (A B C & D)
Number
Average Value
Number
Average Value
Number
Average Value
Number
Average Value
Number
Average Value
Number
Average Value
LOANS ORIGINATED
28
$146,528
123
$105,419
118
$130,905
18
$39,816
42
$86,440
34
$79,081
APPLICATIONS APPROVED, NOT ACCEPTED
1
$77,980
14
$124,188
17
$127,202
2
$17,775
2
$80,800
1
$278,000
APPLICATIONS DENIED
3
$118,750
22
$101,187
97
$120,725
24
$55,611
7
$71,766
30
$77,606
APPLICATIONS WITHDRAWN
1
$77,570
10
$118,770
43
$140,975
7
$62,829
2
$82,820
4
$79,638
FILES CLOSED FOR INCOMPLETENESS
0
$0
2
$108,460
10
$128,056
1
$109,080
0
$0
0
$0
Aggregated Statistics For Year 2005 (Based on 4 partial tracts)
A) FHA, FSA/RHS & VA Home Purchase Loans
B) Conventional Home Purchase Loans
C) Refinancings
D) Home Improvement Loans
F) Non-occupant Loans on < 5 Family Dwellings (A B C & D)
G) Loans On Manufactured Home Dwelling (A B C & D)
Number
Average Value
Number
Average Value
Number
Average Value
Number
Average Value
Number
Average Value
Number
Average Value
LOANS ORIGINATED
29
$121,277
138
$100,550
100
$108,452
17
$44,109
38
$87,472
26
$65,587
APPLICATIONS APPROVED, NOT ACCEPTED
1
$226,150
13
$92,188
21
$107,750
1
$113,720
2
$46,865
4
$89,432
APPLICATIONS DENIED
1
$35,090
30
$68,874
75
$102,322
23
$47,931
4
$78,662
28
$60,012
APPLICATIONS WITHDRAWN
1
$72,720
15
$117,639
30
$133,868
11
$114,850
4
$95,142
7
$91,793
FILES CLOSED FOR INCOMPLETENESS
0
$0
10
$80,905
8
$108,029
0
$0
1
$69,490
1
$107,220
Aggregated Statistics For Year 2004 (Based on 4 partial tracts)
A) FHA, FSA/RHS & VA Home Purchase Loans
B) Conventional Home Purchase Loans
C) Refinancings
D) Home Improvement Loans
F) Non-occupant Loans on < 5 Family Dwellings (A B C & D)
G) Loans On Manufactured Home Dwelling (A B C & D)
Number
Average Value
Number
Average Value
Number
Average Value
Number
Average Value
Number
Average Value
Number
Average Value
LOANS ORIGINATED
14
$128,236
77
$98,044
109
$118,961
14
$51,181
20
$74,076
35
$60,817
APPLICATIONS APPROVED, NOT ACCEPTED
0
$0
4
$92,832
22
$94,110
2
$20,240
2
$63,430
12
$63,032
APPLICATIONS DENIED
1
$84,030
21
$70,008
56
$97,061
11
$37,203
6
$71,775
25
$54,844
APPLICATIONS WITHDRAWN
2
$88,070
5
$149,378
36
$101,345
2
$94,940
1
$77,950
6
$72,285
FILES CLOSED FOR INCOMPLETENESS
0
$0
3
$196,117
13
$104,295
0
$0
2
$50,095
1
$124,370
Aggregated Statistics For Year 2003 (Based on 4 partial tracts)
A) FHA, FSA/RHS & VA Home Purchase Loans
B) Conventional Home Purchase Loans
C) Refinancings
D) Home Improvement Loans
F) Non-occupant Loans on < 5 Family Dwellings (A B C & D)
Detailed PMIC statistics for the following Tracts:0301.00
, 0302.02
2003 - 2018 National Fire Incident Reporting System (NFIRS) incidents
According to the data from the years 2003 - 2018 the average number of fires per year is 13. The highest number of reported fires - 28 took place in 2011, and the least - 0 in 2004. The data has an increasing trend.
When looking into fire subcategories, the most incidents belonged to: Outside Fires (58.9%), and Structure Fires (28.0%).
Fire incident types reported to NFIRS in Zip Code 31303

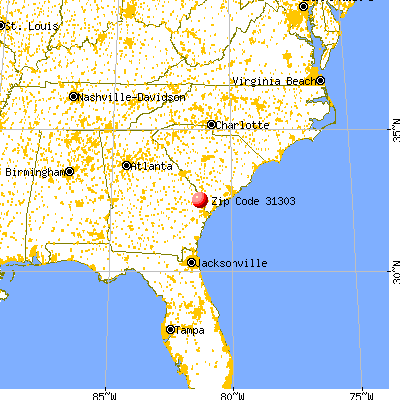


 Nearest zip codes: 31329, 29943, 29922, 30446, 29939, 31312.


 According to the data from the years 2003 - 2018 the average number of fires per year is 13. The highest number of reported fires - 28 took place in 2011, and the least - 0 in 2004. The data has an increasing trend.
 When looking into fire subcategories, the most incidents belonged to: Outside Fires (58.9%), and Structure Fires (28.0%).