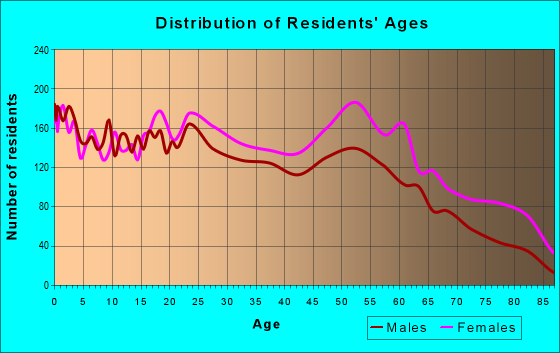
Estimated zip code population in 2022: 20,586 Zip code population in 2010: 21,757 Zip code population in 2000: 24,380
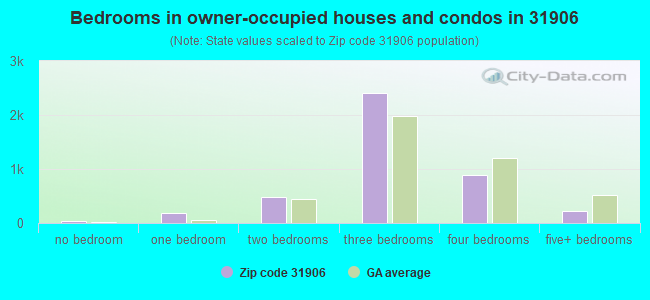
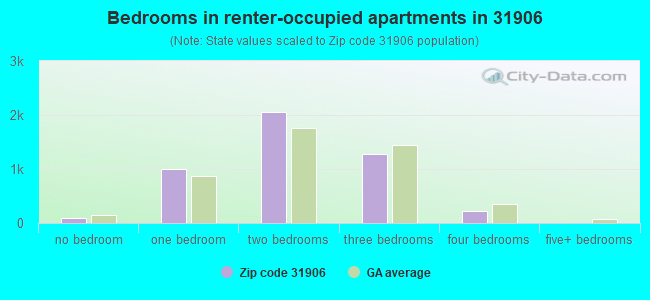
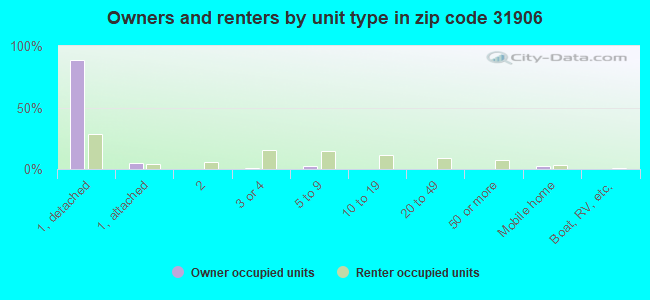
Houses and condos: 11,170 Renter-occupied apartments: 4,616
% of renters here:
52%
State:
34%
March 2022 cost of living index in zip code 31906: 84.0 (less than average, U.S. average is 100)
Land area: 6.9 sq. mi. Water area: 0.0 sq. mi.
Population density: 2,996 people per square mile
(average).
OSM Map
General Map
Google Map
MSN Map
OSM Map
General Map
Google Map
MSN Map
OSM Map
General Map
Google Map
MSN Map
OSM Map
General Map
Google Map
MSN Map
Please wait while loading the map...
Real estate property taxes paid for housing units in 2022:
This zip code:
0.9% ($1,618)
Georgia:
0.7% ($2,160)
Median real estate property taxes paid for housing units with mortgages in 2022: $2,153 (1.0%) Median real estate property taxes paid for housing units with no mortgage in 2022: $1,070 (0.7%)
Averages for the 2020 tax year for zip code 31906, filed in 2021:
Average Adjusted Gross Income (AGI) in 2020: $62,670 (Individual Income Tax Returns)
Here:
$62,670
State:
$70,847
Salary/wage: $47,402 (reported on 82.8% of returns)
Here:
$47,402
State:
$59,126
(% of AGI for various income ranges: 1243.7% for AGIs below $25k, 3591.4% for AGIs $25k-50k, 6685.8% for AGIs $50k-75k, 9786.1% for AGIs $75k-100k, 19577.3% for AGIs $100k-200k, 182233.8% for AGIs over 200k)
Taxable interest for individuals: $3,057 (reported on 17.1% of returns)
This zip code:
$3,057
Georgia:
$2,011
(% of AGI for various income ranges: 4.8% for AGIs below $25k, 8.0% for AGIs $25k-50k, 23.3% for AGIs $50k-75k, 79.1% for AGIs $75k-100k, 189.2% for AGIs $100k-200k, 4771.2% for AGIs over 200k)
Ordinary dividends: $27,085 (reported on 14.9% of returns)
Here:
$27,085
State:
$8,996
(% of AGI for various income ranges: 17.4% for AGIs below $25k, 25.5% for AGIs $25k-50k, 162.5% for AGIs $50k-75k, 485.2% for AGIs $75k-100k, 1641.9% for AGIs $100k-200k, 38868.8% for AGIs over 200k)
Net capital gain/loss in AGI: +$34,634 (reported on 12.6% of returns)
Here:
+$34,634
State:
+$28,402
(% of AGI for various income ranges: 11.8% for AGIs below $25k, 18.8% for AGIs $25k-50k, 149.2% for AGIs $50k-75k, 305.7% for AGIs $75k-100k, 1038.8% for AGIs $100k-200k, 45746.2% for AGIs over 200k)
Profit/loss from business: +$3,346 (reported on 18.4% of returns)
Here:
+$3,346
State:
+$6,707
(% of AGI for various income ranges: 37.3% for AGIs below $25k, 139.4% for AGIs $50k-75k, 215.2% for AGIs $75k-100k, 429.6% for AGIs $100k-200k, 3903.8% for AGIs over 200k)
Taxable individual retirement arrangement distribution: $23,010 (reported on 4.2% of returns)
31906:
$23,010
Georgia:
$20,525
(% of AGI for various income ranges: 12.6% for AGIs below $25k, 37.9% for AGIs $25k-50k, 110.4% for AGIs $50k-75k, 344.3% for AGIs $75k-100k, 1152.7% for AGIs $100k-200k, 4526.2% for AGIs over 200k)
Self-employed (Keogh) retirement plans: $29,800 (reported on 0.2% of returns)
31906:
$29,800
Georgia:
$27,751
(% of AGI for various income ranges: 229.2% for AGIs $100k-200k)
Total itemized deductions: $61,849 (reported on 7.9% of returns)
Here:
$61,849
State:
$34,001
(% of AGI for various income ranges: 20.9% for AGIs below $25k, 102.5% for AGIs $25k-50k, 575.4% for AGIs $50k-75k, 1020.4% for AGIs $75k-100k, 2068.5% for AGIs $100k-200k, 41240.0% for AGIs over 200k)
Charity contributions: $46,610 (reported on 7.3% of returns)
Here:
$46,610
State:
$14,164
(% of AGI for various income ranges: 4.2% for AGIs below $25k, 35.5% for AGIs $25k-50k, 216.9% for AGIs $50k-75k, 403.5% for AGIs $75k-100k, 644.2% for AGIs $100k-200k, 34537.5% for AGIs over 200k)
Taxes paid: $7,119 (reported on 7.8% of returns)
31906:
$7,119
State:
$7,540
(% of AGI for various income ranges: 3.1% for AGIs below $25k, 17.7% for AGIs $25k-50k, 104.6% for AGIs $50k-75k, 221.3% for AGIs $75k-100k, 536.5% for AGIs $100k-200k, 2977.5% for AGIs over 200k)
Earned income credit: $2,743 (reported on 35.3% of returns)
Here:
$2,743
State:
$2,530
(% of AGI for various income ranges: 176.5% for AGIs below $25k, 113.0% for AGIs $25k-50k)
Percentage of individuals using paid preparers for their 2020 taxes: 93.8%
Here:
94%
State:
93%
(% for various income ranges: 93.5% for AGIs below $25k, 94.2% for AGIs $25k-50k, 93.2% for AGIs $50k-75k, 92.9% for AGIs $75k-100k, 94.8% for AGIs $100k-200k, 94.9% for AGIs over 200k)
Averages for the 2012 tax year for zip code 31906, filed in 2013:
Average Adjusted Gross Income (AGI) in 2012: $44,678 (Individual Income Tax Returns)
Here:
$44,678
State:
$56,131
Salary/wage: $35,464 (reported on 86.8% of returns)
Here:
$35,464
State:
$47,942
(% of AGI for various income ranges: 86.8% for AGIs below $25k, 90.8% for AGIs $25k-50k, 70.6% for AGIs $50k-75k, 68.6% for AGIs $75k-100k, 60.6% for AGIs $100k-200k, 47.6% for AGIs over 200k)
Taxable interest for individuals: $2,418 (reported on 14.4% of returns)
This zip code:
$2,418
Georgia:
$1,706
(% of AGI for various income ranges: 0.4% for AGIs below $25k, 0.3% for AGIs $25k-50k, 0.7% for AGIs $50k-75k, 0.5% for AGIs $75k-100k, 1.1% for AGIs $100k-200k, 1.2% for AGIs over 200k)
Ordinary dividends: $22,617 (reported on 12.0% of returns)
Here:
$22,617
State:
$7,265
(% of AGI for various income ranges: 0.8% for AGIs below $25k, 0.7% for AGIs $25k-50k, 2.6% for AGIs $50k-75k, 3.1% for AGIs $75k-100k, 6.8% for AGIs $100k-200k, 13.6% for AGIs over 200k)
Net capital gain/loss in AGI: +$27,930 (reported on 9.0% of returns)
Here:
+$27,930
State:
+$16,323
(% of AGI for various income ranges: 0.1% for AGIs below $25k, 0.2% for AGIs $25k-50k, 1.1% for AGIs $50k-75k, 1.1% for AGIs $75k-100k, 2.9% for AGIs $100k-200k, 15.0% for AGIs over 200k)
Profit/loss from business: +$4,007 (reported on 18.0% of returns)
Here:
+$4,007
State:
+$7,583
(% of AGI for various income ranges: 4.7% for AGIs below $25k, 1.3% for AGIs $50k-75k, 1.7% for AGIs $75k-100k, 3.5% for AGIs $100k-200k, 1.1% for AGIs over 200k)
Taxable individual retirement arrangement distribution: $18,066 (reported on 4.8% of returns)
31906:
$18,066
Georgia:
$17,199
(% of AGI for various income ranges: 0.6% for AGIs below $25k, 0.9% for AGIs $25k-50k, 1.8% for AGIs $50k-75k, 2.6% for AGIs $75k-100k, 4.0% for AGIs $100k-200k, 2.5% for AGIs over 200k)
Self-employment retirement plans: $17,867 (reported on 0.2% of returns)
31906:
$17,867
Georgia:
$23,277
Total itemized deductions: $27,194 (26% of AGI, reported on 27.0% of returns)
Here:
$27,194
State:
$23,886
Here:
25.9% of AGI
State:
21.5% of AGI
(% of AGI for various income ranges: 7.7% for AGIs below $25k, 21.1% for AGIs $25k-50k, 16.7% for AGIs $50k-75k, 17.5% for AGIs $75k-100k, 16.6% for AGIs $100k-200k, 17.5% for AGIs over 200k)
Charity contributions: $7,391 (reported on 18.7% of returns)
Here:
$7,391
State:
$5,507
(% of AGI for various income ranges: 1.2% for AGIs below $25k, 2.3% for AGIs $25k-50k, 4.2% for AGIs $50k-75k, 3.8% for AGIs $75k-100k, 3.8% for AGIs $100k-200k, 4.0% for AGIs over 200k)
Taxes paid: $7,178 (reported on 23.7% of returns)
31906:
$7,178
State:
$7,838
(% of AGI for various income ranges: 0.8% for AGIs below $25k, 1.8% for AGIs $25k-50k, 4.1% for AGIs $50k-75k, 4.9% for AGIs $75k-100k, 6.0% for AGIs $100k-200k, 5.7% for AGIs over 200k)
Earned income credit: $2,901 (reported on 36.5% of returns)
Here:
$2,901
State:
$2,589
(% of AGI for various income ranges: 12.2% for AGIs below $25k, 1.0% for AGIs $25k-50k)
Percentage of individuals using paid preparers for their 2012 taxes: 74.9%
Here:
75%
State:
55%
(% for various income ranges: 74.0% for AGIs below $25k, 79.1% for AGIs $25k-50k, 66.2% for AGIs $50k-75k, 66.7% for AGIs $75k-100k, 70.6% for AGIs $100k-200k, 86.2% for AGIs over 200k)
Averages for the 2004 tax year for zip code 31906, filed in 2005:
Average Adjusted Gross Income (AGI) in 2004: $39,965 (Individual Income Tax Returns)
Here:
$39,965
State:
$47,553
Salary/wage: $29,082 (reported on 85.5% of returns)
Here:
$29,082
State:
$42,178
(% of AGI for various income ranges: 114.5% for AGIs below $10k, 88.0% for AGIs $10k-25k, 81.6% for AGIs $25k-50k, 71.6% for AGIs $50k-75k, 61.8% for AGIs $75k-100k, 40.4% for AGIs over 100k)
Taxable interest for individuals: $2,930 (reported on 22.7% of returns)
This zip code:
$2,930
Georgia:
$1,772
(% of AGI for various income ranges: 3.5% for AGIs below $10k, 0.8% for AGIs $10k-25k, 0.8% for AGIs $25k-50k, 1.2% for AGIs $50k-75k, 2.2% for AGIs $75k-100k, 2.2% for AGIs over 100k)
Taxable dividends: $16,681 (reported on 18.6% of returns)
Here:
$16,681
State:
$4,283
(% of AGI for various income ranges: 5.9% for AGIs below $10k, 1.2% for AGIs $10k-25k, 1.6% for AGIs $25k-50k, 3.6% for AGIs $50k-75k, 4.8% for AGIs $75k-100k, 14.1% for AGIs over 100k)
Net capital gain/loss: +$27,817 (reported on 13.9% of returns)
Here:
+$27,817
State:
+$16,461
(% of AGI for various income ranges: -0.6% for AGIs below $10k, 0.3% for AGIs $10k-25k, 0.8% for AGIs $25k-50k, 1.5% for AGIs $50k-75k, 2.5% for AGIs $75k-100k, 20.2% for AGIs over 100k)
Profit/loss from business: +$5,988 (reported on 12.9% of returns)
Here:
+$5,988
State:
+$8,201
(% of AGI for various income ranges: 6.3% for AGIs below $10k, 0.2% for AGIs $10k-25k, -0.2% for AGIs $25k-50k, 1.7% for AGIs $50k-75k, 3.0% for AGIs $75k-100k, 3.0% for AGIs over 100k)
IRA payment deduction: $2,708 (reported on 1.3% of returns)
31906:
$2,708
Georgia:
$2,969
(% of AGI for various income ranges: 0.1% for AGIs $10k-25k, 0.1% for AGIs $25k-50k, 0.1% for AGIs $50k-75k, 0.1% for AGIs $75k-100k, 0.1% for AGIs over 100k)
Self-employed pension: $19,782 (reported on 0.5% of returns)
Here:
$19,782
Georgia:
$16,203
Total itemized deductions: $25,753 (25% of AGI, reported on 24.1% of returns)
Here:
$25,753
State:
$19,944
Here:
24.5% of AGI
State:
22.6% of AGI
(% of AGI for various income ranges: 8.7% for AGIs below $10k, 6.2% for AGIs $10k-25k, 13.1% for AGIs $25k-50k, 17.5% for AGIs $50k-75k, 18.9% for AGIs $75k-100k, 19.2% for AGIs over 100k)
Charity contributions deductions: $7,763 (7% of AGI, reported on 22.3% of returns)
Here:
$7,763
State:
$4,354
Here:
7.5% of AGI
State:
4.7% of AGI
(% of AGI for various income ranges: 0.7% for AGIs below $10k, 1.1% for AGIs $10k-25k, 2.9% for AGIs $25k-50k, 4.1% for AGIs $50k-75k, 4.4% for AGIs $75k-100k, 6.3% for AGIs over 100k)
Total tax: $7,928 (reported on 55.9% of returns)
31906:
$7,928
State:
$8,223
(% of AGI for various income ranges: 2.5% for AGIs below $10k, 2.2% for AGIs $10k-25k, 5.8% for AGIs $25k-50k, 9.6% for AGIs $50k-75k, 10.8% for AGIs $75k-100k, 17.2% for AGIs over 100k)
Earned income credit: $2,207 (reported on 40.4% of returns)
Here:
$2,207
State:
$1,986
Percentage of individuals using paid preparers for their 2004 taxes: 72.5%
Here:
73%
State:
62%
(% for various income ranges: 70.7% for AGIs below $10k, 75.3% for AGIs $10k-25k, 68.4% for AGIs $25k-50k, 70.3% for AGIs $50k-75k, 70.2% for AGIs $75k-100k, 81.1% for AGIs over 100k)
Likely homosexual households (counted as self-reported same-sex unmarried-partner households)
Lesbian couples: 0.4% of all households
Gay men: 0.2% of all households
Household received Food Stamps/SNAP in the past 12 months: 2,394 Household did not receive Food Stamps/SNAP in the past 12 months: 6,649
Women who had a birth in the past 12 months: 154 (125 now married, 29 unmarried) Women who did not have a birth in the past 12 months: 4,195 (1,429 now married, 2,768 unmarried)
Housing units in zip code 31906 with a mortgage: 2,301 (235 second mortgage, 181 both second mortgage and home equity loan) Houses without a mortgage: 83
Median monthly owner costs for units with a mortgage: $1,327 Median monthly owner costs for units without a mortgage: $455
Residents with income below the poverty level in 2022:
This zip code:
25.6%
Whole state:
12.7%
Residents with income below 50% of the poverty level in 2022:
This zip code:
12.1%
Whole state:
6.3%
Median number of rooms in houses and condos:
Here:
6.5
State:
6.8
Median number of rooms in apartments:
Here:
4.5
State:
4.6
Notable locations in this zip code not listed on our city pages
Notable locations in zip code 31906: Columbus Country Club (A), Cross Country Office Park (B), Fort Benning Junction (C), Bradley Museum (D), W C Bradley Memorial Library (E), Columbus Fire and Emergency Medical Services Station 4 (F), Columbus Fire and Emergency Medical Services Station 6 (G). Display/hide their locations on the map
Shopping Centers: Brookhaven Shopping Center (1), Columbus Square Shopping Center (2), Cross Country Plaza Shopping Center (3), Holly Hills Shopping Center (4), Midtown Shopping Center (5), Saint Marys Hills Plaza Shopping Center (6), Wynnton Shopping Center (7). Display/hide their locations on the map
Tourist attractions (not listed on the city page) : Columbus Museum (1251 Wynnton Road), Muscogee County School District - Libraries- Bradley Memorial (Cultural Attractions- Events- & Facilities; 1200 Bradley Drive), C & J Tours (Tours & Charters; 2324 Francis Street Suite 106).
1,897 married couples with children.
2,273 single-parent households (148 men, 2,125 women).
95.2% of residents of 31906 zip code speak English at home.
3.0% of residents speak Spanish at home (79% very well, 21% well).
0.7% of residents speak other Indo-European language at home (89% very well, 11% well).
0.6% of residents speak Asian or Pacific Island language at home (100% very well).
0.3% of residents speak other language at home (100% very well).
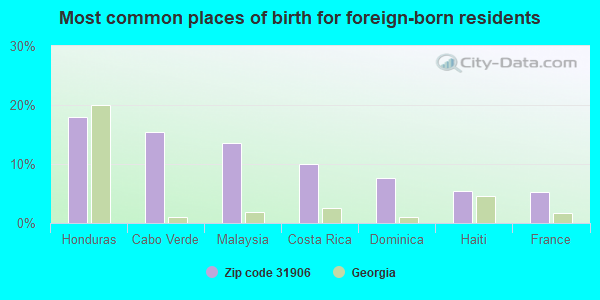
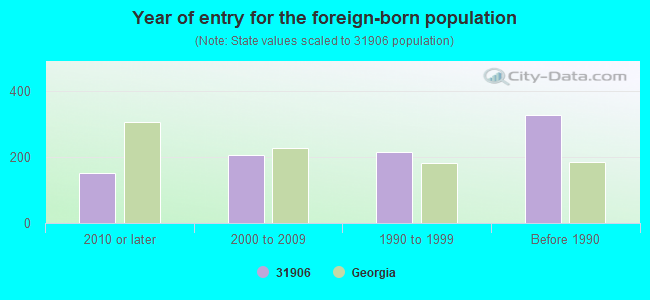
Foreign born population: 566 (2.8%) (77.7% of them are naturalized citizens)
Major facilities with environmental interests located in this zip code:
CARVER NIGHT HIGH SCHOOL (3100 EIGHTH STREET in COLUMBUS, GA)
(Geographic Names Information System) (National Center for Education Statistics) - STATE ID-5052 (National Center for Education Statistics) - STATE ID-6086 Organizations: MUSCOGEE COUNTY (SCHOOL DISTRICT)
PENSKE TRUCK LEASING (4346 ALLIED DRIVE in COLUMBUS, GA)
STATE MASTER (Georgia's Geographic Environmental Information) - UST-03, UNDERGROUND STORAGE TANK PROGRAM, UST-04, UST-06, UST-01, UST-02, UST-05, (Resource Conservation and Recovery Act (tracking hazardous waste)) Organizations: OPERNAME (CONTACT/OPERATOR)
, PENSKE TRUCK LEASING CO LP (CONTACT/OWNER)
, BRYANT & COMPANY INC (INSTALLER)
Alternative names: ROLLINS LEASING CORP
EXIDE TECHNOLOGIES INCORPORATED (3639 JOY ROAD in COLUMBUS, GA)
AIR MAJOR (AIRS/AFS) AIR SYNTHETIC MINOR (AIRS/AFS) CRITERIA AND HAZARDOUS AIR POLLUTANT INVENTORY (Inventory of air pollution sources) HAZARDOUS WASTE BIENNIAL REPORTER (Resource Conservation and Recovery Act (tracking hazardous waste)) Large Quantity Generators, more that 1000 kg of hazardous waste/month (Resource Conservation and Recovery Act (tracking hazardous waste)) - notification TSD (Resource Conservation and Recovery Act (tracking hazardous waste)) - notification TRI REPORTER (Tracking of toxic chemicals releasing facilities) Business SIC classification: INDUSTRIAL INORGANIC CHEMICALS; SECONDARY SMELTING AND REFINING OF NONFERROUS METALS; ROLLING, DRAWING, AND EXTRUDING OF NONFERROUS METALS, EXCEPT COPPER AND ALUMINUM; STORAGE BATTERIES Business NAICS classification: STORAGE BATTERY MANUFACTURING. Alternative names: EXIDE CORPORATION, GNB INC METALS DIV, GNB TECHNOLOGIES INC
CLUBVIEW ELEMENTARY SCHOOL (2836 EDGEWOOD ROAD in COLUMBUS, GA)
(Geographic Names Information System) (National Center for Education Statistics) - STATE ID-2054 Organizations: MUSCOGEE COUNTY (SCHOOL DISTRICT)
ADULT EDUCATION (514 MORRIS ROAD in COLUMBUS, GA)
(National Center for Education Statistics) - STATE ID-6800 Organizations: MUSCOGEE COUNTY (SCHOOL DISTRICT)
BREWER ELEMENTARY SCHOOL (2951 MARTIN LUTHER KING, JR. B in COLUMBUS, GA)
(National Center for Education Statistics) - STATE ID-0192 Organizations: MUSCOGEE COUNTY (SCHOOL DISTRICT)
CALHAUN CLEANERS (2969 MACON RD in COLUMBUS, GA)
AIR MINOR (AIRS/AFS) (Resource Conservation and Recovery Act (tracking hazardous waste)) Business SIC classification: LAUNDRY AND GARMENT SERVICES Organizations: OPERNAME (CONTACT/OPERATOR)
, OWNERNAME (CONTACT/OWNER)
Alternative names: CALHOUN CLEANERS
COLUMBUS HIGH SCHOOL (1700 CHEROKEE AVENUE in COLUMBUS, GA)
(National Center for Education Statistics) - STATE ID-3054 Organizations: MUSCOGEE COUNTY (SCHOOL DISTRICT)
RICHARDS MIDDLE SCHOOL (2892 EDGEWOOD ROAD in COLUMBUS, GA)
(National Center for Education Statistics) - STATE ID-2066 Organizations: MUSCOGEE COUNTY (SCHOOL DISTRICT)
MARSHALL MIDDLE SCHOOL (1830 SHEPHERD DR. in COLUMBUS, GA)
(National Center for Education Statistics) - STATE ID-0180 Organizations: MUSCOGEE COUNTY (SCHOOL DISTRICT)
LUDLOW COATED PRODS (401 OLD BROWN AVENUE in COLUMBUS, GA)
AIR SYNTHETIC MINOR (AIRS/AFS) (Resource Conservation and Recovery Act (tracking hazardous waste)) Business SIC classification: COMMERCIAL PRINTING Business NAICS classification: ALL OTHER RUBBER PRODUCT MANUFACTURING. Organizations: OPERNAME (CONTACT/OPERATOR)
, CARLISLE PLASTICS LP (CONTACT/OWNER)
Alternative names: BUCK INDUSTRIES INC, BUCK INDUSTRIES INC, TYCO PLASTICS
AMERICAN CAN CO (4356 ALLIED DR in COLUMBUS, GA)
(Resource Conservation and Recovery Act (tracking hazardous waste)) Business NAICS classification: METAL CAN MANUFACTURING. Organizations: OPERNAME (CONTACT/OPERATOR)
, OWNERNAME (CONTACT/OWNER)
ONE HOUR MARTINIZING (5727 MOON RD in COLUMBUS, GA)
(Resource Conservation and Recovery Act (tracking hazardous waste)) Organizations: OPERNAME (CONTACT/OPERATOR)
, SNO-WHITE LAUNDRY OF COLUMBUS INC (CONTACT/OWNER)
Housing units lacking complete plumbing facilities: 2.7% Housing units lacking complete kitchen facilities: 5.5%
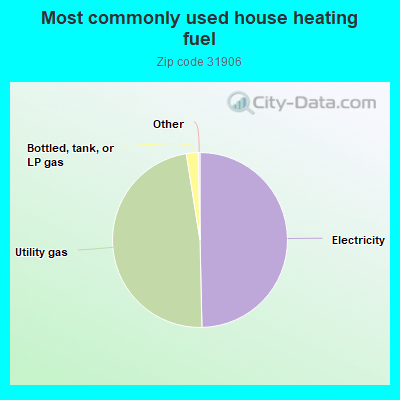
49.7%Electricity
47.9%Utility gas
2.2%Bottled, tank, or LP gas
Population in 1990: 26,061.
Place of birth for U.S.-born residents:
This state: 13,111
Northeast: 898
Midwest: 1,013
South: 4,017
West: 518
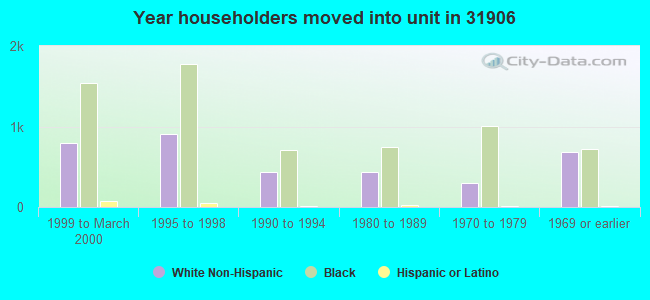
53% of the 31906 zip code residents lived in the same house 5 years ago. Out of people who lived in different houses, 66% lived in this county. Out of people who lived in different counties, 50% lived in Georgia.
86% of the 31906 zip code residents lived in the same house 1 year ago. Out of people who lived in different houses, 46% moved from this county. Out of people who lived in different houses, 14% moved from different county within same state. Out of people who lived in different houses, 32% moved from different state. Out of people who lived in different houses, 8% moved from abroad.
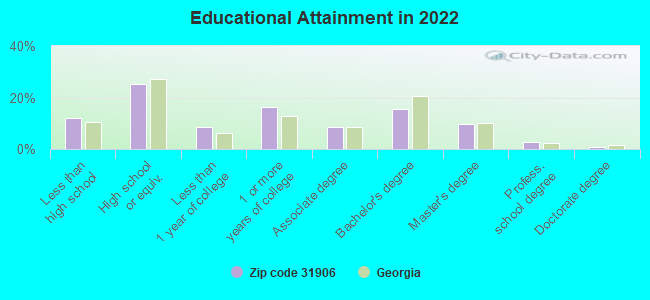
Private vs. public school enrollment:
Students in private schools in grades 1 to 8 (elementary and middle school): 495
Here:
18.3%
Georgia:
12.1%
Students in private schools in grades 9 to 12 (high school): 78
Here:
9.1%
Georgia:
10.8%
Students in private undergraduate colleges: 87
Here:
10.5%
Georgia:
17.1%
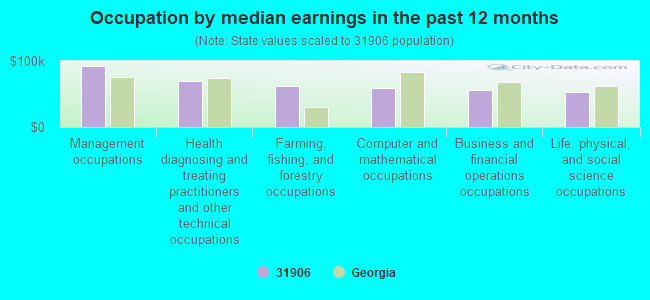
Occupation by median earnings in the past 12 months ($)
93,081Management occupations
69,256Health diagnosing and treating practitioners and other technical occupations
61,727Farming, fishing, and forestry occupations
58,714Computer and mathematical occupations
56,377Business and financial operations occupations
53,743Life, physical, and social science occupations
Companies with biggest federal contracts located in this zip code (COLUMBUS, GA):
PROFESSIONAL ENTERPRISE (3714 REGAL DRIVE; small business) : $3,031,015 in 40 contractsfrom 2000 to 2006
Contracts for Warehousing and Storage Services, Other Quality Control, Testing and Inspection Services -- Furniture, Land Treatment Practices Services (plowing/clearing, etc.), Other Transportation Travel and Relocation Services, and moreby Army Signed by year:2000: $59,951; 2001: $26,267; 2002: $128,425; 2003: $200,200; 2004: $1,709,672; 2005: $885,300; 2006: $21,200.
Biggest contracts:
$520,000 with Army for Warehousing and Storage Services. Signed on 2004-09-29. Completion date: 2005-09-28.
$307,500, same as above.Signed on 2004-11-16. Completion date: 2004-11-16.
$284,403 with Army for Other Quality Control, Testing and Inspection Services -- Furniture. Signed on 2004-04-30. Completion date: 2004-05-31.
$261,000 with Army for Warehousing and Storage Services. Signed on 2005-01-11. Completion date: 2005-01-10.
BUFFALO ROCK COMPANY INC (4356 ALLIED) : $2,299,451 in 22 contractsfrom 2001 to 2006
Contracts for Food Items For Resale by Defense Commissary Agency, Department of Defense Signed by year:2000: $0; 2001: $390,267; 2002: $149,634; 2003: $277,006; 2004: $593,996; 2005: $606,772; 2006: $281,776.
Biggest contracts:
$349,048 with Defense Commissary Agency for Food Items For Resale. Signed on 2005-04-01. Completion date: 2005-09-30.
$281,776 with Defense Commissary Agency for Food Items For Resale. Taking place in AL. Signed on 2006-01-01. Completion date: 2006-03-31.
$213,705 with Defense Commissary Agency for Food Items For Resale. Signed on 2004-10-01. Completion date: 2005-02-28.
$170,765 with Department of Defense for Food Items For Resale. Signed on 2001-12-01. Completion date: 2002-06-30.
MID-AMERICA APARTMENT COMMUNIT (3700 BUENA VISTA RD) : $1,473,512 in 25 contractsfrom 2003 to 2006
Contracts for Lease or Rental of Facilities -- Troop Housing Facilities, Construction of Structures and Facilities -- Other Residential Buildings, Lease or Rental of Facilities -- Family Housing Facilities by Army Signed by year:2000: $0; 2001: $0; 2002: $0; 2003: $390,562; 2004: $592,900; 2005: $371,250; 2006: $118,800.
Biggest contracts:
$267,300 with Army for Lease or Rental of Facilities -- Troop Housing Facilities. Signed on 2004-11-08. Completion date: 2005-02-28.
$237,600, same as above.Signed on 2004-03-31. Completion date: 2005-02-28.
$147,392 with Army for Construction of Structures and Facilities -- Other Residential Buildings. Signed on 2003-05-28. Completion date: 2003-09-30.
$108,750, same as above.Signed on 2003-10-27. Completion date: 2003-09-30.
LIVINGSTON STORAGE & TRANSF CO (4301 ALLIED DR; small business) : $1,014,035 in 11 contractsfrom 2001 to 2005
Contracts for Packing/Crating Services by Army Signed by year:2000: $0; 2001: $124,015; 2002: $0; 2003: $361,878; 2004: $456,309; 2005: $71,833; 2006: $0.
Biggest contracts:
$304,847 with Army for Packing/Crating Services. Signed on 2003-03-21. Completion date: 2002-12-31.
$286,872, same as above.Signed on 2004-01-30. Completion date: 2002-12-31.
$169,437, same as above.Signed on 2004-10-01. Completion date: 2005-07-31.
$124,015, same as above.Signed on 2001-12-18. Completion date: 2004-12-31.
RUTLEDGE ENTERPRISES (3632 REGAL DR; small business) : $394,017 in 26 contractsfrom 2000 to 2006
Contracts for Office Furniture, Miscellaneous Furniture and Fixtures, Construction of Structures and Facilities -- Office Buildings, Chemicals, and moreby Army Signed by year:2000: $42,500; 2001: $74,624; 2002: $148,451; 2003: $33,538; 2004: $61,057; 2005: $32,647; 2006: $1,200.
Biggest contracts:
$61,057 with Army for Office Furniture. Signed on 2004-09-23. Completion date: 2004-10-25.
$42,500 with Army for Miscellaneous Furniture and Fixtures. Signed on 2000-08-03. Completion date: 2000-11-30.
$33,569 with Army for Construction of Structures and Facilities -- Office Buildings. Signed on 2001-04-05. Completion date: 2001-04-30.
$32,355 with Army for Chemicals. Taking place in MI. Signed on 2001-04-02. Completion date: 2001-04-20.
G & G ELECTRONIC, INC (3425 CHEROKEE AVE; small business) : $375,586 in 5 contractsfrom 2001 to 2005
Contracts for Miscellaneous Alarm, Signal and Security Detection Systems, Installation of Equipment -- Communication, Detection, and Coherent Radiation Equipment, Maintenance, Repair or Alteration of Real Property -- Conference Space and Facilities, Construction of Structures and Facilities -- Other Non-Building Facilities by Army Signed by year:2000: $0; 2001: $118,578; 2002: $668; 2003: $0; 2004: $0; 2005: $256,340; 2006: $0.
Biggest contracts:
$146,604 with Army for Miscellaneous Alarm, Signal and Security Detection Systems. Signed on 2005-08-25. Completion date: 2005-12-30.
$118,578 with Army for Installation of Equipment -- Communication, Detection, and Coherent Radiation Equipment. Signed on 2001-06-28. Completion date: 2001-09-28.
$107,238 with Army for Maintenance, Repair or Alteration of Real Property -- Conference Space and Facilities. Signed on 2005-01-27. Completion date: 2005-02-11.
$2,498 with Army for Construction of Structures and Facilities -- Other Non-Building Facilities. Signed on 2005-07-15. Completion date: 2005-07-19.
VALLEY FIR & REDWOOD CO INC (903 MORRIS RD; small business) : $85,405 in 3 contractsfrom 2000 to 2004
$67,447 with Army for Lumber and Related Basic Wood Materials. Signed on 2000-09-22. Completion date: 2000-10-27.
$15,313, same as above.Signed on 2004-06-24. Completion date: 2004-06-30.
$2,645, same as above.Signed on 2004-09-27. Completion date: 2004-09-30.
JOHN CUNNINGHAM TRUCKS INC (3132 MERCURY DR; small business) : $56,822 in 5 contractsfrom 2003 to 2004
Contracts for Radio and Television Communication Equipment, Except Airborne, Converters, Electrical, Nonrotating, Engineering and Technical Services, Phonographs, Radio and Television Sets: Home Type by Army, Federal Technology Service Signed by year:2000: $0; 2001: $0; 2002: $0; 2003: $56,822; 2004: $0; 2005: $0; 2006: $0.
Biggest contracts:
$40,980 with Army for Radio and Television Communication Equipment, Except Airborne. Signed on 2003-09-05. Completion date: 2003-09-19.
$15,825 with Army for Converters, Electrical, Nonrotating. Signed on 2004-08-26. Completion date: 2004-09-01.
$9,407 with Federal Technology Service for Engineering and Technical Services. Signed on 2003-03-15. Completion date: 2003-04-15.
$6,435 with Army for Phonographs, Radio and Television Sets: Home Type. Signed on 2003-09-15. Completion date: 2003-10-17.
FARRAR'S HOME CENTER INC (2126 BUENA VISTA RD; small business) : $41,744 in 2 contractsfrom 2002 to 2006
$33,498 with Army for Musical Instruments. Signed on 2002-05-17. Completion date: 2002-06-03.
$8,246 with Army for Phonographs, Radio and Television Sets: Home Type. Signed on 2006-01-12. Completion date: 2006-01-26.
COLUMBUS CELLULAR TELEPHONE CO (1870 MIDTOWN DR) : $33,389 in 15 contractsfrom 2001 to 2006
Contracts for Lease or Rental of Equipment -- Communication, Detection, and Coherent Radiation Equipment, Telephone and/or Communications Services (includes Telegraph, Telex, and Cablevision Services), Communications Services, Telephone and Telegraph Equipment by Army Signed by year:2000: $0; 2001: $16,739; 2002: $17,881; 2003: $0; 2004: $0; 2005: $0; 2006: -$1,231.
Biggest contracts:
$23,122 with Army for Lease or Rental of Equipment -- Communication, Detection, and Coherent Radiation Equipment. Signed on 2001-11-01. Completion date: 2001-10-31.
$12,310 with Army for Telephone and/or Communications Services (includes Telegraph, Telex, and Cablevision Services). Signed on 2002-11-04. Completion date: 2003-09-30.
$11,699 with Army for Communications Services. Signed on 2002-02-21. Completion date: 2001-11-30.
$2,296 with Army for Telephone and Telegraph Equipment. Signed on 2002-11-13. Completion date: 2003-09-30.
Top industries in this zip code by the number of employees in 2005:
Administrative and Support and Waste Management and Remediation Services: Temporary Help Services (250-499 employees: 1 establishment, 100-249 employees: 1 establishment, 10-19 employees: 1 establishment)
2006 - 2018 National Fire Incident Reporting System (NFIRS) incidents
Based on the data from the years 2006 - 2018 the average number of fire incidents per year is 81. The highest number of reported fire incidents - 165 took place in 2011, and the least - 5 in 2006. The data has a growing trend.
When looking into fire subcategories, the most incidents belonged to: Structure Fires (45.1%), and Outside Fires (36.6%).
Fire incident types reported to NFIRS in Zip Code 31906
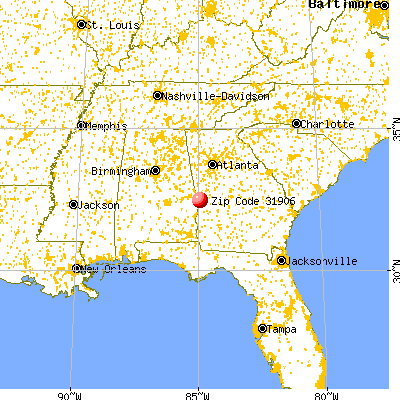


 Nearest zip codes: 31901, 31907, 31903, 36867, 31909, 31905.
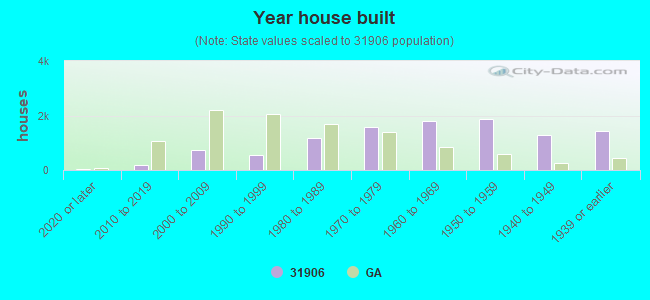


 Based on the data from the years 2006 - 2018 the average number of fire incidents per year is 81. The highest number of reported fire incidents - 165 took place in 2011, and the least - 5 in 2006. The data has a growing trend.
 When looking into fire subcategories, the most incidents belonged to: Structure Fires (45.1%), and Outside Fires (36.6%).