Estimated zip code population in 2022: 33,690 Zip code population in 2010: 28,996 Zip code population in 2000: 29,178
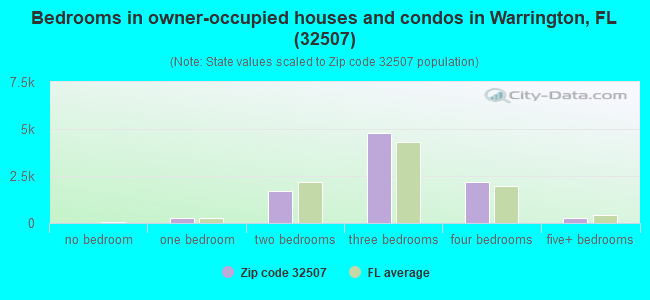
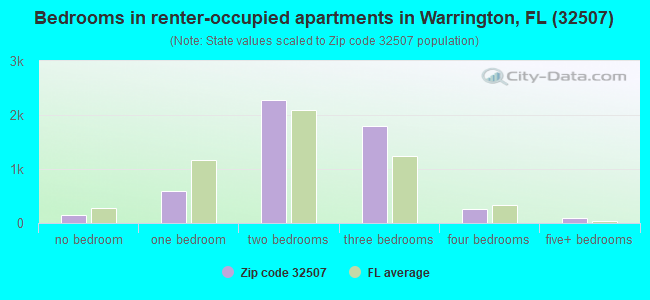
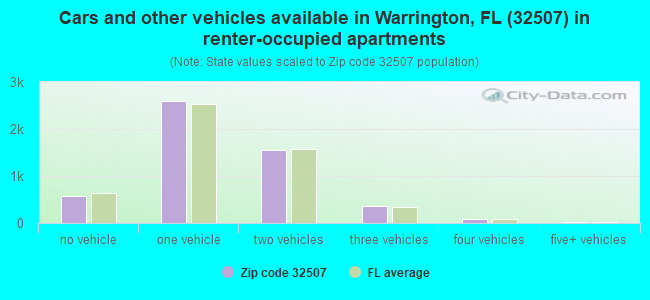
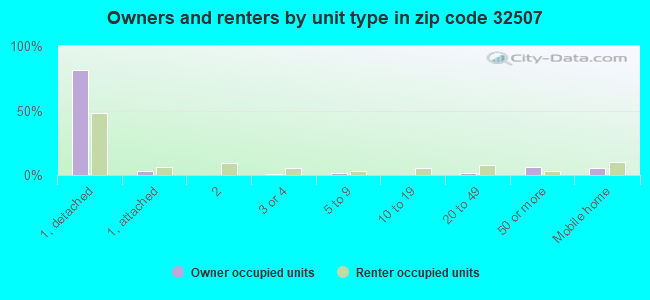
Houses and condos: 19,387 Renter-occupied apartments: 5,198
% of renters here:
36%
State:
33%
March 2022 cost of living index in zip code 32507: 86.1 (less than average, U.S. average is 100)
Land area: 25.2 sq. mi. Water area: 17.9 sq. mi.
Population density: 1,337 people per square mile
(low).
OSM Map
General Map
Google Map
MSN Map
OSM Map
General Map
Google Map
MSN Map
OSM Map
General Map
Google Map
MSN Map
OSM Map
General Map
Google Map
MSN Map
Please wait while loading the map...
Real estate property taxes paid for housing units in 2022:
This zip code:
0.5% ($1,530)
Florida:
0.7% ($2,529)
Median real estate property taxes paid for housing units with mortgages in 2022: $1,746 (0.5%) Median real estate property taxes paid for housing units with no mortgage in 2022: $1,082 (0.5%)
Averages for the 2020 tax year for zip code 32507, filed in 2021:
Average Adjusted Gross Income (AGI) in 2020: $83,474 (Individual Income Tax Returns)
Here:
$83,474
State:
$82,200
Salary/wage: $54,894 (reported on 76.6% of returns)
Here:
$54,894
State:
$58,347
(% of AGI for various income ranges: 1186.7% for AGIs below $25k, 3309.0% for AGIs $25k-50k, 5897.5% for AGIs $50k-75k, 9056.2% for AGIs $75k-100k, 14423.3% for AGIs $100k-200k, 67825.6% for AGIs over 200k)
Taxable interest for individuals: $3,668 (reported on 32.6% of returns)
This zip code:
$3,668
Florida:
$4,272
(% of AGI for various income ranges: 15.1% for AGIs below $25k, 34.7% for AGIs $25k-50k, 56.1% for AGIs $50k-75k, 111.4% for AGIs $75k-100k, 260.1% for AGIs $100k-200k, 4368.1% for AGIs over 200k)
Ordinary dividends: $14,938 (reported on 20.2% of returns)
Here:
$14,938
State:
$15,863
(% of AGI for various income ranges: 18.5% for AGIs below $25k, 32.1% for AGIs $25k-50k, 129.5% for AGIs $50k-75k, 238.3% for AGIs $75k-100k, 581.8% for AGIs $100k-200k, 12384.8% for AGIs over 200k)
Net capital gain/loss in AGI: +$55,605 (reported on 19.4% of returns)
Here:
+$55,605
State:
+$62,983
(% of AGI for various income ranges: 5.4% for AGIs below $25k, 40.2% for AGIs $25k-50k, 126.6% for AGIs $50k-75k, 264.8% for AGIs $75k-100k, 863.8% for AGIs $100k-200k, 53895.9% for AGIs over 200k)
Profit/loss from business: +$13,408 (reported on 15.9% of returns)
Here:
+$13,408
State:
+$9,719
(% of AGI for various income ranges: 145.8% for AGIs below $25k, 86.8% for AGIs $25k-50k, 191.7% for AGIs $50k-75k, 263.7% for AGIs $75k-100k, 545.7% for AGIs $100k-200k, 4795.9% for AGIs over 200k)
Taxable individual retirement arrangement distribution: $28,086 (reported on 9.9% of returns)
32507:
$28,086
Florida:
$24,823
(% of AGI for various income ranges: 36.0% for AGIs below $25k, 83.7% for AGIs $25k-50k, 255.7% for AGIs $50k-75k, 550.1% for AGIs $75k-100k, 1436.4% for AGIs $100k-200k, 5525.9% for AGIs over 200k)
Self-employed (Keogh) retirement plans: $28,900 (reported on 0.3% of returns)
32507:
$28,900
Florida:
$29,694
(% of AGI for various income ranges: 535.2% for AGIs over 200k)
Total itemized deductions: $48,082 (reported on 10.0% of returns)
Here:
$48,082
State:
$45,393
(% of AGI for various income ranges: 61.5% for AGIs below $25k, 164.7% for AGIs $25k-50k, 494.3% for AGIs $50k-75k, 791.7% for AGIs $75k-100k, 1828.9% for AGIs $100k-200k, 12007.8% for AGIs over 200k)
Charity contributions: $18,370 (reported on 5.6% of returns)
Here:
$18,370
State:
$20,178
(% of AGI for various income ranges: 2.8% for AGIs below $25k, 11.9% for AGIs $25k-50k, 57.6% for AGIs $50k-75k, 84.9% for AGIs $75k-100k, 268.3% for AGIs $100k-200k, 3924.4% for AGIs over 200k)
Taxes paid: $6,484 (reported on 7.0% of returns)
32507:
$6,484
State:
$6,967
(% of AGI for various income ranges: 3.6% for AGIs below $25k, 11.4% for AGIs $25k-50k, 38.8% for AGIs $50k-75k, 78.6% for AGIs $75k-100k, 186.2% for AGIs $100k-200k, 1195.2% for AGIs over 200k)
Earned income credit: $2,516 (reported on 19.8% of returns)
Here:
$2,516
State:
$2,306
(% of AGI for various income ranges: 130.0% for AGIs below $25k, 66.9% for AGIs $25k-50k, 1.1% for AGIs $50k-75k)
Percentage of individuals using paid preparers for their 2020 taxes: 92.4%
Here:
92%
State:
92%
(% for various income ranges: 91.9% for AGIs below $25k, 93.7% for AGIs $25k-50k, 91.3% for AGIs $50k-75k, 92.4% for AGIs $75k-100k, 92.3% for AGIs $100k-200k, 92.2% for AGIs over 200k)
Averages for the 2012 tax year for zip code 32507, filed in 2013:
Average Adjusted Gross Income (AGI) in 2012: $58,046 (Individual Income Tax Returns)
Here:
$58,046
State:
$60,316
Salary/wage: $41,034 (reported on 79.2% of returns)
Here:
$41,034
State:
$45,277
(% of AGI for various income ranges: 76.1% for AGIs below $25k, 75.7% for AGIs $25k-50k, 66.6% for AGIs $50k-75k, 63.2% for AGIs $75k-100k, 61.8% for AGIs $100k-200k, 29.1% for AGIs over 200k)
Taxable interest for individuals: $2,406 (reported on 31.6% of returns)
This zip code:
$2,406
Florida:
$3,587
(% of AGI for various income ranges: 1.1% for AGIs below $25k, 0.7% for AGIs $25k-50k, 1.0% for AGIs $50k-75k, 1.3% for AGIs $75k-100k, 1.2% for AGIs $100k-200k, 1.9% for AGIs over 200k)
Ordinary dividends: $14,231 (reported on 17.9% of returns)
Here:
$14,231
State:
$12,831
(% of AGI for various income ranges: 1.7% for AGIs below $25k, 1.4% for AGIs $25k-50k, 1.4% for AGIs $50k-75k, 2.1% for AGIs $75k-100k, 2.5% for AGIs $100k-200k, 10.0% for AGIs over 200k)
Net capital gain/loss in AGI: +$28,520 (reported on 15.1% of returns)
Here:
+$28,520
State:
+$33,493
(% of AGI for various income ranges: 0.3% for AGIs $25k-50k, 0.6% for AGIs $50k-75k, 0.8% for AGIs $75k-100k, 2.6% for AGIs $100k-200k, 21.8% for AGIs over 200k)
Profit/loss from business: +$12,881 (reported on 14.4% of returns)
Here:
+$12,881
State:
+$10,012
(% of AGI for various income ranges: 8.4% for AGIs below $25k, 2.5% for AGIs $25k-50k, 1.9% for AGIs $50k-75k, 2.3% for AGIs $75k-100k, 2.5% for AGIs $100k-200k, 3.2% for AGIs over 200k)
Taxable individual retirement arrangement distribution: $19,711 (reported on 9.5% of returns)
32507:
$19,711
Florida:
$21,544
(% of AGI for various income ranges: 1.7% for AGIs below $25k, 2.0% for AGIs $25k-50k, 3.5% for AGIs $50k-75k, 3.7% for AGIs $75k-100k, 4.3% for AGIs $100k-200k, 3.4% for AGIs over 200k)
Self-employment retirement plans: $17,560 (reported on 0.4% of returns)
32507:
$17,560
Florida:
$20,611
(% of AGI for various income ranges: 0.2% for AGIs $25k-50k, 0.3% for AGIs over 200k)
Total itemized deductions: $23,729 (17% of AGI, reported on 21.7% of returns)
Here:
$23,729
State:
$25,533
Here:
16.6% of AGI
State:
18.0% of AGI
(% of AGI for various income ranges: 6.7% for AGIs below $25k, 7.3% for AGIs $25k-50k, 9.9% for AGIs $50k-75k, 9.6% for AGIs $75k-100k, 11.4% for AGIs $100k-200k, 8.0% for AGIs over 200k)
Charity contributions: $5,453 (reported on 17.6% of returns)
Here:
$5,453
State:
$5,698
(% of AGI for various income ranges: 0.7% for AGIs below $25k, 0.9% for AGIs $25k-50k, 1.6% for AGIs $50k-75k, 1.7% for AGIs $75k-100k, 2.2% for AGIs $100k-200k, 2.0% for AGIs over 200k)
Taxes paid: $5,069 (reported on 21.2% of returns)
32507:
$5,069
State:
$6,203
(% of AGI for various income ranges: 1.0% for AGIs below $25k, 1.2% for AGIs $25k-50k, 2.1% for AGIs $50k-75k, 2.0% for AGIs $75k-100k, 2.5% for AGIs $100k-200k, 1.9% for AGIs over 200k)
Earned income credit: $2,463 (reported on 24.1% of returns)
Here:
$2,463
State:
$2,372
(% of AGI for various income ranges: 8.5% for AGIs below $25k, 1.2% for AGIs $25k-50k)
Percentage of individuals using paid preparers for their 2012 taxes: 42.4%
Here:
42%
State:
54%
(% for various income ranges: 38.9% for AGIs below $25k, 38.2% for AGIs $25k-50k, 43.4% for AGIs $50k-75k, 45.8% for AGIs $75k-100k, 53.7% for AGIs $100k-200k, 85.0% for AGIs over 200k)
Averages for the 2004 tax year for zip code 32507, filed in 2005:
Average Adjusted Gross Income (AGI) in 2004: $51,773 (Individual Income Tax Returns)
Here:
$51,773
State:
$50,523
Salary/wage: $34,795 (reported on 80.0% of returns)
Here:
$34,795
State:
$39,563
(% of AGI for various income ranges: 138.0% for AGIs below $10k, 75.5% for AGIs $10k-25k, 74.8% for AGIs $25k-50k, 70.1% for AGIs $50k-75k, 63.9% for AGIs $75k-100k, 31.8% for AGIs over 100k)
Taxable interest for individuals: $2,287 (reported on 43.1% of returns)
This zip code:
$2,287
Florida:
$3,211
(% of AGI for various income ranges: 5.8% for AGIs below $10k, 1.3% for AGIs $10k-25k, 1.4% for AGIs $25k-50k, 1.3% for AGIs $50k-75k, 1.9% for AGIs $75k-100k, 2.3% for AGIs over 100k)
Taxable dividends: $5,316 (reported on 21.3% of returns)
Here:
$5,316
State:
$6,129
(% of AGI for various income ranges: 6.4% for AGIs below $10k, 1.1% for AGIs $10k-25k, 1.0% for AGIs $25k-50k, 1.5% for AGIs $50k-75k, 2.1% for AGIs $75k-100k, 3.0% for AGIs over 100k)
Net capital gain/loss: +$50,736 (reported on 18.6% of returns)
Here:
+$50,736
State:
+$27,205
(% of AGI for various income ranges: -0.8% for AGIs below $10k, 0.5% for AGIs $10k-25k, 0.5% for AGIs $25k-50k, 1.7% for AGIs $50k-75k, 2.7% for AGIs $75k-100k, 37.8% for AGIs over 100k)
Profit/loss from business: +$10,637 (reported on 13.9% of returns)
Here:
+$10,637
State:
+$10,634
(% of AGI for various income ranges: 4.1% for AGIs below $10k, 5.1% for AGIs $10k-25k, 2.5% for AGIs $25k-50k, 2.4% for AGIs $50k-75k, 2.6% for AGIs $75k-100k, 2.7% for AGIs over 100k)
IRA payment deduction: $3,134 (reported on 2.5% of returns)
32507:
$3,134
Florida:
$3,082
(% of AGI for various income ranges: 0.5% for AGIs below $10k, 0.1% for AGIs $10k-25k, 0.2% for AGIs $25k-50k, 0.2% for AGIs $50k-75k, 0.2% for AGIs $75k-100k, 0.1% for AGIs over 100k)
Self-employed pension: $17,100 (reported on 0.4% of returns)
Here:
$17,100
Florida:
$15,857
Total itemized deductions: $26,376 (23% of AGI, reported on 27.7% of returns)
Here:
$26,376
State:
$20,370
Here:
23.3% of AGI
State:
20.7% of AGI
(% of AGI for various income ranges: 21.4% for AGIs below $10k, 9.0% for AGIs $10k-25k, 15.3% for AGIs $25k-50k, 18.1% for AGIs $50k-75k, 20.6% for AGIs $75k-100k, 11.6% for AGIs over 100k)
Charity contributions deductions: $3,685 (3% of AGI, reported on 22.6% of returns)
Here:
$3,685
State:
$4,064
Here:
3.0% of AGI
State:
3.8% of AGI
(% of AGI for various income ranges: 0.8% for AGIs below $10k, 0.7% for AGIs $10k-25k, 1.5% for AGIs $25k-50k, 1.8% for AGIs $50k-75k, 2.1% for AGIs $75k-100k, 1.7% for AGIs over 100k)
Total tax: $9,034 (reported on 70.9% of returns)
32507:
$9,034
State:
$9,431
(% of AGI for various income ranges: 3.2% for AGIs below $10k, 4.0% for AGIs $10k-25k, 6.3% for AGIs $25k-50k, 8.6% for AGIs $50k-75k, 10.4% for AGIs $75k-100k, 18.2% for AGIs over 100k)
Earned income credit: $1,801 (reported on 21.1% of returns)
Here:
$1,801
State:
$1,808
Percentage of individuals using paid preparers for their 2004 taxes: 56.2%
Here:
56%
State:
60%
(% for various income ranges: 53.5% for AGIs below $10k, 56.5% for AGIs $10k-25k, 54.9% for AGIs $25k-50k, 55.8% for AGIs $50k-75k, 54.4% for AGIs $75k-100k, 68.8% for AGIs over 100k)
Likely homosexual households (counted as self-reported same-sex unmarried-partner households)
Lesbian couples: 0.1% of all households
Gay men: 0.2% of all households
Household received Food Stamps/SNAP in the past 12 months: 2,054 Household did not receive Food Stamps/SNAP in the past 12 months: 12,316
Women who had a birth in the past 12 months: 314 (185 now married, 125 unmarried) Women who did not have a birth in the past 12 months: 6,502 (2,230 now married, 4,270 unmarried)
Housing units in zip code 32507 with a mortgage: 5,555 (431 second mortgage, 329 both second mortgage and home equity loan) Houses without a mortgage: 15
Median monthly owner costs for units with a mortgage: $1,713 Median monthly owner costs for units without a mortgage: $504
Residents with income below the poverty level in 2022:
This zip code:
14.9%
Whole state:
12.7%
Residents with income below 50% of the poverty level in 2022:
This zip code:
7.9%
Whole state:
6.6%
Median number of rooms in houses and condos:
Here:
6.3
State:
5.9
Median number of rooms in apartments:
Here:
4.6
State:
4.2
Notable locations in this zip code not listed on our city pages
Notable locations in zip code 32507: Holiday Harbor Marina (A), Pensacola Country Club (B), Corry Field Shopping Mart (C), Fort McRee Leading Light (D), Warrington Fire District (E), Perdido Key Volunteer Fire Department (F), Escambia County Fire and Rescue Station 14 Pleasant Grove (G), Innerarity Point Volunteer Fire Department Station 8 (H). Display/hide their locations on the map
Shopping Centers: Warrington Village Shopping Center (1), Navy Point Shopping Center (2), Southgate Shopping Center (3). Display/hide their locations on the map
Churches in zip code 32507 include: Saint Johns Church (A), House Memorial African Methodist Episcopal Zion Church (B), Warrington Assembly of God Church (C), Bayou Grove Church (D), First Baptist Church of Warrington (E), Cross and Crown Baptist Church (F), Lakeview Baptist Church (G), Pine Summit Baptist Church (H), Pleasant Grove Baptist Church (I). Display/hide their locations on the map
3,145 married couples with children.
2,410 single-parent households (220 men, 2,190 women).
93.5% of residents of 32507 zip code speak English at home.
2.0% of residents speak Spanish at home (86% very well, 5% well, 8% not well, 1% not at all).
1.5% of residents speak other Indo-European language at home (85% very well, 10% well, 5% not well).
2.1% of residents speak Asian or Pacific Island language at home (75% very well, 9% well, 14% not well, 3% not at all).
0.3% of residents speak other language at home (94% very well, 6% well).
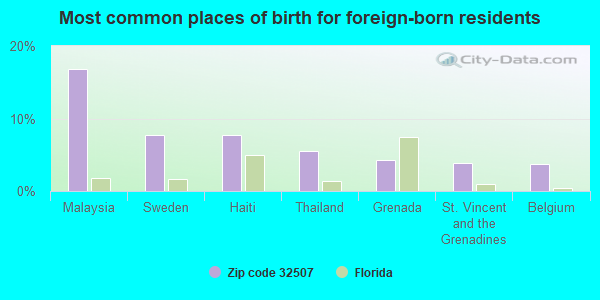
Foreign born population: 1,298 (3.9%) (64.8% of them are naturalized citizens)
This zip code:
3.9%
Whole state:
21.7%
17%Malaysia
8%Sweden
8%Haiti
5%Thailand
4%Grenada
4%St. Vincent and the Grenadines
4%Belgium
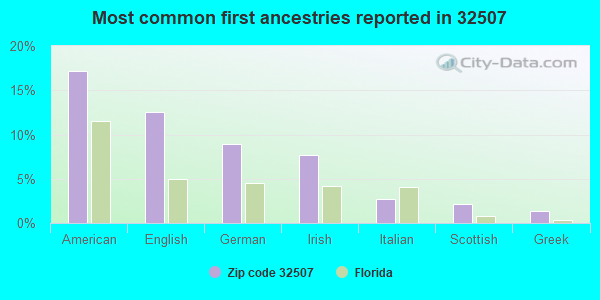
17%American
13%English
9%German
8%Irish
3%Italian
2%Scottish
1%Greek
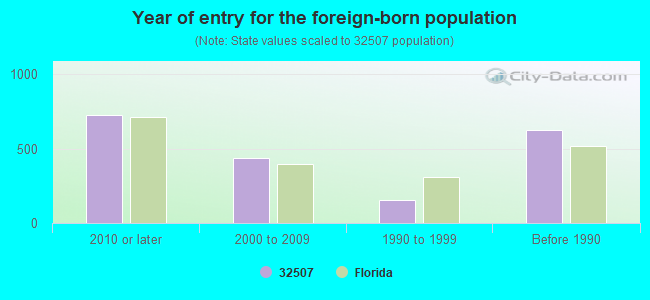
Year of entry for the foreign-born population
7252010 or later
4352000 to 2009
1531990 to 1999
621Before 1990
Major facilities with environmental interests located in this zip code:
ROD & REEL MARINA & DRY STORAGE LLC (10045 SINTON DR in PENSACOLA, FL)
STATE MASTER (FDM) - WAFR-FLR05C217, NPDES STORMWATER PROGRAM, NPDES STORMWATER PERMIT National Pollutant Discharge Elimination System NON-MAJOR (Tracking pollutant discharge elimination systems) - permit Business SIC classification: MARINAS Organizations: GEORGE LIGHT (CONTACT/OWNER)
, LESTER M WESTERMAN (CONTACT/PERMIT)
PLEASANT GROVE ELEMENTARY SCHOOL (3000 OWEN BELL LN in PENSACOLA, FL)
(Geographic Names Information System) (National Center for Education Statistics) - STATE ID-0451 Organizations: ESCAMBIA COUNTY SCHOOL DISTRICT (SCHOOL DISTRICT)
NAVY POINT ELEMENTARY SCHOOL (1321 PATTON DRIVE in PENSACOLA, FL)
(National Center for Education Statistics) - STATE ID-0381 Organizations: ESCAMBIA COUNTY SCHOOL DISTRICT (SCHOOL DISTRICT)
AIRWAY OAKS SUBDIVISION (AIRWAY DRIVE in PENSACOLA, FL)
National Pollutant Discharge Elimination System NON-MAJOR (Tracking pollutant discharge elimination systems) - permit National Pollutant Discharge Elimination System NON-MAJOR (Tracking pollutant discharge elimination systems) - permit Organizations: KIP WALKER (CONTACT/OWNER)
, MILTON RODGERS (CONTACT/OWNER)
PIONEER SAND CO. (EAST OF SAUFLEY FIELD RD in WARRINGTON, FL)
SUPERFUND NPL (Superfund database) (Integrated Compliance Information System) - ICIS-04-1989-0034, FORMAL ENFORCEMENT ACTION Business SIC classification: CONSTRUCTION SAND AND GRAVEL Alternative names: PIONEER SAND COMPANY SITE
JUDY ANDREWS PRE-K (INACTIV (129 N MERRITT ST in WARRINGTON, FL)
(National Center for Education Statistics) - STATE ID-0651 Organizations: ESCAMBIA COUNTY SCHOOL DISTRICT (SCHOOL DISTRICT)
LOST KEY MARINA & YACHT CLUB (10098 NELLE AVENUE in PENSACOLA, FL)
National Pollutant Discharge Elimination System NON-MAJOR (Tracking pollutant discharge elimination systems) - permit Organizations: THOMAS WILLIAMS (CONTACT/OWNER)
BLUE ANGEL PARKWAY PHASE II WA (INTERSECTION US HWY 98 AND BLU in PENSACOLA, FL)
National Pollutant Discharge Elimination System NON-MAJOR (Tracking pollutant discharge elimination systems) - permit Organizations: JOSEPH COOK (CONTACT/OWNER)
PALMETTO PLAZA (314 NAVY BLVD in PCOLA, FL)
National Pollutant Discharge Elimination System NON-MAJOR (Tracking pollutant discharge elimination systems) - permit Organizations: HAROLD PRIDGEN (CONTACT/OWNER)
LILLIAN'S RESTAURANT (14514 PERDIDO KEY DR in PENSACOLA, FL)
National Pollutant Discharge Elimination System NON-MAJOR (Tracking pollutant discharge elimination systems) - permit Organizations: DAVID WALSH (CONTACT/OWNER)
BLUE ANGEL PARKWAY PHASE III 2 (STARTS AT DOG TRACK RD. & B. A in PENSACOLA, FL)
National Pollutant Discharge Elimination System NON-MAJOR (Tracking pollutant discharge elimination systems) - permit Organizations: JOSEPH COOK (CONTACT/OWNER)
ACADIAN AUTO & AIR (3706 W NAVY BLVD in PENSACOLA, FL)
(Resource Conservation and Recovery Act (tracking hazardous waste)) Organizations: DAN BRECHEEN, OWNER (CONTACT/OWNER)
AMOCO SERVICE STATION #60385 (100 SOUTH NAVY BOULEVARD in PENSACOLA, FL)
Housing units lacking complete plumbing facilities: 1.6% Housing units lacking complete kitchen facilities: 1.7%
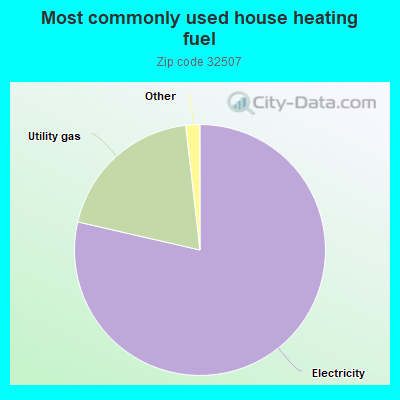
78.6%Electricity
19.6%Utility gas
0.7%No fuel used
0.5%Solar energy
Population in 1990: 23,525. Population change in the 1990s: +5,653 (+24.0%).
Place of birth for U.S.-born residents:
This state: 12,435
Northeast: 2,794
Midwest: 3,936
South: 10,150
West: 2,306
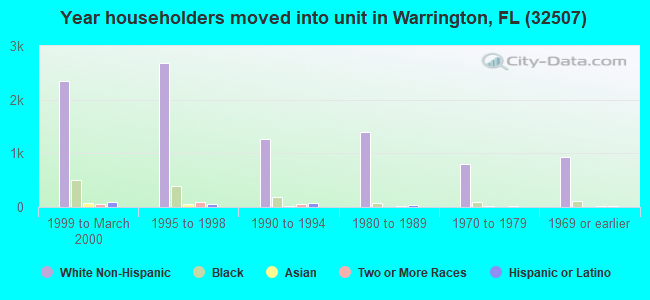
45% of the 32507 zip code residents lived in the same house 5 years ago. Out of people who lived in different houses, 47% lived in this county. Out of people who lived in different counties, 50% lived in Florida.
82% of the 32507 zip code residents lived in the same house 1 year ago. Out of people who lived in different houses, 40% moved from this county. Out of people who lived in different houses, 25% moved from different county within same state. Out of people who lived in different houses, 30% moved from different state. Out of people who lived in different houses, 3% moved from abroad.
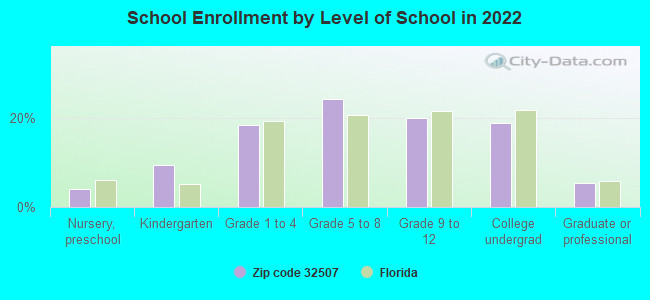
Private vs. public school enrollment:
Students in private schools in grades 1 to 8 (elementary and middle school): 744
Here:
24.1%
Florida:
15.8%
Students in private schools in grades 9 to 12 (high school): 253
Here:
17.6%
Florida:
12.9%
Students in private undergraduate colleges: 178
Here:
13.2%
Florida:
23.6%
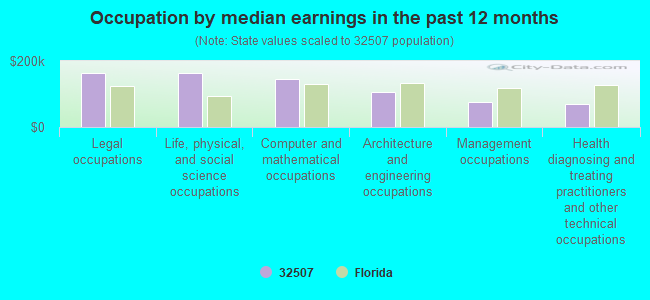
Occupation by median earnings in the past 12 months ($)
164,710Legal occupations
163,842Life, physical, and social science occupations
144,139Computer and mathematical occupations
105,565Architecture and engineering occupations
76,244Management occupations
69,885Health diagnosing and treating practitioners and other technical occupations
Companies with biggest federal contracts located in this zip code (PENSACOLA, FL):
ELLIS ENVIRONMENTAL GROUP, L C (1249 S OLD CORRY FIELD RD; small business) : $11,310,369 in 28 contractsfrom 2004 to 2006
Contracts for Maintenance, Repair or Alteration of Real Property -- Other Non-Building Facilities, Maintenance, Repair or Alteration of Real Property -- Miscellaneous Buildings, Other Environmental Services, Studies, and Analytical Support, Maintenance, Repair or Alteration of Real Property -- Schools, and moreby Navy, Air Force Signed by year:2000: $0; 2001: $0; 2002: $0; 2003: $0; 2004: $43,515; 2005: $10,937,814; 2006: $329,040.
Biggest contracts:
$5,885,685 with Navy for Maintenance, Repair or Alteration of Real Property -- Other Non-Building Facilities. Signed on 2005-09-28. Completion date: 2006-03-28.
$2,988,928 with Navy for Maintenance, Repair or Alteration of Real Property -- Miscellaneous Buildings. Signed on 2005-03-16. Completion date: 2005-08-30.
$2,408,060 with Navy for Maintenance, Repair or Alteration of Real Property -- Other Non-Building Facilities. Signed on 2005-05-04. Completion date: 2005-10-26.
$332,992 with Navy for Maintenance, Repair or Alteration of Real Property -- Miscellaneous Buildings. Signed on 2006-06-20. Effective on 2006-06-19. Completion date: 2006-07-18.
INSTRUCTIONAL SCIENCE & DEVELO (14117 PERDIDO KEY DRIVE; small business) : $4,965,166 in 11 contractsfrom 2000 to 2002
Contracts for Services -- Applied Research and Exploratory Development (R&D), ADPE System Configuration, Services -- Basic Research (R&D), Training/Curriculum Development by Navy Signed by year:2000: $1,064,889; 2001: $3,700,387; 2002: $199,890; 2003: $0; 2004: $0; 2005: $0; 2006: $0.
Biggest contracts:
$3,115,606 with Navy for Services -- Applied Research and Exploratory Development (R&D). Signed on 2001-01-25. Completion date: 2005-01-25.
$845,798 with Navy for ADPE System Configuration. Signed on 2000-01-31. Completion date: 2001-04-08.
$315,000 with Navy for Services -- Applied Research and Exploratory Development (R&D). Signed on 2001-06-29. Completion date: 2005-02-05.
$199,000 with Navy for Services -- Basic Research (R&D). Signed on 2001-09-25. Completion date: 2002-09-25.
WELLS DAIRY, INC (1406 CACOA LANE) : $4,408,297 in 23 contractsfrom 1999 to 2005
Contracts for Food Items For Resale, Non-Food Items For Resale by Defense Commissary Agency, Department of Defense Signed by year:2000: $0; 2001: $0; 2002: $0; 2003: $0; 2004: $979,304; 2005: $3,313,776; 2006: $0.
Biggest contracts:
$1,885,379 with Defense Commissary Agency for Food Items For Resale. Signed on 2005-04-01. Completion date: 2005-09-30.
$836,345, same as above.Signed on 2004-10-01. Completion date: 2005-02-28.
$740,445 with Defense Commissary Agency for Non-Food Items For Resale. Signed on 2005-10-01. Completion date: 2005-12-31.
$218,338 with Defense Commissary Agency for Food Items For Resale. Signed on 2005-01-01. Completion date: 2005-03-31.
PATTI SHIPYARDS INC (306 S PINEWOOD LN; small business) : $1,308,112 in 6 contractsfrom 1999 to 2001
Contracts for Barges & Lighters Special Purpose, Barges And Lighters, Cargo, Construction of Structures and Facilities -- Sewage and Waste Facilities by U.S. Army Corps of Engineers - civil program financing only Signed by year:2000: $1,012,982; 2001: $175,850; 2002: $0; 2003: $0; 2004: $0; 2005: $0; 2006: $0.
Biggest contracts:
$434,404 with U.S. Army Corps of Engineers - civil program financing only for Barges & Lighters Special Purpose. Signed on 2000-03-20. Completion date: 1999-01-11.
$270,579 with U.S. Army Corps of Engineers - civil program financing only for Barges And Lighters, Cargo. Signed on 2000-09-29. Completion date: 2001-02-28.
$268,059, same as above.Signed on 2000-08-31. Completion date: 1999-07-30.
$175,850, same as above.Signed on 2001-06-04. Completion date: 2001-03-30.
MSR INDUSTRIES (311 FLANNAN RD STE A100; small business) : $862,815 in 4 contractsfrom 2004 to 2005
$840,750 with Army for Individual Equipment. Signed on 2005-04-13. Completion date: 2005-05-25.
$15,045, same as above.Signed on 2004-11-17. Completion date: 2004-11-19.
$3,540, same as above.Signed on 2005-03-23. Completion date: 2005-03-28.
$3,480, same as above.Signed on 2005-02-07. Completion date: 2005-02-08.
HERDT CONSULTING, INC (10330 FOGGY BOTTOM ROAD; small business) : $627,960 in 11 contractsfrom 2004 to 2005
Contracts for Education Services, Logistics Support Services, Computer Aided Design/Computer Aided Manufacturing (CAD/CAM) Services, Operation of Government-Owned Facilities -- Other Administrative Facilities and Service Buildings, and moreby Navy Signed by year:2000: $0; 2001: $0; 2002: $0; 2003: $0; 2004: $150,218; 2005: $477,742; 2006: $0.
Biggest contracts:
$313,086 with Navy for Education Services. Taking place in VA. Signed on 2005-04-26. Completion date: 2005-09-30.
$114,946 with Navy for Logistics Support Services. Taking place in RI. Signed on 2005-09-23. Completion date: 2006-09-25.
$24,855 with Navy for Computer Aided Design/Computer Aided Manufacturing (CAD/CAM) Services. Signed on 2005-02-23. Completion date: 2005-03-31.
$24,855, same as above.Signed on 2005-01-28. Completion date: 2005-02-28.
JOHN W HARGRAVE DDS (8 STAR LAKE DRIVE; small business) : $584,531 in 8 contractsfrom 2000 to 2006
Contracts for Dentistry Services by Navy Signed by year:2000: $91,175; 2001: $93,921; 2002: $64,441; 2003: $130,314; 2004: $98,673; 2005: $99,288; 2006: $6,719.
Biggest contracts:
$99,288 with Navy for Dentistry Services. Signed on 2005-10-20. Completion date: 2005-09-30.
$98,673, same as above.Signed on 2004-10-26. Completion date: 2005-09-30.
$98,071, same as above.Signed on 2003-10-01. Completion date: 2004-09-30.
$93,921, same as above.Signed on 2001-10-01. Completion date: 2002-09-30.
HERTZ EQUIPMENT RENTAL CORP (3838 W NAVY BLVD) : $353,732 in 23 contractsfrom 2003 to 2006
Contracts for Lease or Rental of Equipment -- Miscellaneous, Lease or Rental of Equipment -- Construction, Mining, Excavating, and Highway Maintenance Equipment, Lease or Rental of Equipment -- Ground Effect Vehicles, Motor Vehicles, Trailers, and Cycles by Navy, Air Force Signed by year:2000: $0; 2001: $0; 2002: $0; 2003: $265,037; 2004: $88,695; 2005: $0; 2006: $0.
Biggest contracts:
$105,300 with Navy for Lease or Rental of Equipment -- Miscellaneous. Signed on 2003-08-15. Completion date: 2003-12-19.
$61,551, same as above.Signed on 2003-09-08. Completion date: 2003-11-10.
$35,000 with Navy for Lease or Rental of Equipment -- Construction, Mining, Excavating, and Highway Maintenance Equipment. Signed on 2003-11-19. Completion date: 2003-12-19.
$32,475 with Navy for Lease or Rental of Equipment -- Miscellaneous. Taking place in MS. Signed on 2003-04-20. Completion date: 2003-09-06.
JEFFREY P WETZEL, DDS (5143 CHOCTAW AVE; small business) : $319,561 in 6 contractsfrom 2001 to 2005
Contracts for Dentistry Services by Navy Signed by year:2000: $0; 2001: $84,960; 2002: $87,900; 2003: $91,352; 2004: $94,199; 2005: -$38,850; 2006: $0.
Biggest contracts:
$94,199 with Navy for Dentistry Services. Signed on 2004-10-26. Completion date: 2005-09-30.
$91,352, same as above.Signed on 2003-10-01. Completion date: 2004-09-30.
$87,900, same as above.Signed on 2002-10-01. Completion date: 2003-09-30.
$84,960, same as above.Signed on 2001-10-01. Completion date: 2002-09-30.
ROBERT L PENTECOST DDS (7709 GRUNDY ST,; small business) : $304,036 in 6 contractsfrom 2001 to 2005
Contracts for Dentistry Services by Navy Signed by year:2000: $0; 2001: $88,896; 2002: $92,508; 2003: $93,472; 2004: $95,232; 2005: -$66,072; 2006: $0.
Biggest contracts:
$95,232 with Navy for Dentistry Services. Signed on 2004-10-26. Completion date: 2005-09-30.
$93,472, same as above.Signed on 2003-10-01. Completion date: 2004-09-30.
$91,008, same as above.Signed on 2002-10-01. Completion date: 2003-09-30.
$88,896, same as above.Signed on 2001-10-01. Completion date: 2002-09-30.
Top industries in this zip code by the number of employees in 2005:
2002 - 2018 National Fire Incident Reporting System (NFIRS) incidents
Based on the data from the years 2002 - 2018 the average number of fire incidents per year is 126. The highest number of reported fire incidents - 274 took place in 2006, and the least - 0 in 2005. The data has a growing trend.
When looking into fire subcategories, the most reports belonged to: Outside Fires (54.7%), and Structure Fires (22.6%).
Fire incident types reported to NFIRS in Zip Code 32507


 Nearest zip codes: 32506, 32508, 32511, 36549, 32509, 32526.


 Based on the data from the years 2002 - 2018 the average number of fire incidents per year is 126. The highest number of reported fire incidents - 274 took place in 2006, and the least - 0 in 2005. The data has a growing trend.
 When looking into fire subcategories, the most reports belonged to: Outside Fires (54.7%), and Structure Fires (22.6%).