Estimated zip code population in 2022: 10,842 Zip code population in 2010: 11,432 Zip code population in 2000: 9,034
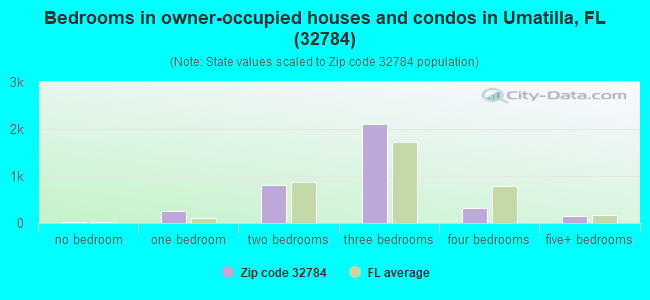
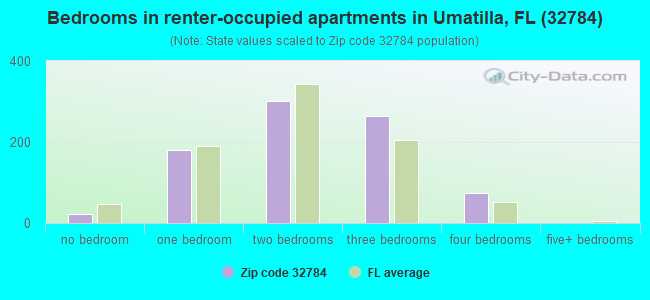
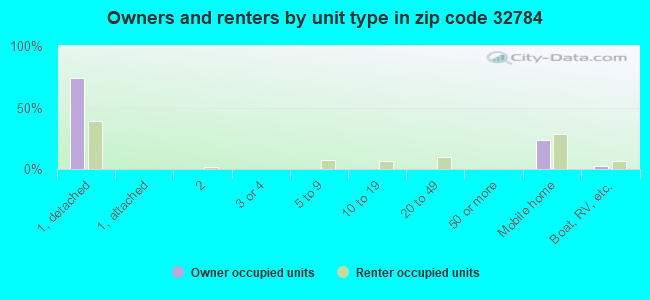
Houses and condos: 5,467 Renter-occupied apartments: 845
% of renters here:
19%
State:
33%
March 2022 cost of living index in zip code 32784: 82.1 (low, U.S. average is 100)
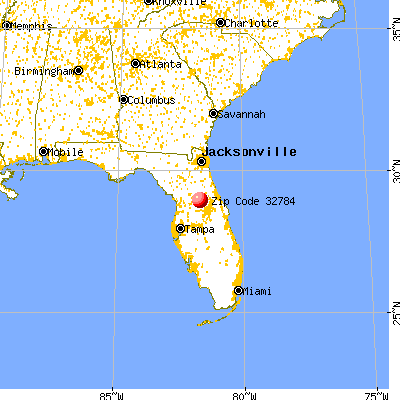
Land area: 90.7 sq. mi. Water area: 13.8 sq. mi.
Population density: 120 people per square mile
(very low).
OSM Map
General Map
Google Map
MSN Map
OSM Map
General Map
Google Map
MSN Map
OSM Map
General Map
Google Map
MSN Map
OSM Map
General Map
Google Map
MSN Map
Please wait while loading the map...
Real estate property taxes paid for housing units in 2022:
This zip code:
0.6% ($1,636)
Florida:
0.7% ($2,529)
Median real estate property taxes paid for housing units with mortgages in 2022: $1,836 (0.6%) Median real estate property taxes paid for housing units with no mortgage in 2022: $1,223 (0.8%)
Averages for the 2020 tax year for zip code 32784, filed in 2021:
Average Adjusted Gross Income (AGI) in 2020: $56,367 (Individual Income Tax Returns)
Here:
$56,367
State:
$82,200
Salary/wage: $45,003 (reported on 80.0% of returns)
Here:
$45,003
State:
$58,347
(% of AGI for various income ranges: 1233.8% for AGIs below $25k, 3665.9% for AGIs $25k-50k, 6436.5% for AGIs $50k-75k, 9379.0% for AGIs $75k-100k, 15430.3% for AGIs $100k-200k, 69766.7% for AGIs over 200k)
Taxable interest for individuals: $1,465 (reported on 20.2% of returns)
This zip code:
$1,465
Florida:
$4,272
(% of AGI for various income ranges: 11.0% for AGIs below $25k, 24.7% for AGIs $25k-50k, 40.9% for AGIs $50k-75k, 54.7% for AGIs $75k-100k, 70.0% for AGIs $100k-200k, 1756.7% for AGIs over 200k)
Ordinary dividends: $6,936 (reported on 12.5% of returns)
Here:
$6,936
State:
$15,863
(% of AGI for various income ranges: 11.6% for AGIs below $25k, 31.0% for AGIs $25k-50k, 117.3% for AGIs $50k-75k, 153.7% for AGIs $75k-100k, 411.0% for AGIs $100k-200k, 5903.3% for AGIs over 200k)
Net capital gain/loss in AGI: +$32,376 (reported on 11.6% of returns)
Here:
+$32,376
State:
+$62,983
(% of AGI for various income ranges: 8.4% for AGIs below $25k, 26.4% for AGIs $25k-50k, 63.5% for AGIs $50k-75k, 150.0% for AGIs $75k-100k, 762.3% for AGIs $100k-200k, 55173.3% for AGIs over 200k)
Profit/loss from business: +$7,565 (reported on 14.4% of returns)
Here:
+$7,565
State:
+$9,719
(% of AGI for various income ranges: 163.7% for AGIs below $25k, 80.0% for AGIs $25k-50k, 112.5% for AGIs $50k-75k, 230.0% for AGIs $75k-100k, 361.0% for AGIs $100k-200k)
Taxable individual retirement arrangement distribution: $23,841 (reported on 7.3% of returns)
32784:
$23,841
Florida:
$24,823
(% of AGI for various income ranges: 42.7% for AGIs below $25k, 85.3% for AGIs $25k-50k, 163.6% for AGIs $50k-75k, 343.7% for AGIs $75k-100k, 909.0% for AGIs $100k-200k, 9993.3% for AGIs over 200k)
Total itemized deductions: $33,852 (reported on 3.9% of returns)
Here:
$33,852
State:
$45,393
(% of AGI for various income ranges: 123.6% for AGIs $25k-50k, 128.4% for AGIs $50k-75k, 251.3% for AGIs $75k-100k, 837.7% for AGIs $100k-200k, 5673.3% for AGIs over 200k)
Charity contributions: $11,819 (reported on 3.0% of returns)
Here:
$11,819
State:
$20,178
(% of AGI for various income ranges: 20.1% for AGIs $25k-50k, 41.3% for AGIs $75k-100k, 277.7% for AGIs $100k-200k, 2336.7% for AGIs over 200k)
Taxes paid: $5,371 (reported on 3.9% of returns)
32784:
$5,371
State:
$6,967
(% of AGI for various income ranges: 14.1% for AGIs $25k-50k, 17.5% for AGIs $50k-75k, 56.3% for AGIs $75k-100k, 129.3% for AGIs $100k-200k, 1036.7% for AGIs over 200k)
Earned income credit: $2,476 (reported on 22.3% of returns)
Here:
$2,476
State:
$2,306
(% of AGI for various income ranges: 131.4% for AGIs below $25k, 80.8% for AGIs $25k-50k)
Percentage of individuals using paid preparers for their 2020 taxes: 90.8%
Here:
91%
State:
92%
(% for various income ranges: 89.2% for AGIs below $25k, 91.7% for AGIs $25k-50k, 92.0% for AGIs $50k-75k, 93.3% for AGIs $75k-100k, 90.4% for AGIs $100k-200k, 92.9% for AGIs over 200k)
Averages for the 2012 tax year for zip code 32784, filed in 2013:
Average Adjusted Gross Income (AGI) in 2012: $40,759 (Individual Income Tax Returns)
Here:
$40,759
State:
$60,316
Salary/wage: $34,989 (reported on 81.0% of returns)
Here:
$34,989
State:
$45,277
(% of AGI for various income ranges: 75.4% for AGIs below $25k, 80.1% for AGIs $25k-50k, 75.6% for AGIs $50k-75k, 70.1% for AGIs $75k-100k, 65.1% for AGIs $100k-200k, 38.1% for AGIs over 200k)
Taxable interest for individuals: $1,652 (reported on 22.9% of returns)
This zip code:
$1,652
Florida:
$3,587
(% of AGI for various income ranges: 1.2% for AGIs below $25k, 0.6% for AGIs $25k-50k, 1.1% for AGIs $50k-75k, 0.5% for AGIs $75k-100k, 0.8% for AGIs $100k-200k, 1.5% for AGIs over 200k)
Ordinary dividends: $4,197 (reported on 15.0% of returns)
Here:
$4,197
State:
$12,831
(% of AGI for various income ranges: 1.3% for AGIs below $25k, 1.1% for AGIs $25k-50k, 1.8% for AGIs $50k-75k, 1.4% for AGIs $75k-100k, 1.9% for AGIs $100k-200k, 2.0% for AGIs over 200k)
Net capital gain/loss in AGI: +$4,400 (reported on 11.1% of returns)
Here:
+$4,400
State:
+$33,493
(% of AGI for various income ranges: 0.4% for AGIs $50k-75k, 1.4% for AGIs $75k-100k, 1.5% for AGIs $100k-200k, 6.1% for AGIs over 200k)
Profit/loss from business: +$8,630 (reported on 15.9% of returns)
Here:
+$8,630
State:
+$10,012
(% of AGI for various income ranges: 9.9% for AGIs below $25k, 1.8% for AGIs $25k-50k, 2.3% for AGIs $50k-75k, 2.7% for AGIs $75k-100k, 3.7% for AGIs $100k-200k)
Taxable individual retirement arrangement distribution: $15,854 (reported on 8.4% of returns)
32784:
$15,854
Florida:
$21,544
(% of AGI for various income ranges: 2.0% for AGIs below $25k, 2.6% for AGIs $25k-50k, 2.5% for AGIs $50k-75k, 2.9% for AGIs $75k-100k, 8.3% for AGIs $100k-200k)
Total itemized deductions: $21,430 (26% of AGI, reported on 19.5% of returns)
Here:
$21,430
State:
$25,533
Here:
25.7% of AGI
State:
18.0% of AGI
(% of AGI for various income ranges: 5.0% for AGIs below $25k, 9.2% for AGIs $25k-50k, 9.7% for AGIs $50k-75k, 11.0% for AGIs $75k-100k, 12.3% for AGIs $100k-200k, 15.8% for AGIs over 200k)
Charity contributions: $4,707 (reported on 13.8% of returns)
Here:
$4,707
State:
$5,698
(% of AGI for various income ranges: 0.2% for AGIs below $25k, 0.8% for AGIs $25k-50k, 1.6% for AGIs $50k-75k, 1.9% for AGIs $75k-100k, 2.5% for AGIs $100k-200k, 3.1% for AGIs over 200k)
Taxes paid: $3,949 (reported on 18.8% of returns)
32784:
$3,949
State:
$6,203
(% of AGI for various income ranges: 0.9% for AGIs below $25k, 1.2% for AGIs $25k-50k, 1.5% for AGIs $50k-75k, 2.0% for AGIs $75k-100k, 2.8% for AGIs $100k-200k, 2.8% for AGIs over 200k)
Earned income credit: $2,478 (reported on 27.7% of returns)
Here:
$2,478
State:
$2,372
(% of AGI for various income ranges: 9.1% for AGIs below $25k, 1.5% for AGIs $25k-50k)
Percentage of individuals using paid preparers for their 2012 taxes: 48.5%
Here:
49%
State:
54%
(% for various income ranges: 45.8% for AGIs below $25k, 48.6% for AGIs $25k-50k, 51.8% for AGIs $50k-75k, 53.1% for AGIs $75k-100k, 52.0% for AGIs $100k-200k, 80.0% for AGIs over 200k)
Averages for the 2004 tax year for zip code 32784, filed in 2005:
Average Adjusted Gross Income (AGI) in 2004: $36,687 (Individual Income Tax Returns)
Here:
$36,687
State:
$50,523
Salary/wage: $32,115 (reported on 83.0% of returns)
Here:
$32,115
State:
$39,563
(% of AGI for various income ranges: 130.4% for AGIs below $10k, 79.3% for AGIs $10k-25k, 81.0% for AGIs $25k-50k, 78.7% for AGIs $50k-75k, 76.5% for AGIs $75k-100k, 49.4% for AGIs over 100k)
Taxable interest for individuals: $1,655 (reported on 31.8% of returns)
This zip code:
$1,655
Florida:
$3,211
(% of AGI for various income ranges: 5.5% for AGIs below $10k, 1.7% for AGIs $10k-25k, 1.2% for AGIs $25k-50k, 1.3% for AGIs $50k-75k, 1.7% for AGIs $75k-100k, 1.2% for AGIs over 100k)
Taxable dividends: $2,968 (reported on 16.8% of returns)
Here:
$2,968
State:
$6,129
(% of AGI for various income ranges: 5.2% for AGIs below $10k, 1.1% for AGIs $10k-25k, 1.2% for AGIs $25k-50k, 1.0% for AGIs $50k-75k, 0.8% for AGIs $75k-100k, 1.9% for AGIs over 100k)
Net capital gain/loss: +$14,172 (reported on 14.2% of returns)
Here:
+$14,172
State:
+$27,205
(% of AGI for various income ranges: -1.5% for AGIs below $10k, 0.0% for AGIs $10k-25k, 0.7% for AGIs $25k-50k, 1.8% for AGIs $50k-75k, 2.8% for AGIs $75k-100k, 18.2% for AGIs over 100k)
Profit/loss from business: +$8,310 (reported on 15.0% of returns)
Here:
+$8,310
State:
+$10,634
(% of AGI for various income ranges: -4.3% for AGIs below $10k, 7.0% for AGIs $10k-25k, 2.9% for AGIs $25k-50k, 3.0% for AGIs $50k-75k, 2.0% for AGIs $75k-100k, 3.6% for AGIs over 100k)
IRA payment deduction: $3,520 (reported on 2.3% of returns)
32784:
$3,520
Florida:
$3,082
(% of AGI for various income ranges: 0.3% for AGIs $10k-25k, 0.2% for AGIs $25k-50k, 0.2% for AGIs $50k-75k, 0.3% for AGIs $75k-100k, 0.2% for AGIs over 100k)
Total itemized deductions: $16,719 (23% of AGI, reported on 20.8% of returns)
Here:
$16,719
State:
$20,370
Here:
23.0% of AGI
State:
20.7% of AGI
(% of AGI for various income ranges: 5.9% for AGIs below $10k, 6.6% for AGIs $10k-25k, 8.0% for AGIs $25k-50k, 9.8% for AGIs $50k-75k, 12.0% for AGIs $75k-100k, 11.2% for AGIs over 100k)
Charity contributions deductions: $3,495 (4% of AGI, reported on 15.8% of returns)
Here:
$3,495
State:
$4,064
Here:
4.4% of AGI
State:
3.8% of AGI
(% of AGI for various income ranges: 0.8% for AGIs $10k-25k, 0.7% for AGIs $25k-50k, 1.4% for AGIs $50k-75k, 2.0% for AGIs $75k-100k, 2.6% for AGIs over 100k)
Total tax: $5,042 (reported on 70.1% of returns)
32784:
$5,042
State:
$9,431
(% of AGI for various income ranges: 4.5% for AGIs below $10k, 3.9% for AGIs $10k-25k, 6.2% for AGIs $25k-50k, 8.2% for AGIs $50k-75k, 10.4% for AGIs $75k-100k, 17.4% for AGIs over 100k)
Earned income credit: $1,851 (reported on 21.8% of returns)
Here:
$1,851
State:
$1,808
Percentage of individuals using paid preparers for their 2004 taxes: 58.2%
Here:
58%
State:
60%
(% for various income ranges: 51.1% for AGIs below $10k, 61.3% for AGIs $10k-25k, 57.7% for AGIs $25k-50k, 58.7% for AGIs $50k-75k, 54.8% for AGIs $75k-100k, 75.3% for AGIs over 100k)
Household received Food Stamps/SNAP in the past 12 months: 747 Household did not receive Food Stamps/SNAP in the past 12 months: 3,766
Women who had a birth in the past 12 months: 99 (104 now married, 0 unmarried) Women who did not have a birth in the past 12 months: 2,193 (1,193 now married, 1,001 unmarried)
Housing units in zip code 32784 with a mortgage: 2,016 (152 second mortgage, 125 both second mortgage and home equity loan) Houses without a mortgage: 53
Median monthly owner costs for units with a mortgage: $1,447 Median monthly owner costs for units without a mortgage: $415
Residents with income below the poverty level in 2022:
This zip code:
10.3%
Whole state:
12.7%
Residents with income below 50% of the poverty level in 2022:
This zip code:
8.6%
Whole state:
6.6%
Median number of rooms in houses and condos:
Here:
5.9
State:
5.9
Median number of rooms in apartments:
Here:
4.5
State:
4.2
Notable locations in this zip code not listed on our city pages
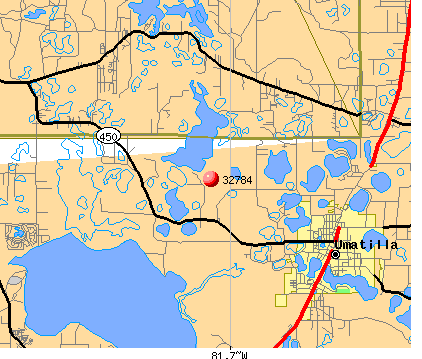
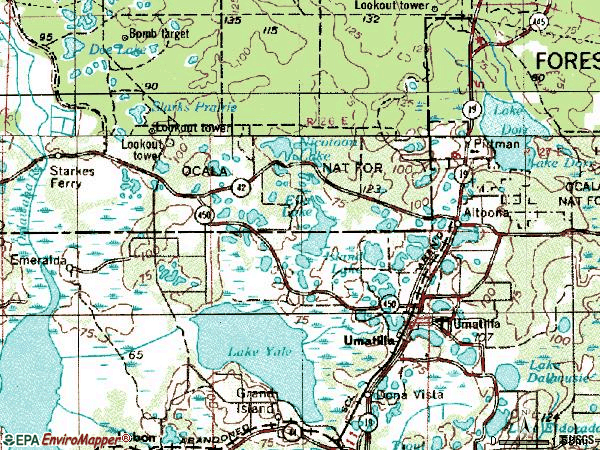
Notable locations in zip code 32784: Del - Aire Country Club (A), Umatilla High School Football Stadium (B), Big Scrub Camp (C), Big Trees Campsites (D), Doe Lake Camp (E), Olde Mill Stream Recreational Vehicle Park (F), Doe Lake Campground (G), Doe Lake Boat Ramp (H), Big Bass Lake Recreation Site (I), Island Ponds Recreation Site (J), Nicatoon Lake Recreation Site (K), Umatilla Fire Department (L), Southside Umatilla Volunteer Fire Department Station 19 (M), Lake County Fire Station Supply (N), Umatilla Police Department (O), Marion County Fire Rescue Station 6 South Forest (P), Umatilla Substation-Progress Energy (Q), Marion County Fire Rescue Station 29 Rolling Woods (R), Umatilla City Hall (S), Umatilla Library (T). Display/hide their locations on the map
Churches in zip code 32784 include: Umatilla Church of God (A), New Hope Missionary Baptist Church of Lake County (B), Liberty Lighthouse Church of God (C), Emmanuel Church (D), First Baptist Church of Umatilla (E), Presbyterian Church USA (F), Jerusalem Worship Center (G), First United Methodist Church of Umatilla (H), Sandy Acres Baptist Church (I). Display/hide their locations on the map
Lakes and swamps: Lake Cooley (A), Crescent Lake (B), Dinners Pond (C), Doe Lake (D), East Lake (E), Ella Lake (F), Lake Elza (G), Lake Enola (H). Display/hide their locations on the map
In group quarters: 30 (-1 institutionalized population)
Size of family households: 1,390 2-persons, 674 3-persons, 507 4-persons, 309 5-persons, 63 6-persons, 54 7-or-more-persons
Size of nonfamily households: 1,305 1-person, 210 2-persons
1,170 married couples with children.
275 single-parent households (113 men, 162 women).
93.9% of residents of 32784 zip code speak English at home.
3.8% of residents speak Spanish at home (60% very well, 12% well, 28% not well, 1% not at all).
1.5% of residents speak other Indo-European language at home (100% very well).
0.1% of residents speak Asian or Pacific Island language at home (100% well).
0.3% of residents speak other language at home (100% very well).
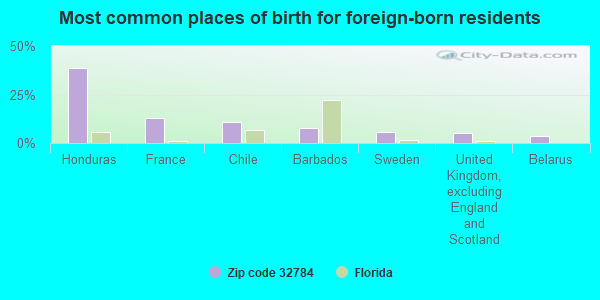
Foreign born population: 355 (3.3%) (77.4% of them are naturalized citizens)
This zip code:
3.3%
Whole state:
21.7%
39%Honduras
13%France
11%Chile
8%Barbados
6%Sweden
5%United Kingdom, excluding England and Scotland
4%Belarus
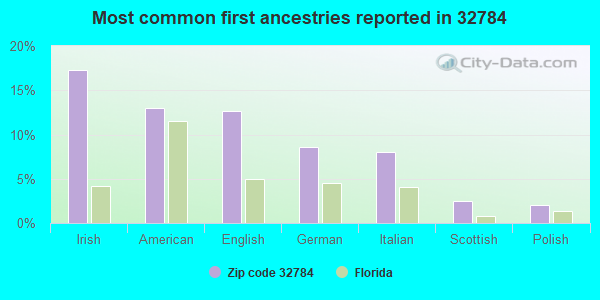
17%Irish
13%American
13%English
9%German
8%Italian
2%Scottish
2%Polish
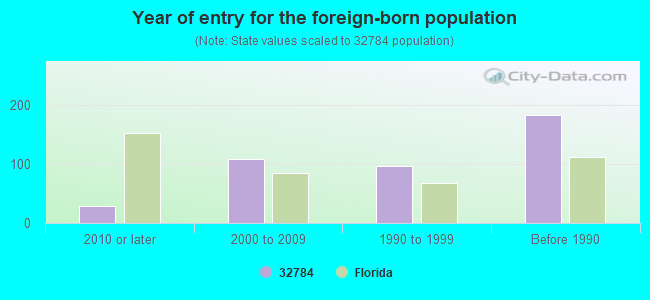
Year of entry for the foreign-born population
292010 or later
1082000 to 2009
971990 to 1999
183Before 1990
Major facilities with environmental interests located in this zip code:
LAKE COGEN LTD (39001 GOLDEN GEM DRIVE in UMATILLA, FL)
AIR MAJOR (AIRS/AFS) AIR PROGRAM (Clean Air Markets Division Business System) STATE MASTER (FDM) - WAFR-FLA010631, POWER PLANT WASTEWATER PROGRAM, WAFR-FLR05C125, NPDES STORMWATER PROGRAM, NPDES STORMWATER PERMIT CRITERIA AND HAZARDOUS AIR POLLUTANT INVENTORY (Inventory of air pollution sources) National Pollutant Discharge Elimination System NON-MAJOR (Tracking pollutant discharge elimination systems) - permit AIR MAJOR ("Best Available" air pollution technologies tracking) (Resource Conservation and Recovery Act (tracking hazardous waste)) TRI REPORTER (Tracking of toxic chemicals releasing facilities) Business SIC classification: ELECTRIC SERVICES; ELECTRIC AND OTHER SERVICES COMBINED Organizations: LAKE COGENERATION, AQUILA, NATION S BANK OF FLORIDA, LAKE COGENERATION (CONTACT/APPLICANT)
, PASCO COGENERATION (CONTACT/APPLICANT)
, LAKE COGENERATION (CONTACT/FACILITY)
, LAKE COGEN LTD. (CONTACT/FACILITY)
, LAKE COGEN LTD. C/O GPU INTERNATIONAL, INC. (CONTACT/OPERATOR)
, KEITH TROSTLE, ASSET MGR (CONTACT/OWNER)
, JIM MILLER (CONTACT/OWNER)
, LAKE COGENERATION (CONTACT/PERMIT)
, LAKE COGEN LTD. (CONTACT/PERMIT)
, AQUILA (CONTACT/PERMIT)
, LAKE COGEN, LTD. C/O AQUILA, INC. (CONTACT/PERMIT)
, PASCO COGENERATION (CONTACT/PERMIT)
, AEP PRO SERV (ENGINEER)
Alternative names: LAKE COGEN LIMITED, LAKE COGEN RECYCLE SYSTEM, LAKE COGENERATION, LAKE COGENERATION LIMITED PARTNERSHIP, LAKE GOGENERATION LTD. PTNR., LAKE INVESTMENT, L.P., LAKE INVESTMENT lp
ALEE ACADEMY/ACER NIGHT PROGRAM ( in UMATILLA, FL)
(National Center for Education Statistics) - STATE ID-9021 Organizations: LAKE COUNTY SCHOOL DISTRICT (SCHOOL DISTRICT)
HARRY-ANNA SCHOOL (INACTIVE 11/99) (305 EAST LAKE STREET in UMATILLA, FL)
(National Center for Education Statistics) - STATE ID-0121 Organizations: LAKE COUNTY SCHOOL DISTRICT (SCHOOL DISTRICT)
MILL & RESURFACE SR 19 IN LAKE (SR 19 FROM BULLDOG LANE TO BEN in UMATILLA, FL)
National Pollutant Discharge Elimination System NON-MAJOR (Tracking pollutant discharge elimination systems) - permit Organizations: WILLIAM BACHSCHMIDT (CONTACT/OWNER)
AL HOFMANN RACING (17818 WILLIS MCCALL RD in UMATILLA, FL)
(Resource Conservation and Recovery Act (tracking hazardous waste)) Organizations: AL HOFFMAN (CONTACT/OWNER)
KERRS TRUCKS AND CARS (507 N CENTRAL AVE in UMATILLA, FL)
(Resource Conservation and Recovery Act (tracking hazardous waste)) Business NAICS classification: OTHER AUTOMOTIVE MECHANICAL AND ELECTRICAL REPAIR AND MAINTENANCE. Organizations: ELLEN MURPHY (CONTACT/OWNER)
DELCO OIL INC FINA EXPRESS MART 501 (501 S CENTRAL AVE in UMATILLA, FL)
(Resource Conservation and Recovery Act (tracking hazardous waste)) Organizations: DELCO OIL CO (CONTACT/OWNER)
COOKS PAINT & BODY SHOP (21 WAFFORD ST in UMATILLA, FL)
(Resource Conservation and Recovery Act (tracking hazardous waste)) Organizations: LARRY COOK, OWNER (CONTACT/OWNER)
SHELL STATION (RT 2, BOX 802, HWY 195 in UMATILLA, FL)
National Pollutant Discharge Elimination System NON-MAJOR (Tracking pollutant discharge elimination systems) - permit Alternative names: RUST ENVIR & INFRASTRUCT INC, SHELL UMATILLA
SPEEDWAY #6577 (IW) (38732 S HWY 19 in UMATILLA, FL)
National Pollutant Discharge Elimination System NON-MAJOR (Tracking pollutant discharge elimination systems) - permit Business SIC classification: GASOLINE SERVICE STATIONS
JOHNS CAR CARE (501 N CENTRAL AVE in UMATILLA, FL)
Small Quantity Generators, between 100 kg and 1000 kg of hazardous waste/month (Resource Conservation and Recovery Act (tracking hazardous waste)) Business NAICS classification: GENERAL AUTOMOTIVE REPAIR. Organizations: ELLEN MURPHY (CONTACT/OWNER)
MERCER PRODUCTS COMPANY INC (37325 US HWY 19 in DONA VISTA, FL)
Small Quantity Generators, between 100 kg and 1000 kg of hazardous waste/month (Resource Conservation and Recovery Act (tracking hazardous waste)) Organizations: BURKE FLOORING PRODUCTS (CONTACT/OWNER)
MERCER PRODUCTS COMPANY INCORPORATED (37235 RT. 19 in UMATILLA, FL)
CRITERIA AND HAZARDOUS AIR POLLUTANT INVENTORY (Inventory of air pollution sources) TRI REPORTER (Tracking of toxic chemicals releasing facilities) Business SIC classification: UNSUPPORTED PLASTICS PROFILE SHAPES Business NAICS classification: UNLAMINATED PLASTICS PROFILE SHAPE MANUFACTURING.
Housing units lacking complete plumbing facilities: 5.8% Housing units lacking complete kitchen facilities: 5.3%
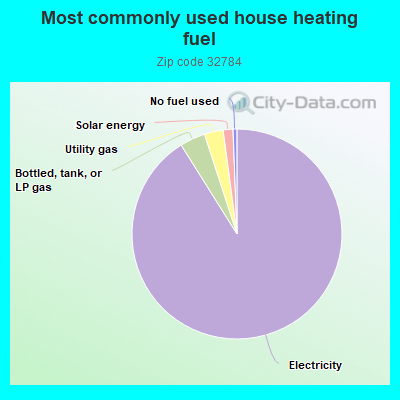
90.9%Electricity
3.9%Bottled, tank, or LP gas
2.9%Utility gas
1.5%Solar energy
0.6%No fuel used
Population in 1990: 7,866. Population change in the 1990s: +1,168 (+14.8%).
Place of birth for U.S.-born residents:
This state: 5,690
Northeast: 1,493
Midwest: 1,718
South: 1,083
West: 321
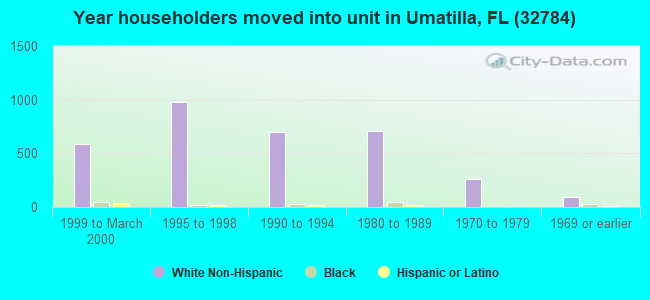
58% of the 32784 zip code residents lived in the same house 5 years ago. Out of people who lived in different houses, 46% lived in this county. Out of people who lived in different counties, 50% lived in Florida.
89% of the 32784 zip code residents lived in the same house 1 year ago. Out of people who lived in different houses, 47% moved from this county. Out of people who lived in different houses, 25% moved from different county within same state. Out of people who lived in different houses, 24% moved from different state. Out of people who lived in different houses, 2% moved from abroad.
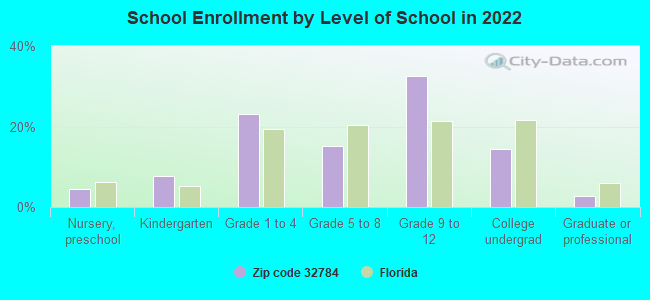
Private vs. public school enrollment:
Students in private schools in grades 1 to 8 (elementary and middle school): 16
Here:
2.6%
Florida:
15.8%
Students in private schools in grades 9 to 12 (high school): 21
Here:
4.1%
Florida:
12.9%
Students in private undergraduate colleges: 43
Here:
18.6%
Florida:
23.6%
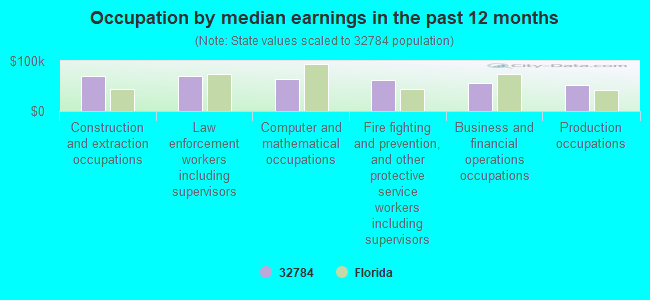
Occupation by median earnings in the past 12 months ($)
69,923Construction and extraction occupations
69,437Law enforcement workers including supervisors
63,493Computer and mathematical occupations
61,177Fire fighting and prevention, and other protective service workers including supervisors
55,931Business and financial operations occupations
51,469Production occupations
Companies with federal contracts located in this zip code:
FARYNA GROVE CARE AND HARVESTI (465 E COLLINS ST in UMATILLA, FL; small business) 30 employees, $1300000 revenue. : $19,500 in 3 contractsin 2002
$13,500 with Agricultural Research Service for Maintenance, Repair or Alteration of Real Property -- Other Non-Building Facilities. Signed on 2002-09-15. Completion date: 2002-09-15.
$6,000 with Agricultural Research Service (disused code) for Maintenance, Repair or Alteration of Real Property -- Other Non-Building Facilities. Signed on 2002-09-15. Completion date: 2002-09-15.
$0 with Agricultural Research Service for Maintenance, Repair or Alteration of Real Property -- Other Non-Building Facilities. Signed on 2002-09-15. Completion date: 2002-09-15.
Top industries in this zip code by the number of employees in 2005:
Detailed PMIC statistics for the following Tracts:0006.03
, 0301.01
2002 - 2018 National Fire Incident Reporting System (NFIRS) incidents
Based on the data from the years 2002 - 2018 the average number of fire incidents per year is 79. The highest number of reported fire incidents - 159 took place in 2007, and the least - 25 in 2002. The data has an increasing trend.
When looking into fire subcategories, the most reports belonged to: Outside Fires (60.2%), and Structure Fires (23.8%).
Fire incident types reported to NFIRS in Zip Code 32784


 Nearest zip codes: 32735, 32702, 34788, 32726, 32195, 32159.


 Based on the data from the years 2002 - 2018 the average number of fire incidents per year is 79. The highest number of reported fire incidents - 159 took place in 2007, and the least - 25 in 2002. The data has an increasing trend.
 When looking into fire subcategories, the most reports belonged to: Outside Fires (60.2%), and Structure Fires (23.8%).