Estimated zip code population in 2022: 70,248 Zip code population in 2010: 53,029 Zip code population in 2000: 52,182
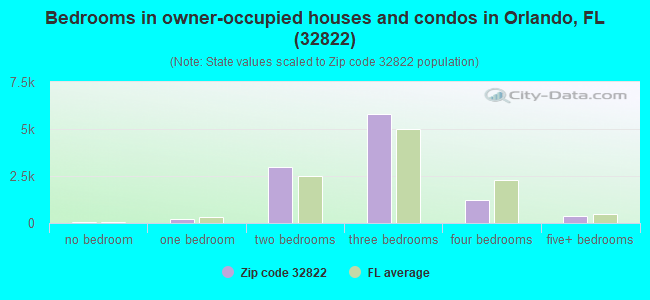
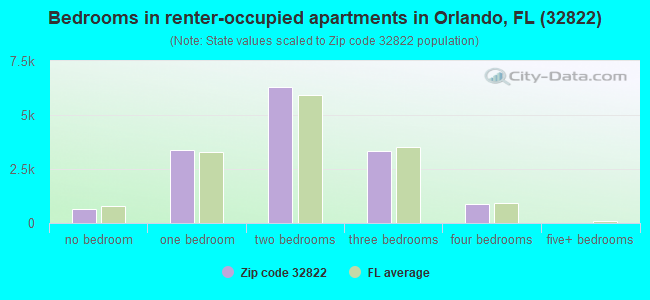
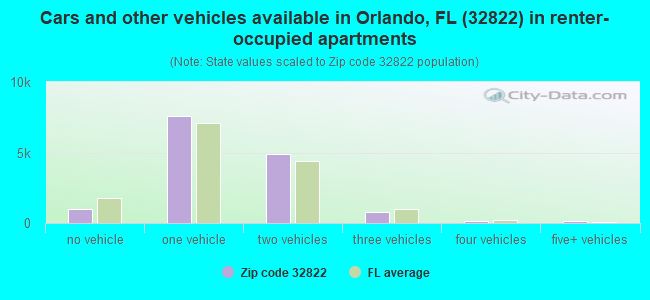
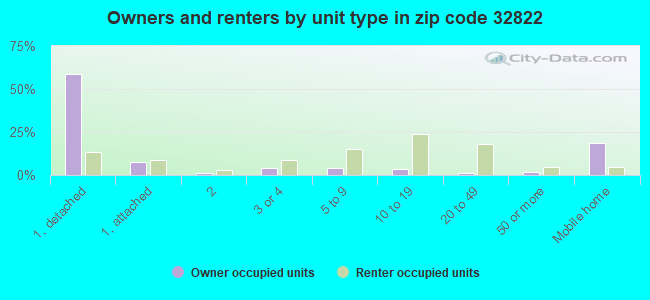
Houses and condos: 27,813 Renter-occupied apartments: 14,547
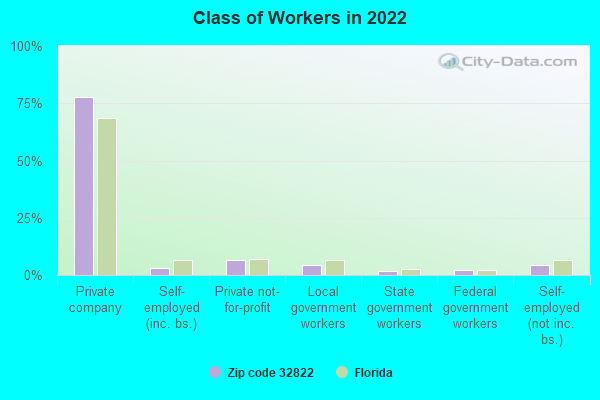
% of renters here:
58%
State:
33%
March 2022 cost of living index in zip code 32822: 92.0 (less than average, U.S. average is 100)
Land area: 13.3 sq. mi. Water area: 0.7 sq. mi.
Population density: 5,296 people per square mile
(average).
OSM Map
General Map
Google Map
MSN Map
OSM Map
General Map
Google Map
MSN Map
OSM Map
General Map
Google Map
MSN Map
OSM Map
General Map
Google Map
MSN Map
Please wait while loading the map...
Real estate property taxes paid for housing units in 2022:
This zip code:
0.6% ($1,535)
Florida:
0.7% ($2,529)
Median real estate property taxes paid for housing units with mortgages in 2022: $1,741 (0.6%) Median real estate property taxes paid for housing units with no mortgage in 2022: $1,126 (0.6%)
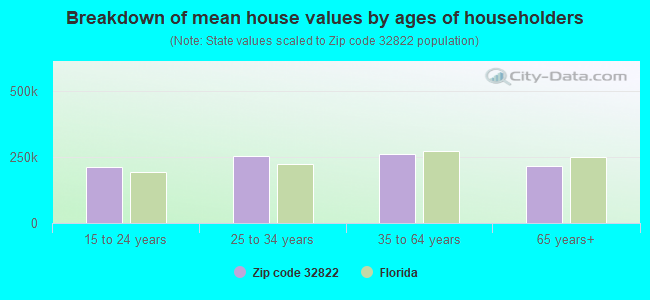
Estimated median house/condo value in 2022: $248,791
32822:
$248,791
Florida:
$354,100
According to our research of Florida and other state lists, there were 93 registered sex offenders living in 32822 zip code as of April 27, 2024. The ratio of all residents to sex offenders in zip code 32822 is 626 to 1. The ratio of registered sex offenders to all residents in this zip code is near the state average.
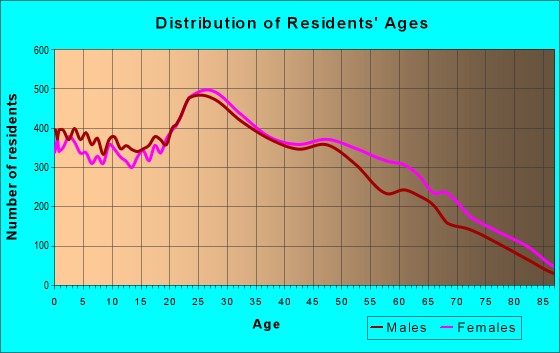
Median resident age:
This zip code:
37.8 years
Florida median age:
42.7 years
Average household size:
This zip code:
2.8 people
Florida:
2.5 people
Averages for the 2020 tax year for zip code 32822, filed in 2021:
Average Adjusted Gross Income (AGI) in 2020: $33,918 (Individual Income Tax Returns)
Here:
$33,918
State:
$82,200
Salary/wage: $31,624 (reported on 84.3% of returns)
Here:
$31,624
State:
$58,347
(% of AGI for various income ranges: 1211.9% for AGIs below $25k, 3570.3% for AGIs $25k-50k, 6697.4% for AGIs $50k-75k, 9873.0% for AGIs $75k-100k, 14802.9% for AGIs $100k-200k, 90730.0% for AGIs over 200k)
Taxable interest for individuals: $992 (reported on 9.0% of returns)
This zip code:
$992
Florida:
$4,272
(% of AGI for various income ranges: 2.7% for AGIs below $25k, 4.5% for AGIs $25k-50k, 14.2% for AGIs $50k-75k, 40.1% for AGIs $75k-100k, 57.1% for AGIs $100k-200k, 5125.0% for AGIs over 200k)
Ordinary dividends: $2,704 (reported on 5.0% of returns)
Here:
$2,704
State:
$15,863
(% of AGI for various income ranges: 3.6% for AGIs below $25k, 6.2% for AGIs $25k-50k, 25.1% for AGIs $50k-75k, 75.6% for AGIs $75k-100k, 179.3% for AGIs $100k-200k, 4470.0% for AGIs over 200k)
Net capital gain/loss in AGI: +$5,702 (reported on 5.0% of returns)
Here:
+$5,702
State:
+$62,983
(% of AGI for various income ranges: 2.0% for AGIs below $25k, 9.8% for AGIs $25k-50k, 33.8% for AGIs $50k-75k, 190.4% for AGIs $75k-100k, 346.6% for AGIs $100k-200k, 16120.0% for AGIs over 200k)
Profit/loss from business: +$4,532 (reported on 25.1% of returns)
Here:
+$4,532
State:
+$9,719
(% of AGI for various income ranges: 149.9% for AGIs below $25k, 78.6% for AGIs $25k-50k, 193.4% for AGIs $50k-75k, 208.9% for AGIs $75k-100k, 339.0% for AGIs $100k-200k, 6780.0% for AGIs over 200k)
Taxable individual retirement arrangement distribution: $12,340 (reported on 2.7% of returns)
32822:
$12,340
Florida:
$24,823
(% of AGI for various income ranges: 13.0% for AGIs below $25k, 20.9% for AGIs $25k-50k, 70.6% for AGIs $50k-75k, 194.1% for AGIs $75k-100k, 574.0% for AGIs $100k-200k)
Total itemized deductions: $28,094 (reported on 2.5% of returns)
Here:
$28,094
State:
$45,393
(% of AGI for various income ranges: 13.6% for AGIs below $25k, 89.2% for AGIs $25k-50k, 197.2% for AGIs $50k-75k, 295.7% for AGIs $75k-100k, 507.8% for AGIs $100k-200k, 10320.0% for AGIs over 200k)
Charity contributions: $6,956 (reported on 2.1% of returns)
Here:
$6,956
State:
$20,178
(% of AGI for various income ranges: 0.9% for AGIs below $25k, 13.0% for AGIs $25k-50k, 35.0% for AGIs $50k-75k, 66.3% for AGIs $75k-100k, 154.3% for AGIs $100k-200k, 4330.0% for AGIs over 200k)
Taxes paid: $5,397 (reported on 2.5% of returns)
32822:
$5,397
State:
$6,967
(% of AGI for various income ranges: 3.0% for AGIs below $25k, 18.9% for AGIs $25k-50k, 34.4% for AGIs $50k-75k, 54.6% for AGIs $75k-100k, 86.2% for AGIs $100k-200k, 1005.0% for AGIs over 200k)
Earned income credit: $2,425 (reported on 32.5% of returns)
Here:
$2,425
State:
$2,306
(% of AGI for various income ranges: 137.5% for AGIs below $25k, 87.6% for AGIs $25k-50k, 1.2% for AGIs $50k-75k)
Percentage of individuals using paid preparers for their 2020 taxes: 93.8%
Here:
94%
State:
92%
(% for various income ranges: 93.1% for AGIs below $25k, 95.0% for AGIs $25k-50k, 93.9% for AGIs $50k-75k, 93.3% for AGIs $75k-100k, 92.2% for AGIs $100k-200k, 90.9% for AGIs over 200k)
Averages for the 2012 tax year for zip code 32822, filed in 2013:
Average Adjusted Gross Income (AGI) in 2012: $27,929 (Individual Income Tax Returns)
Here:
$27,929
State:
$60,316
Salary/wage: $26,883 (reported on 87.6% of returns)
Here:
$26,883
State:
$45,277
(% of AGI for various income ranges: 82.5% for AGIs below $25k, 91.0% for AGIs $25k-50k, 85.0% for AGIs $50k-75k, 80.8% for AGIs $75k-100k, 72.9% for AGIs $100k-200k, 38.5% for AGIs over 200k)
Taxable interest for individuals: $761 (reported on 11.3% of returns)
This zip code:
$761
Florida:
$3,587
(% of AGI for various income ranges: 0.3% for AGIs below $25k, 0.2% for AGIs $25k-50k, 0.3% for AGIs $50k-75k, 0.4% for AGIs $75k-100k, 0.6% for AGIs $100k-200k, 0.8% for AGIs over 200k)
Ordinary dividends: $3,694 (reported on 5.3% of returns)
Here:
$3,694
State:
$12,831
(% of AGI for various income ranges: 0.5% for AGIs below $25k, 0.4% for AGIs $25k-50k, 0.5% for AGIs $50k-75k, 0.6% for AGIs $75k-100k, 4.0% for AGIs $100k-200k)
Net capital gain/loss in AGI: +$3,027 (reported on 3.6% of returns)
Here:
+$3,027
State:
+$33,493
(% of AGI for various income ranges: 0.2% for AGIs $50k-75k, 0.7% for AGIs $75k-100k, 3.7% for AGIs $100k-200k)
Profit/loss from business: +$5,453 (reported on 17.5% of returns)
Here:
+$5,453
State:
+$10,012
(% of AGI for various income ranges: 9.6% for AGIs below $25k, 0.7% for AGIs $25k-50k, 0.7% for AGIs $50k-75k, 1.2% for AGIs $75k-100k, 1.8% for AGIs $100k-200k)
Taxable individual retirement arrangement distribution: $9,730 (reported on 3.7% of returns)
32822:
$9,730
Florida:
$21,544
(% of AGI for various income ranges: 0.8% for AGIs below $25k, 0.9% for AGIs $25k-50k, 1.4% for AGIs $50k-75k, 3.0% for AGIs $75k-100k, 3.2% for AGIs $100k-200k)
Total itemized deductions: $15,786 (32% of AGI, reported on 11.7% of returns)
Here:
$15,786
State:
$25,533
Here:
32.0% of AGI
State:
18.0% of AGI
(% of AGI for various income ranges: 4.2% for AGIs below $25k, 7.2% for AGIs $25k-50k, 8.4% for AGIs $50k-75k, 8.2% for AGIs $75k-100k, 8.0% for AGIs $100k-200k, 4.8% for AGIs over 200k)
Charity contributions: $2,713 (reported on 8.5% of returns)
Here:
$2,713
State:
$5,698
(% of AGI for various income ranges: 0.3% for AGIs below $25k, 0.8% for AGIs $25k-50k, 1.1% for AGIs $50k-75k, 1.4% for AGIs $75k-100k, 1.9% for AGIs $100k-200k)
Taxes paid: $2,449 (reported on 10.9% of returns)
32822:
$2,449
State:
$6,203
(% of AGI for various income ranges: 0.5% for AGIs below $25k, 1.0% for AGIs $25k-50k, 1.2% for AGIs $50k-75k, 1.3% for AGIs $75k-100k, 1.8% for AGIs $100k-200k, 1.4% for AGIs over 200k)
Earned income credit: $2,699 (reported on 39.4% of returns)
Here:
$2,699
State:
$2,372
(% of AGI for various income ranges: 11.0% for AGIs below $25k, 1.7% for AGIs $25k-50k)
Percentage of individuals using paid preparers for their 2012 taxes: 52.2%
Here:
52%
State:
54%
(% for various income ranges: 54.9% for AGIs below $25k, 48.0% for AGIs $25k-50k, 48.1% for AGIs $50k-75k, 48.8% for AGIs $75k-100k, 52.4% for AGIs $100k-200k, 75.0% for AGIs over 200k)
Averages for the 2004 tax year for zip code 32822, filed in 2005:
Average Adjusted Gross Income (AGI) in 2004: $26,822 (Individual Income Tax Returns)
Here:
$26,822
State:
$50,523
Salary/wage: $26,153 (reported on 90.0% of returns)
Here:
$26,153
State:
$39,563
(% of AGI for various income ranges: 91.9% for AGIs below $10k, 87.7% for AGIs $10k-25k, 91.8% for AGIs $25k-50k, 87.4% for AGIs $50k-75k, 82.9% for AGIs $75k-100k, 68.7% for AGIs over 100k)
Taxable interest for individuals: $738 (reported on 22.1% of returns)
This zip code:
$738
Florida:
$3,211
(% of AGI for various income ranges: 1.4% for AGIs below $10k, 0.6% for AGIs $10k-25k, 0.5% for AGIs $25k-50k, 0.5% for AGIs $50k-75k, 0.7% for AGIs $75k-100k, 1.1% for AGIs over 100k)
Taxable dividends: $1,266 (reported on 7.8% of returns)
Here:
$1,266
State:
$6,129
(% of AGI for various income ranges: 0.9% for AGIs below $10k, 0.3% for AGIs $10k-25k, 0.3% for AGIs $25k-50k, 0.3% for AGIs $50k-75k, 0.5% for AGIs $75k-100k, 1.0% for AGIs over 100k)
Net capital gain/loss: +$3,713 (reported on 6.2% of returns)
Here:
+$3,713
State:
+$27,205
(% of AGI for various income ranges: -0.2% for AGIs below $10k, 0.1% for AGIs $10k-25k, 0.2% for AGIs $25k-50k, 0.6% for AGIs $50k-75k, 1.3% for AGIs $75k-100k, 8.6% for AGIs over 100k)
Profit/loss from business: +$5,278 (reported on 12.2% of returns)
Here:
+$5,278
State:
+$10,634
(% of AGI for various income ranges: 12.5% for AGIs below $10k, 4.7% for AGIs $10k-25k, 0.8% for AGIs $25k-50k, 1.1% for AGIs $50k-75k, 0.9% for AGIs $75k-100k, 3.4% for AGIs over 100k)
IRA payment deduction: $2,388 (reported on 1.3% of returns)
32822:
$2,388
Florida:
$3,082
(% of AGI for various income ranges: 0.1% for AGIs $10k-25k, 0.1% for AGIs $25k-50k, 0.1% for AGIs $50k-75k, 0.1% for AGIs $75k-100k, 0.1% for AGIs over 100k)
Total itemized deductions: $14,171 (33% of AGI, reported on 19.6% of returns)
Here:
$14,171
State:
$20,370
Here:
32.6% of AGI
State:
20.7% of AGI
(% of AGI for various income ranges: 7.8% for AGIs below $10k, 7.2% for AGIs $10k-25k, 11.2% for AGIs $25k-50k, 13.5% for AGIs $50k-75k, 9.9% for AGIs $75k-100k, 9.8% for AGIs over 100k)
Charity contributions deductions: $2,210 (5% of AGI, reported on 16.0% of returns)
Here:
$2,210
State:
$4,064
Here:
4.9% of AGI
State:
3.8% of AGI
(% of AGI for various income ranges: 0.5% for AGIs below $10k, 0.7% for AGIs $10k-25k, 1.3% for AGIs $25k-50k, 1.7% for AGIs $50k-75k, 1.8% for AGIs $75k-100k, 2.1% for AGIs over 100k)
Total tax: $2,893 (reported on 66.8% of returns)
32822:
$2,893
State:
$9,431
(% of AGI for various income ranges: 3.0% for AGIs below $10k, 3.6% for AGIs $10k-25k, 6.5% for AGIs $25k-50k, 9.3% for AGIs $50k-75k, 11.5% for AGIs $75k-100k, 16.1% for AGIs over 100k)
Earned income credit: $1,998 (reported on 29.5% of returns)
Here:
$1,998
State:
$1,808
Percentage of individuals using paid preparers for their 2004 taxes: 55.9%
Here:
56%
State:
60%
(% for various income ranges: 56.1% for AGIs below $10k, 60.4% for AGIs $10k-25k, 52.3% for AGIs $25k-50k, 49.4% for AGIs $50k-75k, 50.2% for AGIs $75k-100k, 61.2% for AGIs over 100k)
Likely homosexual households (counted as self-reported same-sex unmarried-partner households)
Lesbian couples: 0.2% of all households
Gay men: 0.1% of all households
Household received Food Stamps/SNAP in the past 12 months: 5,863 Household did not receive Food Stamps/SNAP in the past 12 months: 19,249
Women who had a birth in the past 12 months: 1,440 (903 now married, 531 unmarried) Women who did not have a birth in the past 12 months: 16,802 (4,776 now married, 12,018 unmarried)
Housing units in zip code 32822 with a mortgage: 5,639 (246 second mortgage, 213 both second mortgage and home equity loan) Houses without a mortgage: 325
Median monthly owner costs for units with a mortgage: $1,429 Median monthly owner costs for units without a mortgage: $572
Residents with income below the poverty level in 2022:
This zip code:
16.4%
Whole state:
12.7%
Residents with income below 50% of the poverty level in 2022:
This zip code:
8.5%
Whole state:
6.6%
Median number of rooms in houses and condos:
Here:
5.4
State:
5.9
Median number of rooms in apartments:
Here:
4.2
State:
4.2
Notable locations in this zip code not listed on our city pages
Notable locations in zip code 32822: Century Plaza (A), Bayhill Plaza (B), Plaza Gigante (C), Ravines Golf Club (D), Airport Buisness Center (E), Southeast Branch Orange County Public Library (F), Orange County Fire Rescue Department Station 71 (G), Orlando Police Department (H). Display/hide their locations on the map
Shopping Centers: Fairvilla Shopping Center (1), Fern Park Shopping Center (2), Dover Shores Shopping Center (3), Curry Ford East Shopping Center (4), Pinar Plaza Shopping Center (5), Lake Fredrica Shopping Center (6), Conway Shopping Center (7), Hoffner Center Shopping Center (8). Display/hide their locations on the map
Churches in zip code 32822 include: Parkway Baptist Church (A), Mars Hill Seventh Day Adventist Church (B), Evangelical Assembly of God Church (C), Filipino International Christian Church (D), Iglesia Casa del Alfarero (E), Kingdom Hall of Jehovahs Witnesses (F), Ministerio Un Toque de Dios (G), Shenandoah Baptist Church (H), Tabernaculo De La Fe (I). Display/hide their locations on the map
5,171 married couples with children.
6,199 single-parent households (1,133 men, 5,066 women).
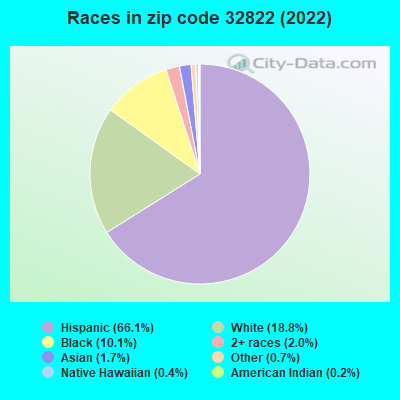
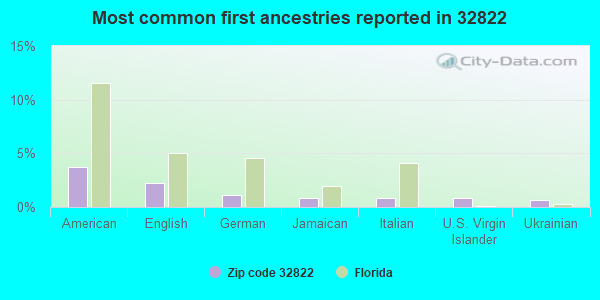
36.2% of residents of 32822 zip code speak English at home.
59.4% of residents speak Spanish at home (44% very well, 26% well, 20% not well, 10% not at all).
2.7% of residents speak other Indo-European language at home (59% very well, 22% well, 15% not well, 4% not at all).
0.9% of residents speak Asian or Pacific Island language at home (46% very well, 41% well, 13% not well).
1.0% of residents speak other language at home (69% very well, 21% well, 10% not well).
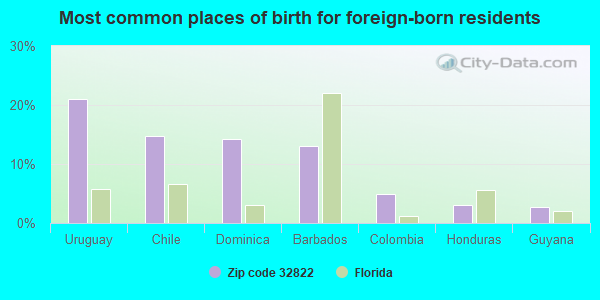
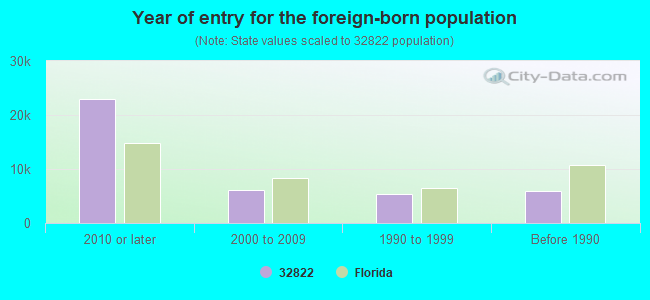
Foreign born population: 19,567 (27.9%) (42.0% of them are naturalized citizens)
Major facilities with environmental interests located in this zip code:
COURTESY COLLISION CENTER (6450 HOFFNER in ORLANDO, FL)
STATE MASTER (FDM) - CHAZ-FL0000118588, HAZARDOUS WASTE REGULATION PROGRAM (Resource Conservation and Recovery Act (tracking hazardous waste)) Business SIC classification: TOP, BODY, AND UPHOLSTERY REPAIR SHOPS AND PAINT SHOPS Organizations: BOB & BUCKS INC, ROBERT TROST, PRES (CONTACT/OWNER)
, SBR INDUSTRIES (CONTACT/OWNER)
Alternative names: BOB & BUCKS INC
ALL FLEET AUTO BODY LLC (4854 DISTRIBUTION CT #6-9 in ORLANDO, FL)
STATE MASTER (FDM) - CHAZ-FLD984175406, HAZARDOUS WASTE REGULATION PROGRAM Small Quantity Generators, between 100 kg and 1000 kg of hazardous waste/month (Resource Conservation and Recovery Act (tracking hazardous waste)) - notification Business SIC classification: TOP, BODY, AND UPHOLSTERY REPAIR SHOPS AND PAINT SHOPS Organizations: ARPCO AUTO PAINTING, DAVID ARP, PRES (CONTACT/OWNER)
Alternative names: ARPCO AUTO PAINTING
PENSKE AUTO CENTER (1801 SOUTH SEMORAN BOULEVARD in ORLANDO, FL)
AIR MINOR (AIRS/AFS) (Integrated Compliance Information System) - ICIS-04-2001-0073, FORMAL ENFORCEMENT ACTION Small Quantity Generators, between 100 kg and 1000 kg of hazardous waste/month (Resource Conservation and Recovery Act (tracking hazardous waste)) - notification Business SIC classification: NONCLASSIFIABLE ESTABLISHMENTS Organizations: DAVID TATUM, MGR SPEC PROJ (CONTACT/OWNER)
COURTESY COLLISION CENTER (6140 HOFFNER AVE in ORLANDO, FL)
STATE MASTER (FDM) - CHAZ-FLR000019521, HAZARDOUS WASTE REGULATION PROGRAM Small Quantity Generators, between 100 kg and 1000 kg of hazardous waste/month (Resource Conservation and Recovery Act (tracking hazardous waste)) - notification Business SIC classification: TOP, BODY, AND UPHOLSTERY REPAIR SHOPS AND PAINT SHOPS Organizations: WORLD CHEVROLET COLLISION CENTER, CLARENCE O KEARCE (CONTACT/OWNER)
, CHEVROLET WORLD INC (CONTACT/OWNER)
Alternative names: WORLD CHEVROLET COLLISION CENTER
SIEMENS POWER GENERATION INC (6550 HAZELTINE NATIONAL DR in ORLANDO, FL)
STATE MASTER (FDM) - CHAZ-FLR000118174, HAZARDOUS WASTE REGULATION PROGRAM Small Quantity Generators, between 100 kg and 1000 kg of hazardous waste/month (Resource Conservation and Recovery Act (tracking hazardous waste)) Business SIC classification: ELECTRIC SERVICES; ELECTRIC AND OTHER SERVICES COMBINED Organizations: AMERICAN REALTY INVESTORS LTD (CONTACT/OWNER)
Alternative names: SIEMENS WESTINGHOUSE POWER CORP
NORTHSTAR HIGH CHARTER SCHOOL (FORMERLY PASSPOR (8287 CURRY ROAD ROAD in ORLANDO, FL)
(National Center for Education Statistics) - STATE ID-0063 Organizations: ORANGE COUNTY SCHOOL DISTRICT (SCHOOL DISTRICT)
A & A AUTO CENTER INC (7236 NARCOOSSEE in ORLANDO, FL)
National Pollutant Discharge Elimination System NON-MAJOR (Tracking pollutant discharge elimination systems) - permit (Resource Conservation and Recovery Act (tracking hazardous waste)) Organizations: GIRALDO ALFONSO (CONTACT/OWNER)
PINAR ELEMENTARY SCHOOL (3701 ANTHONY LN in ORLANDO, FL)
(National Center for Education Statistics) - STATE ID-1541 Organizations: ORANGE COUNTY SCHOOL DISTRICT (SCHOOL DISTRICT)
ODYSSEY MIDDLE SCHOOL (FORMERLY CONWAY/J (9290 LEE VISTA BLVD. in ORLANDO, FL)
(National Center for Education Statistics) - STATE ID-1682 Organizations: ORANGE COUNTY SCHOOL DISTRICT (SCHOOL DISTRICT)
CURRY FORD EAST DRYCLEANERS INC (2331 S GOLDENROD RD in ORLANDO, FL)
AIR MINOR (AIRS/AFS) (Resource Conservation and Recovery Act (tracking hazardous waste)) Business SIC classification: DRYCLEANING PLANTS, EXCEPT RUG CLEANING Organizations: RALPH RAMDIHAL (CONTACT/OWNER)
Alternative names: R & R CLEANERS INCORPORATED
CVS @ GOLDENROD ROAD & CURRY F (SE CORNER OF CURRY FORD RD & G in ORLANDO, FL)
National Pollutant Discharge Elimination System NON-MAJOR (Tracking pollutant discharge elimination systems) - permit Organizations: JAKE SMITH (CONTACT/OWNER)
PRIME TIME CLEANERS (2504 S SEMORAN BLVD in ORLANDO, FL)
AIR MINOR (AIRS/AFS) Small Quantity Generators, between 100 kg and 1000 kg of hazardous waste/month (Resource Conservation and Recovery Act (tracking hazardous waste)) - notification Business SIC classification: DRYCLEANING PLANTS, EXCEPT RUG CLEANING Organizations: ANSUYA PATEL (CONTACT/OWNER)
Alternative names: SWAMI DRY CLEANERS
LEE VISTA WASHINGTON MUTUAL/RE (N OF LEE VISTA BLVD & E OF SR in ORLANDO, FL)
National Pollutant Discharge Elimination System NON-MAJOR (Tracking pollutant discharge elimination systems) - permit Organizations: DAVID BEYER (CONTACT/OWNER)
Housing units lacking complete plumbing facilities: 0.2% Housing units lacking complete kitchen facilities: 0.6%
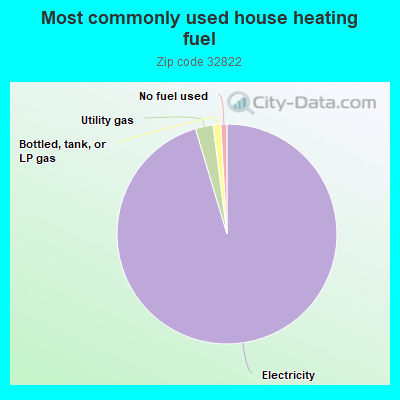
94.9%Electricity
2.6%Utility gas
1.1%Bottled, tank, or LP gas
0.9%No fuel used
Population in 1990: 33,986. Population change in the 1990s: +18,196 (+53.5%).
Place of birth for U.S.-born residents:
This state: 14,398
Northeast: 10,474
Midwest: 3,254
South: 3,651
West: 905
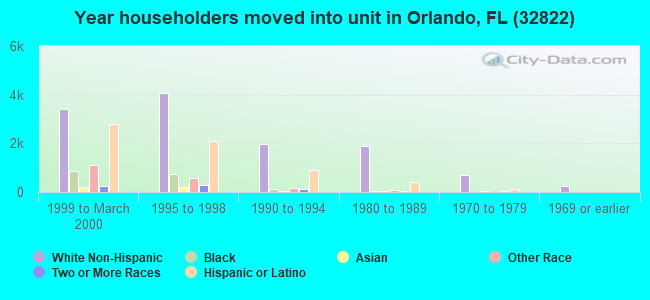
40% of the 32822 zip code residents lived in the same house 5 years ago. Out of people who lived in different houses, 49% lived in this county. Out of people who lived in different counties, 50% lived in Florida.
85% of the 32822 zip code residents lived in the same house 1 year ago. Out of people who lived in different houses, 38% moved from this county. Out of people who lived in different houses, 21% moved from different county within same state. Out of people who lived in different houses, 15% moved from different state. Out of people who lived in different houses, 31% moved from abroad.
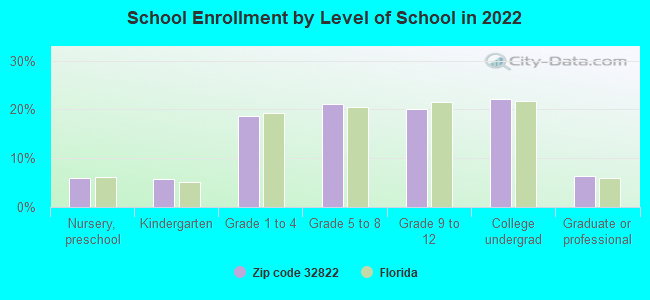
Private vs. public school enrollment:
Students in private schools in grades 1 to 8 (elementary and middle school): 242
Here:
4.3%
Florida:
15.8%
Students in private schools in grades 9 to 12 (high school): 355
Here:
12.3%
Florida:
12.9%
Students in private undergraduate colleges: 827
Here:
25.7%
Florida:
23.6%
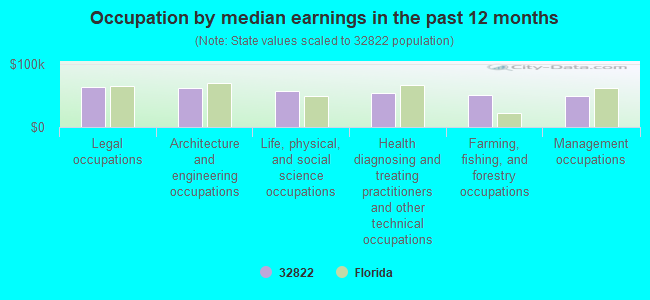
Occupation by median earnings in the past 12 months ($)
64,013Legal occupations
61,559Architecture and engineering occupations
57,635Life, physical, and social science occupations
53,777Health diagnosing and treating practitioners and other technical occupations
51,060Farming, fishing, and forestry occupations
49,568Management occupations
Companies with biggest federal contracts located in this zip code (ORLANDO, FL):
LOCKHEED MARTIN MILLIMETER TEC (5798 S SEMORAN BLVD) : $92,772,977 in 40 contractsfrom 2000 to 2006
Contracts for Launchers, Guided Missile, Cable, Cord, and Wire Assemblies: Communications Equipment, Electrical and Electronic assemblies, Boards, Cards, and Associated Hardware, Defense Aircraft -- Engineering Development (R&D), and moreby Army, Navy Signed by year:2000: $25,667,742; 2001: $18,933,424; 2002: $13,472,404; 2003: $7,827,481; 2004: $0; 2005: $17,107,206; 2006: $9,764,720.
Biggest contracts:
$13,089,888 with Army for Launchers, Guided Missile. Signed on 2000-05-05. Completion date: 2003-09-30.
$12,066,302, same as above.Signed on 2000-12-22. Completion date: 2003-07-31.
$11,022,069, same as above.Signed on 2002-12-16. Completion date: 2003-09-30.
$10,168,866, same as above.Signed on 2001-12-19. Completion date: 2004-12-31.
AEROSYSTEMS INTERNATIONAL INC (5850 T G LEE BLVD STE 26) : $616,449 in 4 contractsfrom 2005 to 2006
$443,315 with Air Force for Defense Electronics and Communication Equipment -- Advanced Development (R&D). Signed on 2005-12-30. Completion date: 2006-12-10.
$98,384 with Air Force for ADP Software. Signed on 2005-05-25. Completion date: 2005-06-24.
$55,500 with Air Force for Technical Assistance. Taking place in VA. Signed on 2006-06-09. Completion date: 2007-07-02.
$19,250 with Air Force for Education Services. Taking place in VA. Signed on 2006-01-19. Completion date: 2006-02-13.
GAM LASER INCORPORATED (6901 TPC DR.; small business) 10 employees, $2000000 revenue: $316,919 in 9 contractsfrom 2000 to 2005
Contracts for Other Defense -- Applied Research and Exploratory Development (R&D), Laboratory Equipment and Supplies, Stimulated Coherent Radiation Devices, Components and Accessories, Optical Instruments, Test Equipment, Components and Accessories, and moreby Navy, Geological Survey, Air Force, Army, and others Signed by year:2000: $94,382; 2001: $31,025; 2002: $39,858; 2003: $90,107; 2004: $43,285; 2005: $18,262; 2006: $0.
Biggest contracts:
$94,382 with Navy for Other Defense -- Applied Research and Exploratory Development (R&D). Signed on 2000-07-17. Completion date: 2000-11-14.
$56,242 with Geological Survey for Laboratory Equipment and Supplies. Taking place in CO. Signed on 2003-11-17. Completion date: 2004-03-24.
$43,085 with Air Force for Stimulated Coherent Radiation Devices, Components and Accessories. Signed on 2004-02-17. Completion date: 2004-04-02.
$39,858 with Army for Optical Instruments, Test Equipment, Components and Accessories. Signed on 2002-07-03. Completion date: 2002-09-06.
DAYTONA HOTEL CORP (7550 AUGUSTA NATIONAL DRIV; small business) : $233,309 in 8 contractsin 2005
Contracts for Lodging - Hotel/Motel, Food Services by Army Signed by year:2000: $0; 2001: $0; 2002: $0; 2003: $0; 2004: $0; 2005: $233,309; 2006: $0.
Biggest contracts:
$174,930 with Army for Lodging - Hotel/Motel. Signed on 2005-07-01. Completion date: 2005-08-15.
$33,737 with Army for Food Services. Signed on 2005-07-27. Completion date: 2005-08-11.
$14,700 with Army for Lodging - Hotel/Motel. Signed on 2005-05-23. Completion date: 2005-07-10.
$7,448, same as above.Signed on 2005-11-07. Completion date: 2005-12-21.
WESCO AIRCRAFT HARDWARE CORP (5850 T. G. LEE BLVD., SUIT; small business) : $120,507 in 4 contractsfrom 1999 to 2000
$35,950 with Air Force for Airframe Structural Components. Signed on 2000-03-28. Completion date: 2000-06-30.
$33,790, same as above.Signed on 2000-03-28. Completion date: 2000-05-31.
$25,715, same as above.Signed on 2000-04-26. Completion date: 2000-05-31.
$25,052 with Air Force for Screws. Signed on 1999-10-22. Completion date: 1999-10-31.
FOLIAGE DESIGN SYSTEMS FRANCHI (7048 NARCOOSSEE RD; small business) : $67,518 in 2 contractsfrom 2000 to 2006
$63,000 with Tennessee Valley Authority for Interior Plantscaping. Taking place in TN. Signed on 2000-09-15. Completion date: 2001-04-15.
$4,518 with Navy for Seeds and Nursery Stock. Signed on 2006-01-06. Completion date: 2006-01-06.
GIKEN AMERICA CORPORATION (5802 HOFFNER AVE , SUITE 7; small business)
$54,516 with U.S. Army Corps of Engineers - civil program financing only for Engineering and Technical Services. Taking place in LA. Signed on 2000-10-12. Completion date: 2000-10-27.
DJONT/JPM ORLANDO LEASING LLC (5750 T G LEE BLVD)
$26,880 with Army for Lodging - Hotel/Motel. Signed on 2005-03-16. Completion date: 2005-03-18.
RSI BASEBAND TECHNOLOGIES INC. (6901 T.P.C. BLVD.)
$25,000 with Navy for Communications Security Equipment and Components. Signed on 2000-01-18. Completion date: 2000-01-21.
WESCO AIRCRAFT HARDWARE, CORP (5850 T G LEE BLVD, #480; small business) : $23,476 in 5 contractsfrom 2004 to 2005
Contracts for Hand Tools, Nonedged, Nonpowered, Rivets, Bolts, Fastening Device by Navy, Army Signed by year:2000: $0; 2001: $0; 2002: $0; 2003: $0; 2004: $16,816; 2005: $6,660; 2006: $0.
Biggest contracts:
$13,645 with Navy for Hand Tools, Nonedged, Nonpowered. Signed on 2004-12-21. Completion date: 2005-03-31.
$6,660 with Army for Rivets. Signed on 2005-09-14. Completion date: 2005-09-21.
$2,200 with Navy for Bolts. Signed on 2004-05-04. Completion date: 2004-05-21.
$850 with Navy for Rivets. Signed on 2004-08-04. Completion date: 2004-09-07.
Top industries in this zip code by the number of employees in 2005:
Health Care and Social Assistance: General Medical and Surgical Hospitals (over 1000 employees: 1 establishment, 1-4 employees: 1 establishment)
2003 - 2018 National Fire Incident Reporting System (NFIRS) incidents
Based on the data from the years 2003 - 2018 the average number of fire incidents per year is 120. The highest number of reported fire incidents - 188 took place in 2006, and the least - 79 in 2010. The data has a decreasing trend.
When looking into fire subcategories, the most reports belonged to: Structure Fires (40.4%), and Outside Fires (33.1%).
Fire incident types reported to NFIRS in Zip Code 32822


 Nearest zip codes: 32812, 32829, 32807, 32825, 32806, 32827.
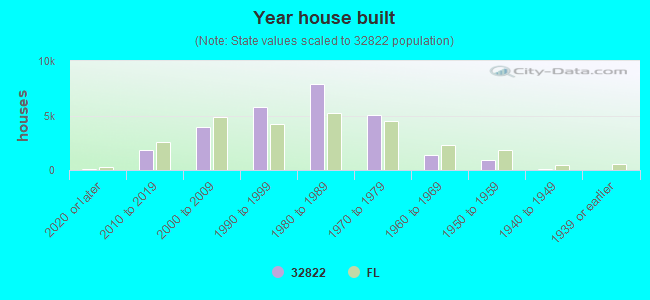


 Based on the data from the years 2003 - 2018 the average number of fire incidents per year is 120. The highest number of reported fire incidents - 188 took place in 2006, and the least - 79 in 2010. The data has a decreasing trend.
 When looking into fire subcategories, the most reports belonged to: Structure Fires (40.4%), and Outside Fires (33.1%).