Estimated zip code population in 2022: 14,150 Zip code population in 2010: 13,567 Zip code population in 2000: 14,742
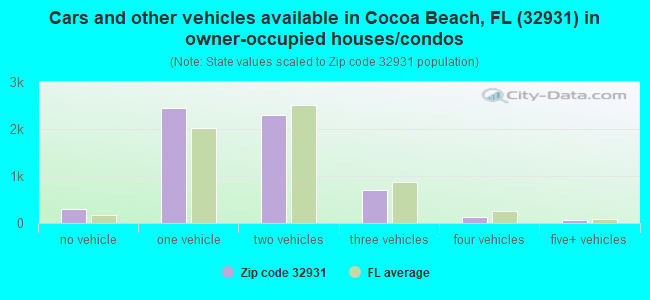
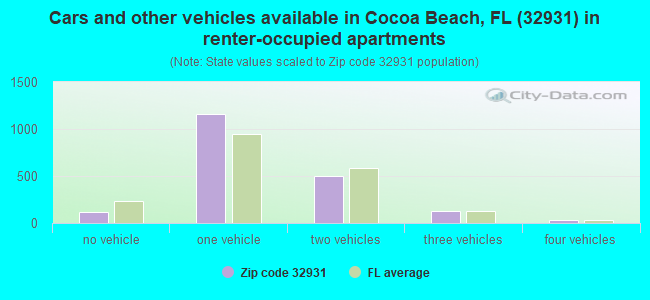
Houses and condos: 11,308 Renter-occupied apartments: 1,940
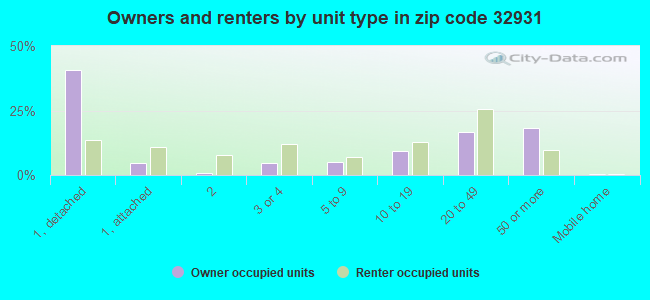
% of renters here:
25%
State:
33%
March 2022 cost of living index in zip code 32931: 91.9 (less than average, U.S. average is 100)
Land area: 5.2 sq. mi. Water area: 15.2 sq. mi.
Population density: 2,723 people per square mile
(average).
OSM Map
General Map
Google Map
MSN Map
OSM Map
General Map
Google Map
MSN Map
OSM Map
General Map
Google Map
MSN Map
OSM Map
General Map
Google Map
MSN Map
Please wait while loading the map...
Real estate property taxes paid for housing units in 2022:
This zip code:
0.6% ($3,188)
Florida:
0.7% ($2,529)
Median real estate property taxes paid for housing units with mortgages in 2022: $3,428 (0.6%) Median real estate property taxes paid for housing units with no mortgage in 2022: $3,038 (0.6%)
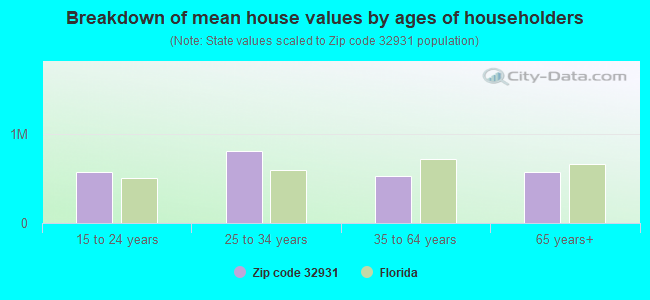
Estimated median house/condo value in 2022: $528,605
32931:
$528,605
Florida:
$354,100
According to our research of Florida and other state lists, there were 5 registered sex offenders living in 32931 zip code as of April 27, 2024. The ratio of all residents to sex offenders in zip code 32931 is 2,863 to 1. The ratio of registered sex offenders to all residents in this zip code is much lower than the state average.
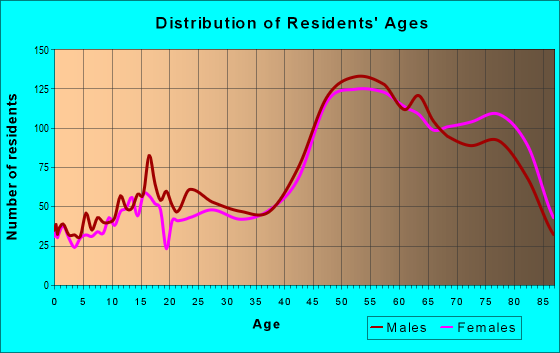
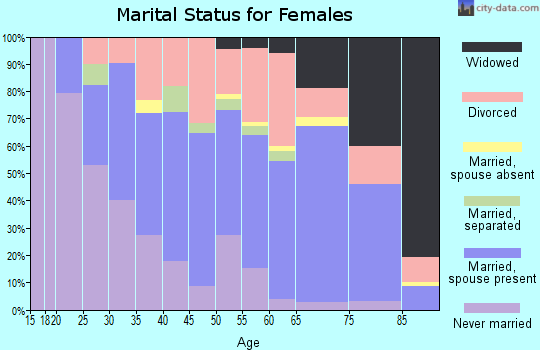
Median resident age:
This zip code:
59.2 years
Florida median age:
42.7 years
Average household size:
This zip code:
1.8 people
Florida:
2.5 people
Averages for the 2020 tax year for zip code 32931, filed in 2021:
Average Adjusted Gross Income (AGI) in 2020: $106,087 (Individual Income Tax Returns)
Here:
$106,087
State:
$82,200
Salary/wage: $77,938 (reported on 64.6% of returns)
Here:
$77,938
State:
$58,347
(% of AGI for various income ranges: 1121.9% for AGIs below $25k, 3170.3% for AGIs $25k-50k, 5440.4% for AGIs $50k-75k, 7755.5% for AGIs $75k-100k, 14473.8% for AGIs $100k-200k, 69805.0% for AGIs over 200k)
Taxable interest for individuals: $3,610 (reported on 50.3% of returns)
This zip code:
$3,610
Florida:
$4,272
(% of AGI for various income ranges: 61.4% for AGIs below $25k, 91.8% for AGIs $25k-50k, 156.2% for AGIs $50k-75k, 209.5% for AGIs $75k-100k, 507.7% for AGIs $100k-200k, 2750.0% for AGIs over 200k)
Ordinary dividends: $12,460 (reported on 40.8% of returns)
Here:
$12,460
State:
$15,863
(% of AGI for various income ranges: 104.7% for AGIs below $25k, 228.4% for AGIs $25k-50k, 367.5% for AGIs $50k-75k, 690.0% for AGIs $75k-100k, 1397.9% for AGIs $100k-200k, 8217.5% for AGIs over 200k)
Net capital gain/loss in AGI: +$29,993 (reported on 38.3% of returns)
Here:
+$29,993
State:
+$62,983
(% of AGI for various income ranges: 42.6% for AGIs below $25k, 96.7% for AGIs $25k-50k, 269.3% for AGIs $50k-75k, 581.5% for AGIs $75k-100k, 1866.6% for AGIs $100k-200k, 27908.7% for AGIs over 200k)
Profit/loss from business: +$21,518 (reported on 16.2% of returns)
Here:
+$21,518
State:
+$9,719
(% of AGI for various income ranges: 147.8% for AGIs below $25k, 167.1% for AGIs $25k-50k, 266.0% for AGIs $50k-75k, 434.5% for AGIs $75k-100k, 646.8% for AGIs $100k-200k, 6167.1% for AGIs over 200k)
Taxable individual retirement arrangement distribution: $26,836 (reported on 19.2% of returns)
32931:
$26,836
Florida:
$24,823
(% of AGI for various income ranges: 146.5% for AGIs below $25k, 283.4% for AGIs $25k-50k, 679.6% for AGIs $50k-75k, 1045.2% for AGIs $75k-100k, 2079.0% for AGIs $100k-200k, 4665.8% for AGIs over 200k)
Self-employed (Keogh) retirement plans: $31,550 (reported on 0.8% of returns)
32931:
$31,550
Florida:
$29,694
(% of AGI for various income ranges: 62.9% for AGIs $50k-75k, 644.6% for AGIs over 200k)
Total itemized deductions: $34,900 (reported on 11.1% of returns)
Here:
$34,900
State:
$45,393
(% of AGI for various income ranges: 116.7% for AGIs below $25k, 128.6% for AGIs $25k-50k, 340.9% for AGIs $50k-75k, 640.8% for AGIs $75k-100k, 1060.8% for AGIs $100k-200k, 5961.7% for AGIs over 200k)
Charity contributions: $12,312 (reported on 8.9% of returns)
Here:
$12,312
State:
$20,178
(% of AGI for various income ranges: 7.4% for AGIs below $25k, 12.8% for AGIs $25k-50k, 46.4% for AGIs $50k-75k, 97.8% for AGIs $75k-100k, 242.7% for AGIs $100k-200k, 2309.6% for AGIs over 200k)
Taxes paid: $7,104 (reported on 10.9% of returns)
32931:
$7,104
State:
$6,967
(% of AGI for various income ranges: 16.0% for AGIs below $25k, 28.9% for AGIs $25k-50k, 66.9% for AGIs $50k-75k, 145.8% for AGIs $75k-100k, 245.4% for AGIs $100k-200k, 1078.8% for AGIs over 200k)
Earned income credit: $1,394 (reported on 8.5% of returns)
Here:
$1,394
State:
$2,306
(% of AGI for various income ranges: 45.5% for AGIs below $25k, 31.6% for AGIs $25k-50k)
Percentage of individuals using paid preparers for their 2020 taxes: 90.2%
Here:
90%
State:
92%
(% for various income ranges: 88.9% for AGIs below $25k, 91.2% for AGIs $25k-50k, 89.2% for AGIs $50k-75k, 89.2% for AGIs $75k-100k, 90.6% for AGIs $100k-200k, 92.9% for AGIs over 200k)
Averages for the 2012 tax year for zip code 32931, filed in 2013:
Average Adjusted Gross Income (AGI) in 2012: $74,028 (Individual Income Tax Returns)
Here:
$74,028
State:
$60,316
Salary/wage: $54,602 (reported on 65.1% of returns)
Here:
$54,602
State:
$45,277
(% of AGI for various income ranges: 62.5% for AGIs below $25k, 54.9% for AGIs $25k-50k, 52.7% for AGIs $50k-75k, 52.8% for AGIs $75k-100k, 54.1% for AGIs $100k-200k, 35.8% for AGIs over 200k)
Taxable interest for individuals: $2,760 (reported on 47.5% of returns)
This zip code:
$2,760
Florida:
$3,587
(% of AGI for various income ranges: 3.6% for AGIs below $25k, 2.1% for AGIs $25k-50k, 1.7% for AGIs $50k-75k, 1.9% for AGIs $75k-100k, 1.9% for AGIs $100k-200k, 1.2% for AGIs over 200k)
Ordinary dividends: $10,049 (reported on 37.0% of returns)
Here:
$10,049
State:
$12,831
(% of AGI for various income ranges: 6.0% for AGIs below $25k, 4.4% for AGIs $25k-50k, 3.8% for AGIs $50k-75k, 4.6% for AGIs $75k-100k, 5.1% for AGIs $100k-200k, 5.5% for AGIs over 200k)
Net capital gain/loss in AGI: +$18,648 (reported on 30.7% of returns)
Here:
+$18,648
State:
+$33,493
(% of AGI for various income ranges: 1.3% for AGIs $25k-50k, 0.9% for AGIs $50k-75k, 1.3% for AGIs $75k-100k, 3.0% for AGIs $100k-200k, 19.0% for AGIs over 200k)
Profit/loss from business: +$16,049 (reported on 15.4% of returns)
Here:
+$16,049
State:
+$10,012
(% of AGI for various income ranges: 7.9% for AGIs below $25k, 3.5% for AGIs $25k-50k, 2.6% for AGIs $50k-75k, 2.8% for AGIs $75k-100k, 3.3% for AGIs $100k-200k, 2.9% for AGIs over 200k)
Taxable individual retirement arrangement distribution: $20,163 (reported on 20.7% of returns)
32931:
$20,163
Florida:
$21,544
(% of AGI for various income ranges: 5.9% for AGIs below $25k, 6.9% for AGIs $25k-50k, 6.1% for AGIs $50k-75k, 6.5% for AGIs $75k-100k, 6.9% for AGIs $100k-200k, 3.8% for AGIs over 200k)
Self-employment retirement plans: $22,720 (reported on 0.7% of returns)
32931:
$22,720
Florida:
$20,611
Total itemized deductions: $23,301 (16% of AGI, reported on 31.0% of returns)
Here:
$23,301
State:
$25,533
Here:
16.2% of AGI
State:
18.0% of AGI
(% of AGI for various income ranges: 13.3% for AGIs below $25k, 10.5% for AGIs $25k-50k, 10.7% for AGIs $50k-75k, 11.3% for AGIs $75k-100k, 11.1% for AGIs $100k-200k, 7.1% for AGIs over 200k)
Charity contributions: $4,957 (reported on 24.9% of returns)
Here:
$4,957
State:
$5,698
(% of AGI for various income ranges: 1.0% for AGIs below $25k, 1.0% for AGIs $25k-50k, 1.0% for AGIs $50k-75k, 1.4% for AGIs $75k-100k, 1.8% for AGIs $100k-200k, 2.2% for AGIs over 200k)
Taxes paid: $6,265 (reported on 30.7% of returns)
32931:
$6,265
State:
$6,203
(% of AGI for various income ranges: 2.7% for AGIs below $25k, 2.2% for AGIs $25k-50k, 2.2% for AGIs $50k-75k, 2.9% for AGIs $75k-100k, 3.0% for AGIs $100k-200k, 2.4% for AGIs over 200k)
Earned income credit: $1,634 (reported on 11.9% of returns)
Here:
$1,634
State:
$2,372
(% of AGI for various income ranges: 3.6% for AGIs below $25k, 0.4% for AGIs $25k-50k)
Percentage of individuals using paid preparers for their 2012 taxes: 51.0%
Here:
51%
State:
54%
(% for various income ranges: 44.7% for AGIs below $25k, 49.7% for AGIs $25k-50k, 54.2% for AGIs $50k-75k, 52.1% for AGIs $75k-100k, 58.7% for AGIs $100k-200k, 70.6% for AGIs over 200k)
Averages for the 2004 tax year for zip code 32931, filed in 2005:
Average Adjusted Gross Income (AGI) in 2004: $61,168 (Individual Income Tax Returns)
Here:
$61,168
State:
$50,523
Salary/wage: $46,134 (reported on 63.4% of returns)
Here:
$46,134
State:
$39,563
(% of AGI for various income ranges: 418.1% for AGIs below $10k, 55.3% for AGIs $10k-25k, 56.3% for AGIs $25k-50k, 50.6% for AGIs $50k-75k, 51.9% for AGIs $75k-100k, 41.3% for AGIs over 100k)
Taxable interest for individuals: $3,243 (reported on 61.8% of returns)
This zip code:
$3,243
Florida:
$3,211
(% of AGI for various income ranges: 57.5% for AGIs below $10k, 5.6% for AGIs $10k-25k, 3.7% for AGIs $25k-50k, 3.9% for AGIs $50k-75k, 3.0% for AGIs $75k-100k, 2.5% for AGIs over 100k)
Taxable dividends: $5,577 (reported on 44.4% of returns)
Here:
$5,577
State:
$6,129
(% of AGI for various income ranges: 38.0% for AGIs below $10k, 5.2% for AGIs $10k-25k, 3.5% for AGIs $25k-50k, 3.6% for AGIs $50k-75k, 5.1% for AGIs $75k-100k, 3.7% for AGIs over 100k)
Net capital gain/loss: +$20,560 (reported on 38.5% of returns)
Here:
+$20,560
State:
+$27,205
(% of AGI for various income ranges: 16.8% for AGIs below $10k, 0.7% for AGIs $10k-25k, 1.4% for AGIs $25k-50k, 2.4% for AGIs $50k-75k, 4.5% for AGIs $75k-100k, 22.2% for AGIs over 100k)
Profit/loss from business: +$15,836 (reported on 14.3% of returns)
Here:
+$15,836
State:
+$10,634
(% of AGI for various income ranges: 60.4% for AGIs below $10k, 4.9% for AGIs $10k-25k, 2.9% for AGIs $25k-50k, 3.3% for AGIs $50k-75k, 2.4% for AGIs $75k-100k, 3.9% for AGIs over 100k)
IRA payment deduction: $3,450 (reported on 2.9% of returns)
32931:
$3,450
Florida:
$3,082
(% of AGI for various income ranges: 0.4% for AGIs $10k-25k, 0.3% for AGIs $25k-50k, 0.2% for AGIs $50k-75k, 0.1% for AGIs $75k-100k, 0.1% for AGIs over 100k)
Self-employed pension: $17,373 (reported on 0.8% of returns)
Here:
$17,373
Florida:
$15,857
Total itemized deductions: $19,500 (19% of AGI, reported on 36.8% of returns)
Here:
$19,500
State:
$20,370
Here:
19.1% of AGI
State:
20.7% of AGI
(% of AGI for various income ranges: 103.2% for AGIs below $10k, 16.3% for AGIs $10k-25k, 15.5% for AGIs $25k-50k, 13.9% for AGIs $50k-75k, 14.2% for AGIs $75k-100k, 8.6% for AGIs over 100k)
Charity contributions deductions: $3,500 (3% of AGI, reported on 32.0% of returns)
Here:
$3,500
State:
$4,064
Here:
3.3% of AGI
State:
3.8% of AGI
(% of AGI for various income ranges: 6.8% for AGIs below $10k, 1.5% for AGIs $10k-25k, 1.5% for AGIs $25k-50k, 1.9% for AGIs $50k-75k, 2.0% for AGIs $75k-100k, 1.9% for AGIs over 100k)
Total tax: $11,458 (reported on 80.5% of returns)
32931:
$11,458
State:
$9,431
(% of AGI for various income ranges: 14.5% for AGIs below $10k, 4.3% for AGIs $10k-25k, 7.9% for AGIs $25k-50k, 10.4% for AGIs $50k-75k, 11.9% for AGIs $75k-100k, 20.2% for AGIs over 100k)
Earned income credit: $1,197 (reported on 8.4% of returns)
Here:
$1,197
State:
$1,808
Percentage of individuals using paid preparers for their 2004 taxes: 57.0%
Here:
57%
State:
60%
(% for various income ranges: 53.6% for AGIs below $10k, 55.2% for AGIs $10k-25k, 56.4% for AGIs $25k-50k, 56.6% for AGIs $50k-75k, 56.6% for AGIs $75k-100k, 65.8% for AGIs over 100k)
Likely homosexual households (counted as self-reported same-sex unmarried-partner households)
Lesbian couples: 0.2% of all households
Gay men: 0.2% of all households
Household received Food Stamps/SNAP in the past 12 months: 185 Household did not receive Food Stamps/SNAP in the past 12 months: 7,708
Women who had a birth in the past 12 months: 32 (14 now married, 17 unmarried) Women who did not have a birth in the past 12 months: 1,931 (817 now married, 1,114 unmarried)
Housing units in zip code 32931 with a mortgage: 2,885 (223 second mortgage, 200 both second mortgage and home equity loan) Houses without a mortgage: 101
Median monthly owner costs for units with a mortgage: $2,212 Median monthly owner costs for units without a mortgage: $884
Residents with income below the poverty level in 2022:
This zip code:
7.2%
Whole state:
12.7%
Residents with income below 50% of the poverty level in 2022:
This zip code:
2.9%
Whole state:
6.6%
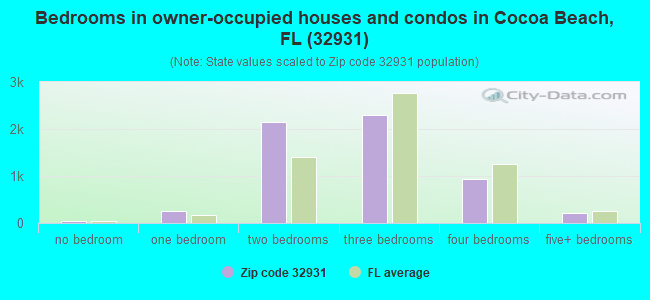
Median number of rooms in houses and condos:
Here:
5.4
State:
5.9
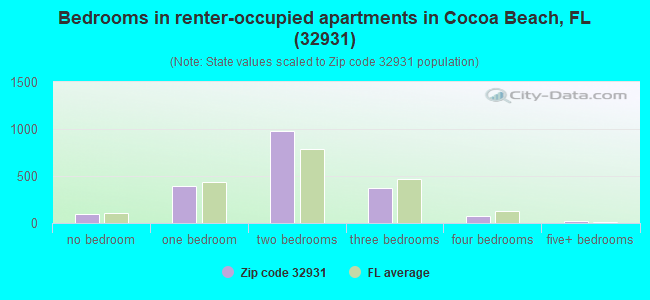
Median number of rooms in apartments:
Here:
4.1
State:
4.2
Notable locations in this zip code not listed on our city pages
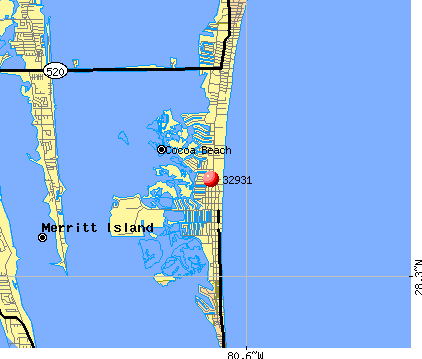
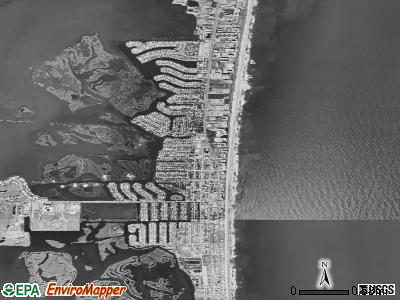
Notable locations in zip code 32931: Canaveral Plaza (A), Casselberry Golf Club (B), Cocoa Beach Water Reclamation Facility (C), Cocoa Beach Public Library (D), Cocoa Beach Fire Department Station 1 (E), Cocoa Beach Fire Department Station 2 (F), Brevard County Rescue Station 61 (G), Cocoa Beach Police Department - Investigations (H), Brevard County Fire Rescue Station 61 (I). Display/hide their locations on the map
862 married couples with children.
323 single-parent households (67 men, 256 women).
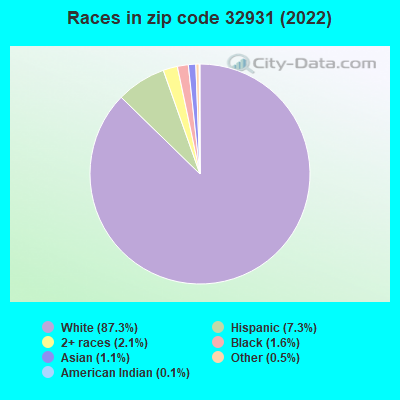
87.3% of residents of 32931 zip code speak English at home.
5.1% of residents speak Spanish at home (87% very well, 10% well, 3% not well).
6.6% of residents speak other Indo-European language at home (75% very well, 15% well, 4% not well, 5% not at all).
0.9% of residents speak Asian or Pacific Island language at home (80% very well, 20% well).
0.3% of residents speak other language at home (100% very well).
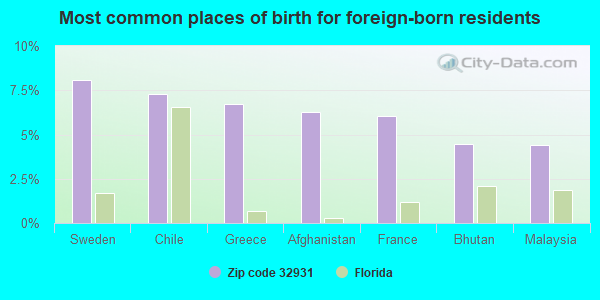
Foreign born population: 1,383 (9.8%) (71.3% of them are naturalized citizens)
This zip code:
9.8%
Whole state:
21.7%
8%Sweden
7%Chile
7%Greece
6%Afghanistan
6%France
4%Bhutan
4%Malaysia
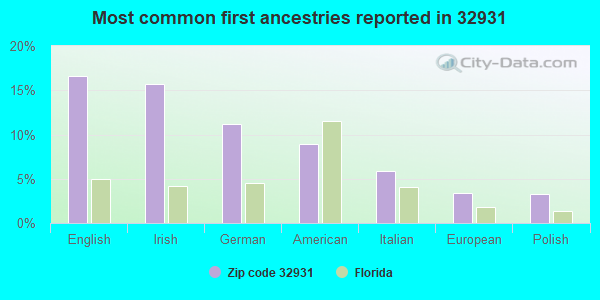
17%English
16%Irish
11%German
9%American
6%Italian
3%European
3%Polish
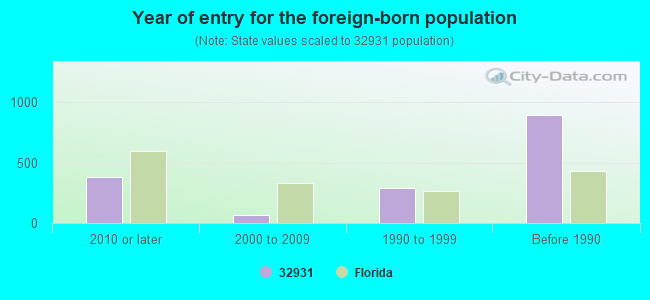
Year of entry for the foreign-born population
3792010 or later
702000 to 2009
2871990 to 1999
893Before 1990
Major facilities with environmental interests located in this zip code:
LA ROSAS ONE HOUR CLEANING (4333 N ATLANTIC AVE in COCOA BEACH, FL)
AIR MINOR (AIRS/AFS) (Integrated Compliance Information System) - ICIS-04-2001-9033, FORMAL ENFORCEMENT ACTION Small Quantity Generators, between 100 kg and 1000 kg of hazardous waste/month (Resource Conservation and Recovery Act (tracking hazardous waste)) Business SIC classification: HOUSEHOLD LAUNDRY EQUIPMENT; DRYCLEANING PLANTS, EXCEPT RUG CLEANING Organizations: ALPHONSE LAROSA (CONTACT/OWNER)
Alternative names: LA ROSA 1 HOUR CLEANERS
COCOA BEACH JUNIOR/SENIOR HIGH SCHOOL (1500 MINUTEMEN CAUSEWAY in COCOA BEACH, FL)
(National Center for Education Statistics) - STATE ID-5011 Small Quantity Generators, between 100 kg and 1000 kg of hazardous waste/month (Resource Conservation and Recovery Act (tracking hazardous waste)) - notification Organizations: ESTES BOBBY DIRECTOR OF PURCHASING (CONTACT/OWNER)
, BREVARD COUNTY SCHOOL DISTRICT (SCHOOL DISTRICT)
Alternative names: BREVARD CO COCOA BEACH HIGH SCHOOL
CITY OF COCOA BEACH (1600 MINUTEMAN CAUSEWAY in COCOA BEACH, FL)
National Pollutant Discharge Elimination System MAJOR (Tracking pollutant discharge elimination systems) - permit National Pollutant Discharge Elimination System NON-MAJOR (Tracking pollutant discharge elimination systems) - permit Small Quantity Generators, between 100 kg and 1000 kg of hazardous waste/month (Resource Conservation and Recovery Act (tracking hazardous waste)) Business SIC classification: SEWERAGE SYSTEMS Organizations: COCOA BEACH RECLAMATION (CONTACT/OPERATOR)
, MARK ECKERT (CONTACT/OWNER)
, CHARLES BILLIAS (CONTACT/OWNER)
, CITY OF COCA BEACH (CONTACT/OWNER)
Alternative names: CITY OF COCOA BEACH WATER RECLAMATION FACILITY, COCOA BEACH WTP, COCOA BEACH WWTP
MAGNOLIA BAY CONDOMINIUMS (S ORLANDO AVE & S 21ST ST in COCOA BEACH, FL)
National Pollutant Discharge Elimination System NON-MAJOR (Tracking pollutant discharge elimination systems) - permit Organizations: ALAN DOLENSHEK (CONTACT/OWNER)
PUBLIX CORNERSTONE PLAZA (NW SHEPERHERD DR. & A1A in COCOA BEACH, FL)
National Pollutant Discharge Elimination System NON-MAJOR (Tracking pollutant discharge elimination systems) - permit Organizations: ERNIE EULER (CONTACT/OWNER)
PUBLIX CORNERSTONE PLAZA (NW CORNER OF SHEPARD DRIVE AND in COCOA BEACH, FL)
National Pollutant Discharge Elimination System NON-MAJOR (Tracking pollutant discharge elimination systems) - permit Organizations: ERNIE EULER (CONTACT/OWNER)
7-11 #25191 (3177 N HWY A1A in COCOA BEACH, FL)
National Pollutant Discharge Elimination System NON-MAJOR (Tracking pollutant discharge elimination systems) - permit Organizations: DAVID PETERSEN (CONTACT/OWNER)
MARINE PARTS OUTLET (2399 SE DIXIE HWY in STUART, FL)
(Resource Conservation and Recovery Act (tracking hazardous waste)) Organizations: KATHLEEN MAESTRE, PART MGR (CONTACT/OWNER)
MINUTEMAN SUBSTATION (105 S BREVARD AVE in COCOA BEACH, FL)
PALMS OF COCOA BEACH (1325 N ATLANTIC AVE in COCOA BEACH, FL)
National Pollutant Discharge Elimination System NON-MAJOR (Tracking pollutant discharge elimination systems) - permit Organizations: WILLIAM STINSON (CONTACT/OWNER)
PIER PLAZA (CALIFORNIA AVE & PALM DR in COCOA BEACH, FL)
National Pollutant Discharge Elimination System NON-MAJOR (Tracking pollutant discharge elimination systems) - permit Organizations: DAVID GAL (CONTACT/OWNER)
PIER RESORT CONDOMINIUMS (5301 OCEAN BEACH BLVD in COCOA BEACH, FL)
National Pollutant Discharge Elimination System NON-MAJOR (Tracking pollutant discharge elimination systems) - permit Organizations: ROBERT ALCANTER (CONTACT/OWNER)
Alternative names: BELLEAIR COUNTRY CLUB EAST COU
CRESCENT PALMS CONDOS (200 24TH ST., S. in COCOA BEACH, FL)
National Pollutant Discharge Elimination System NON-MAJOR (Tracking pollutant discharge elimination systems) - permit Organizations: CHARLES BOYD (CONTACT/OWNER)
Housing units lacking complete plumbing facilities: 0.2% Housing units lacking complete kitchen facilities: 0.6%
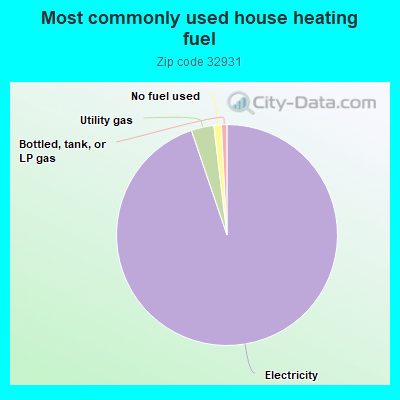
94.7%Electricity
3.3%Utility gas
1.1%No fuel used
0.8%Bottled, tank, or LP gas
Population in 1990: 14,989.
Place of birth for U.S.-born residents:
This state: 2,277
Northeast: 3,848
Midwest: 2,826
South: 2,696
West: 838
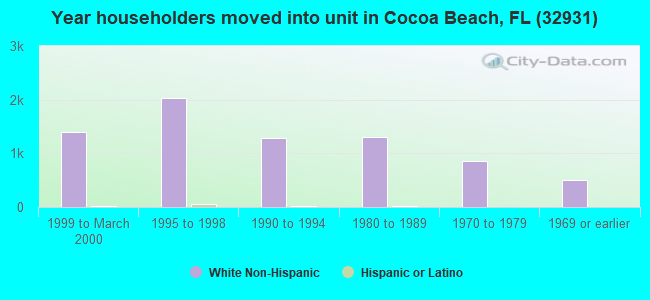
54% of the 32931 zip code residents lived in the same house 5 years ago. Out of people who lived in different houses, 48% lived in this county. Out of people who lived in different counties, 50% lived in Florida.
87% of the 32931 zip code residents lived in the same house 1 year ago. Out of people who lived in different houses, 32% moved from this county. Out of people who lived in different houses, 8% moved from different county within same state. Out of people who lived in different houses, 53% moved from different state. Out of people who lived in different houses, 11% moved from abroad.
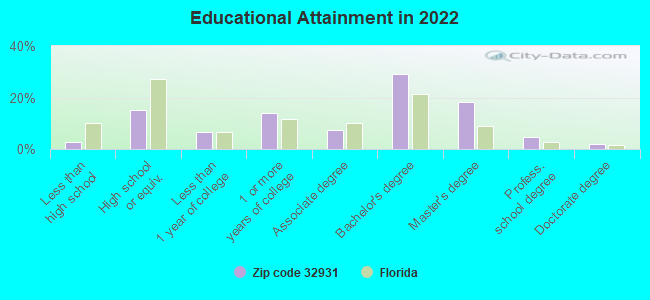
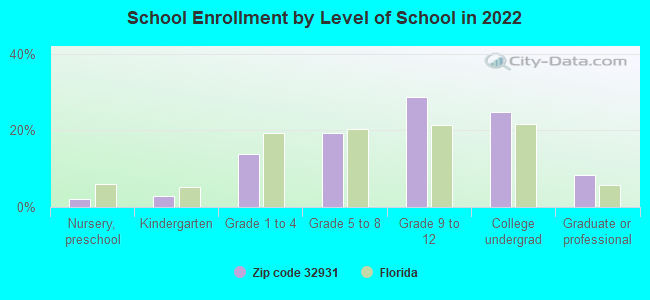
Private vs. public school enrollment:
Students in private schools in grades 1 to 8 (elementary and middle school): 75
Here:
12.9%
Florida:
15.8%
Students in private schools in grades 9 to 12 (high school): 73
Here:
14.4%
Florida:
12.9%
Students in private undergraduate colleges: 191
Here:
42.7%
Florida:
23.6%
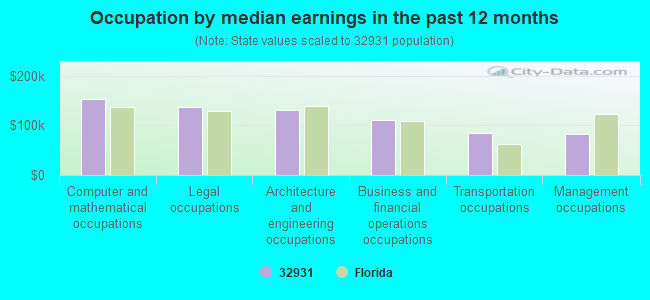
Occupation by median earnings in the past 12 months ($)
153,461Computer and mathematical occupations
138,225Legal occupations
131,990Architecture and engineering occupations
110,113Business and financial operations occupations
84,802Transportation occupations
82,804Management occupations
Companies with biggest federal contracts located in this zip code (COCOA BEACH, FL):
QUANTUM TECHNOLOGY SERVICES, I (1980 NORTH ATLANTIC AVE ,; small business) : $53,756,351 in 240 contractsfrom 1999 to 2006
Contracts for Other Professional Services, Maintenance, Repair or Alteration of Real Property -- Other Non-Building Facilities, Engineering and Technical Services, Services -- Management and Support (R&D), and moreby Air Force, Virginia Contracting Activity, U.S. Special Operations Command, Department of Defense, and others Signed by year:2000: $8,877,346; 2001: $7,707,724; 2002: $5,877,222; 2003: $7,667,321; 2004: $8,926,035; 2005: $8,943,212; 2006: $3,911,292.
Biggest contracts:
$2,378,000 with Air Force for Other Professional Services. Signed on 2001-10-23. Completion date: 2002-09-30.
$2,120,589 with Air Force for Maintenance, Repair or Alteration of Real Property -- Other Non-Building Facilities. Signed on 2000-10-16. Completion date: 2001-09-30.
$1,942,000 with Air Force for Other Professional Services. Signed on 2003-10-22. Completion date: 2007-09-30.
$1,940,000, same as above.Signed on 2004-10-26. Completion date: 2005-09-30.
CREATIVE MANAGEMENT TECHNOLOGY (320 N ATLANTIC AV, SUITE 3; small business) : $25,477,815 in 112 contractsfrom 1999 to 2004
Contracts for Custodial Janitorial Services, Maintenance, Repair or Alteration of Real Property -- Family Housing Facilities, Maintenance, Repair or Alteration of Real Property -- Miscellaneous Buildings, Other Professional Services, and moreby NASA, Air Force, Army Signed by year:2000: $6,636,372; 2001: $3,998,859; 2002: $5,639,004; 2003: $3,706,281; 2004: $417,252; 2005: $0; 2006: $0.
Biggest contracts:
$2,518,000 with NASA for Custodial Janitorial Services. Taking place in AL. Signed on 1999-11-15. Completion date: 2000-09-15.
$2,500,000, same as above.Signed on 2000-11-15. Completion date: 2001-09-15.
$1,490,529 with Air Force for Maintenance, Repair or Alteration of Real Property -- Family Housing Facilities. Signed on 2001-10-01. Completion date: 2002-09-30.
$1,484,069 with Air Force for Maintenance, Repair or Alteration of Real Property -- Miscellaneous Buildings. Taking place in AL. Signed on 1999-10-18. Completion date: 2000-09-30.
CITY OF COCOA BEACH (2 SOUTH ORLANDO AVE) : $4,341,779 in 7 contractsfrom 1999 to 2003
Contracts for Water Services, Other Utilities by Air Force Signed by year:2000: $352,947; 2001: $1,235,837; 2002: $1,332,743; 2003: $1,295,776; 2004: $0; 2005: $0; 2006: $0.
Biggest contracts:
$1,332,743 with Air Force for Water Services. Signed on 2002-09-30. Completion date: 2002-09-30.
$1,295,776 with Air Force for Other Utilities. Signed on 2003-10-01. Completion date: 2004-09-30.
$1,235,837 with Air Force for Water Services. Signed on 2001-09-30. Completion date: 2001-09-30.
$127,552, same as above.Signed on 2000-04-20. Completion date: 2000-09-30.
RURAL ELECTRONICS MISSISSIPPI, (1980 N ATLANTIC AVE , STE; small business) : $515,711 in 31 contractsfrom 2002 to 2004
Contracts for Passenger Motor Vehicles, Lease or Rental of Equipment -- Ground Effect Vehicles, Motor Vehicles, Trailers, and Cycles, Motor Passenger Services, Lease or Rental of Facilities -- Other Non-Building Facilities, and moreby EXECUTIVE OFFICE OF THE PRESIDENT, Army, Air Force, Department of Defense, and others Signed by year:2000: $0; 2001: $0; 2002: $221,457; 2003: $277,287; 2004: $16,967; 2005: $0; 2006: $0.
Biggest contracts:
$154,380 with EXECUTIVE OFFICE OF THE PRESIDENT for Passenger Motor Vehicles. Taking place in DC. Signed on 2003-03-15. Completion date: 2004-03-15.
$110,512 with Army for Lease or Rental of Equipment -- Ground Effect Vehicles, Motor Vehicles, Trailers, and Cycles. Taking place in WA. Signed on 2003-05-09. Completion date: 2003-08-31.
$59,600 with Air Force for Lease or Rental of Equipment -- Ground Effect Vehicles, Motor Vehicles, Trailers, and Cycles. Taking place in MO. Signed on 2002-10-01. Completion date: 2003-09-30.
$48,240 with Department of Defense for Lease or Rental of Equipment -- Ground Effect Vehicles, Motor Vehicles, Trailers, and Cycles. Taking place in NC. Signed on 2002-12-02. Completion date: 2003-12-31.
REID INDUSTRIES INC (1980 N ATLANTIC AVE, STE; small business) : $154,666 in 9 contractsfrom 2005 to 2006
Contracts for Lease or Rental of Equipment -- Ground Effect Vehicles, Motor Vehicles, Trailers, and Cycles, Motor Pool Operations, Trucks and Truck Tractors, Wheeled by Army, Air Force Signed by year:2000: $0; 2001: $0; 2002: $0; 2003: $0; 2004: $0; 2005: $153,139; 2006: $1,527.
Biggest contracts:
$37,800 with Army for Lease or Rental of Equipment -- Ground Effect Vehicles, Motor Vehicles, Trailers, and Cycles. Signed on 2005-11-22. Completion date: 2006-11-30.
$33,350 with Army for Motor Pool Operations. Taking place in CO. Signed on 2005-05-09. Completion date: 2005-06-10.
$29,248 with Air Force for Lease or Rental of Equipment -- Ground Effect Vehicles, Motor Vehicles, Trailers, and Cycles. Taking place in TX. Signed on 2005-07-16. Completion date: 2005-11-26.
$19,312 with Army for Motor Pool Operations. Taking place in CO. Signed on 2005-06-10. Completion date: 2005-06-27.
FALLER, WILLIAM (1860 N ATLANTIC AVE STE B7; small business) : $149,844 in 2 contractsfrom 2001 to 2002
$99,844 with Navy for Technical Assistance. Signed on 2001-06-22. Completion date: 2001-12-31.
$50,000 with Navy for Engineering and Technical Services. Signed on 2002-02-27. Completion date: 2002-12-31.
TEDAGOGICAL ASSOC INTERNATIONA (210 ROSE DR; small business)
$101,970 with Army for Medical/Psychiatric Consultation Services. Signed on 2005-09-27. Completion date: 2006-09-18.
SIX CONTINENTS HOTELS, INC (1300 N ATLANTIC AVE) : $7,215 in 3 contractsin 2005
$4,571 with Army for Lodging - Hotel/Motel. Signed on 2005-03-31. Completion date: 2005-04-17.
$2,780 with NASA for Lease or Rental of Equipment -- Training Aids and Devices. Signed on 2005-03-01. Effective on 2005-01-24. Completion date: 2005-03-15.
-$136 with Army for Lodging - Hotel/Motel. Signed on 2005-07-14. Completion date: 2005-04-17.
EXPRESS BADGING SERVICES INC (1980 N ATLANTIC AVE STE 72; small business)
$4,500 with Air Force for Badges and Insignia. Signed on 2006-04-26. Completion date: 2006-05-26.
COCOA BEACH HOTEL FUND LP (2080 N ATLANTIC AVE; small business) : $3,853 in 2 contractsin 2003
$4,188 with Army for Lodging - Hotel/Motel. Signed on 2003-03-14. Completion date: 2003-05-17.
-$335, same as above.Signed on 2003-07-02. Completion date: 2003-05-17.
Top industries in this zip code by the number of employees in 2005:
Other Services (except Public Administration): Other Similar Organizations (except Business, Professional, Labor, and Political Organizations) (50-99: 1, 20-49: 2, 10-19: 1, 5-9: 3, 1-4: 32)
Health Care and Social Assistance: Offices of Physicians (except Mental Health Specialists) (20-49: 2, 10-19: 2, 5-9: 9, 1-4: 11)
People in group quarters in 2010:
4 people in residential treatment centers for adults
People in group quarters in 2000:
22 people in other group homes
17 people in other noninstitutional group quarters
Fatal accident statistics in 2014:
Fatal accident count: 2
Vehicles involved in fatal accidents: 2
Fatal accidents caused by drunken drivers: 0
Fatalities: 2
Persons involved in fatal accidents: 2
Pedestrians involved in fatal accidents: 2
Fatal accident statistics in 2013:
Fatal accident count: 1
Vehicles involved in fatal accidents: 1
Fatal accidents caused by drunken drivers: 0
Fatalities: 2
Persons involved in fatal accidents: 1
Pedestrians involved in fatal accidents: 2
Home Mortgage Disclosure Act Aggregated Statistics For Year 2009 (Based on 18 partial tracts)
A) FHA, FSA/RHS & VA Home Purchase Loans
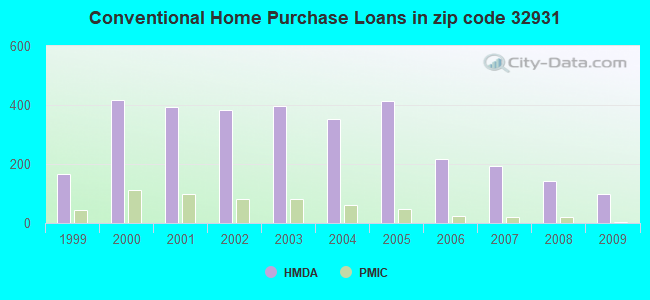
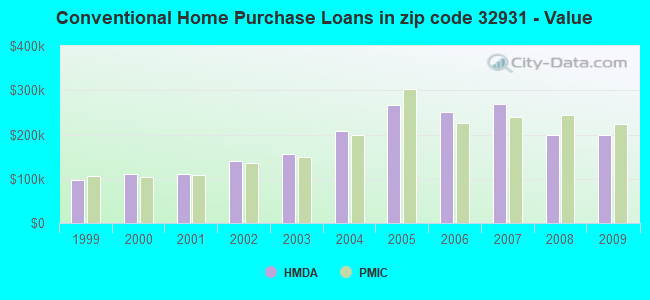
B) Conventional Home Purchase Loans
C) Refinancings
D) Home Improvement Loans
F) Non-occupant Loans on < 5 Family Dwellings (A B C & D)
Number
Average Value
Number
Average Value
Number
Average Value
Number
Average Value
Number
Average Value
LOANS ORIGINATED
5
$221,670
98
$197,838
165
$203,433
5
$159,898
112
$187,778
APPLICATIONS APPROVED, NOT ACCEPTED
0
$0
7
$153,499
24
$210,487
0
$0
12
$143,075
APPLICATIONS DENIED
2
$224,470
12
$222,809
104
$206,182
8
$35,105
54
$184,734
APPLICATIONS WITHDRAWN
1
$312,090
11
$174,514
39
$226,366
0
$0
16
$156,728
FILES CLOSED FOR INCOMPLETENESS
0
$0
4
$250,118
13
$224,370
0
$0
3
$408,900
Aggregated Statistics For Year 2008 (Based on 18 partial tracts)
A) FHA, FSA/RHS & VA Home Purchase Loans
B) Conventional Home Purchase Loans
C) Refinancings
D) Home Improvement Loans
E) Loans on Dwellings For 5+ Families
F) Non-occupant Loans on < 5 Family Dwellings (A B C & D)
Number
Average Value
Number
Average Value
Number
Average Value
Number
Average Value
Number
Average Value
Number
Average Value
LOANS ORIGINATED
4
$280,900
141
$199,881
92
$181,818
5
$103,766
1
$516,920
135
$178,164
APPLICATIONS APPROVED, NOT ACCEPTED
3
$116,130
9
$232,672
27
$213,461
1
$14,110
0
$0
16
$212,306
APPLICATIONS DENIED
9
$144,924
24
$271,847
65
$223,186
9
$129,019
1
$249,490
38
$201,608
APPLICATIONS WITHDRAWN
1
$301,620
23
$246,803
19
$280,600
2
$71,265
0
$0
18
$228,729
FILES CLOSED FOR INCOMPLETENESS
0
$0
5
$206,562
7
$238,854
0
$0
0
$0
6
$175,272
Aggregated Statistics For Year 2007 (Based on 18 partial tracts)
A) FHA, FSA/RHS & VA Home Purchase Loans
B) Conventional Home Purchase Loans
C) Refinancings
D) Home Improvement Loans
E) Loans on Dwellings For 5+ Families
F) Non-occupant Loans on < 5 Family Dwellings (A B C & D)
G) Loans On Manufactured Home Dwelling (A B C & D)
Number
Average Value
Number
Average Value
Number
Average Value
Number
Average Value
Number
Average Value
Number
Average Value
Number
Average Value
LOANS ORIGINATED
4
$192,450
193
$268,522
209
$224,400
14
$95,359
1
$711,790
191
$228,671
2
$159,420
APPLICATIONS APPROVED, NOT ACCEPTED
0
$0
26
$268,924
50
$217,364
4
$230,590
0
$0
24
$228,378
0
$0
APPLICATIONS DENIED
0
$0
41
$254,513
84
$249,627
15
$155,597
0
$0
56
$230,123
2
$32,065
APPLICATIONS WITHDRAWN
2
$115,440
24
$222,426
63
$262,233
3
$95,793
0
$0
26
$232,042
0
$0
FILES CLOSED FOR INCOMPLETENESS
0
$0
6
$204,733
18
$193,063
1
$210,360
0
$0
4
$95,285
0
$0
Aggregated Statistics For Year 2006 (Based on 18 partial tracts)
B) Conventional Home Purchase Loans
C) Refinancings
D) Home Improvement Loans
E) Loans on Dwellings For 5+ Families
F) Non-occupant Loans on < 5 Family Dwellings (A B C & D)
Number
Average Value
Number
Average Value
Number
Average Value
Number
Average Value
Number
Average Value
LOANS ORIGINATED
216
$249,861
233
$218,389
25
$113,332
1
$311,640
208
$226,704
APPLICATIONS APPROVED, NOT ACCEPTED
32
$242,981
55
$182,259
0
$0
0
$0
35
$205,391
APPLICATIONS DENIED
38
$220,436
92
$259,405
8
$121,926
1
$288,630
44
$266,839
APPLICATIONS WITHDRAWN
15
$277,707
77
$237,618
3
$164,727
0
$0
24
$223,800
FILES CLOSED FOR INCOMPLETENESS
13
$275,753
26
$200,296
1
$242,840
0
$0
15
$285,640
Aggregated Statistics For Year 2005 (Based on 18 partial tracts)
B) Conventional Home Purchase Loans
C) Refinancings
D) Home Improvement Loans
E) Loans on Dwellings For 5+ Families
F) Non-occupant Loans on < 5 Family Dwellings (A B C & D)
G) Loans On Manufactured Home Dwelling (A B C & D)
Number
Average Value
Number
Average Value
Number
Average Value
Number
Average Value
Number
Average Value
Number
Average Value
LOANS ORIGINATED
415
$266,479
323
$206,422
25
$129,183
3
$507,377
365
$240,911
0
$0
APPLICATIONS APPROVED, NOT ACCEPTED
38
$238,479
40
$231,257
5
$100,256
0
$0
23
$194,613
1
$67,690
APPLICATIONS DENIED
67
$256,652
89
$236,856
19
$91,603
0
$0
67
$220,975
3
$69,097
APPLICATIONS WITHDRAWN
55
$243,973
106
$197,283
5
$279,928
0
$0
43
$267,856
2
$187,820
FILES CLOSED FOR INCOMPLETENESS
13
$234,262
13
$198,175
3
$208,227
0
$0
14
$236,744
0
$0
Aggregated Statistics For Year 2004 (Based on 18 partial tracts)
B) Conventional Home Purchase Loans
C) Refinancings
D) Home Improvement Loans
E) Loans on Dwellings For 5+ Families
F) Non-occupant Loans on < 5 Family Dwellings (A B C & D)
G) Loans On Manufactured Home Dwelling (A B C & D)
Number
Average Value
Number
Average Value
Number
Average Value
Number
Average Value
Number
Average Value
Number
Average Value
LOANS ORIGINATED
352
$207,513
291
$160,500
25
$80,272
1
$394,300
303
$174,770
2
$38,840
APPLICATIONS APPROVED, NOT ACCEPTED
33
$230,825
49
$130,738
2
$36,670
0
$0
30
$159,663
0
$0
APPLICATIONS DENIED
65
$220,554
98
$172,622
15
$62,332
0
$0
58
$203,925
0
$0
APPLICATIONS WITHDRAWN
42
$180,202
80
$160,074
4
$27,228
0
$0
33
$178,002
0
$0
FILES CLOSED FOR INCOMPLETENESS
16
$191,615
13
$171,884
0
$0
0
$0
10
$151,931
0
$0
Aggregated Statistics For Year 2003 (Based on 18 partial tracts)
A) FHA, FSA/RHS & VA Home Purchase Loans
B) Conventional Home Purchase Loans
C) Refinancings
D) Home Improvement Loans
F) Non-occupant Loans on < 5 Family Dwellings (A B C & D)
Number
Average Value
Number
Average Value
Number
Average Value
Number
Average Value
Number
Average Value
LOANS ORIGINATED
8
$97,651
398
$156,421
755
$133,456
13
$42,538
394
$134,992
APPLICATIONS APPROVED, NOT ACCEPTED
0
$0
21
$193,887
84
$122,197
3
$38,213
29
$123,242
APPLICATIONS DENIED
0
$0
35
$149,223
98
$138,398
15
$38,913
49
$126,731
APPLICATIONS WITHDRAWN
0
$0
39
$158,229
115
$133,153
0
$0
38
$156,307
FILES CLOSED FOR INCOMPLETENESS
0
$0
5
$101,690
26
$161,313
0
$0
7
$134,510
Aggregated Statistics For Year 2002 (Based on 18 partial tracts)
A) FHA, FSA/RHS & VA Home Purchase Loans
B) Conventional Home Purchase Loans
C) Refinancings
D) Home Improvement Loans
F) Non-occupant Loans on < 5 Family Dwellings (A B C & D)
Number
Average Value
Number
Average Value
Number
Average Value
Number
Average Value
Number
Average Value
LOANS ORIGINATED
7
$118,423
382
$139,578
444
$115,503
16
$39,826
296
$116,591
APPLICATIONS APPROVED, NOT ACCEPTED
0
$0
28
$192,586
53
$99,666
8
$38,951
19
$102,454
APPLICATIONS DENIED
0
$0
30
$99,358
65
$108,221
12
$29,662
29
$79,715
APPLICATIONS WITHDRAWN
1
$117,090
28
$125,144
62
$98,700
2
$44,020
24
$102,186
FILES CLOSED FOR INCOMPLETENESS
0
$0
8
$144,228
13
$158,593
0
$0
5
$128,586
Aggregated Statistics For Year 2001 (Based on 18 partial tracts)
A) FHA, FSA/RHS & VA Home Purchase Loans
B) Conventional Home Purchase Loans
C) Refinancings
D) Home Improvement Loans
E) Loans on Dwellings For 5+ Families
F) Non-occupant Loans on < 5 Family Dwellings (A B C & D)
Number
Average Value
Number
Average Value
Number
Average Value
Number
Average Value
Number
Average Value
Number
Average Value
LOANS ORIGINATED
10
$112,034
394
$111,530
345
$116,972
15
$32,343
2
$530,795
268
$104,774
APPLICATIONS APPROVED, NOT ACCEPTED
0
$0
27
$88,641
33
$83,206
6
$78,103
0
$0
14
$83,478
APPLICATIONS DENIED
1
$101,790
39
$119,940
64
$109,164
8
$30,994
0
$0
28
$96,670
APPLICATIONS WITHDRAWN
0
$0
29
$125,597
68
$108,997
4
$19,182
0
$0
18
$96,881
FILES CLOSED FOR INCOMPLETENESS
2
$107,195
3
$189,390
18
$109,231
0
$0
0
$0
6
$92,938
Aggregated Statistics For Year 2000 (Based on 18 partial tracts)
A) FHA, FSA/RHS & VA Home Purchase Loans
B) Conventional Home Purchase Loans
C) Refinancings
D) Home Improvement Loans
E) Loans on Dwellings For 5+ Families
F) Non-occupant Loans on < 5 Family Dwellings (A B C & D)
Number
Average Value
Number
Average Value
Number
Average Value
Number
Average Value
Number
Average Value
Number
Average Value
LOANS ORIGINATED
9
$91,589
417
$109,719
91
$87,909
14
$26,056
1
$430,500
193
$104,676
APPLICATIONS APPROVED, NOT ACCEPTED
0
$0
33
$102,229
17
$97,381
10
$25,726
0
$0
20
$99,920
APPLICATIONS DENIED
1
$130,680
49
$84,868
49
$114,807
9
$47,832
0
$0
14
$72,592
APPLICATIONS WITHDRAWN
2
$76,670
23
$140,116
37
$84,291
5
$41,010
0
$0
5
$87,640
FILES CLOSED FOR INCOMPLETENESS
0
$0
6
$173,743
10
$87,957
0
$0
0
$0
2
$297,420
Aggregated Statistics For Year 1999 (Based on 9 partial tracts)
A) FHA, FSA/RHS & VA Home Purchase Loans
B) Conventional Home Purchase Loans
C) Refinancings
D) Home Improvement Loans
E) Loans on Dwellings For 5+ Families
F) Non-occupant Loans on < 5 Family Dwellings (A B C & D)
2002 - 2018 National Fire Incident Reporting System (NFIRS) incidents
According to the data from the years 2002 - 2018 the average number of fires per year is 50. The highest number of reported fires - 83 took place in 2003, and the least - 20 in 2015. The data has a declining trend.
When looking into fire subcategories, the most incidents belonged to: Outside Fires (44.7%), and Structure Fires (37.9%).
Fire incident types reported to NFIRS in Zip Code 32931


 Nearest zip codes: 32952, 32920, 32925, 32955, 32922, 32953.
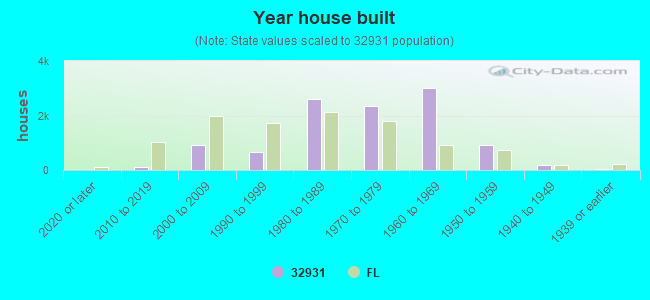


 According to the data from the years 2002 - 2018 the average number of fires per year is 50. The highest number of reported fires - 83 took place in 2003, and the least - 20 in 2015. The data has a declining trend.
 When looking into fire subcategories, the most incidents belonged to: Outside Fires (44.7%), and Structure Fires (37.9%).