Estimated zip code population in 2022: 33,875 Zip code population in 2010: 26,108 Zip code population in 2000: 20,541
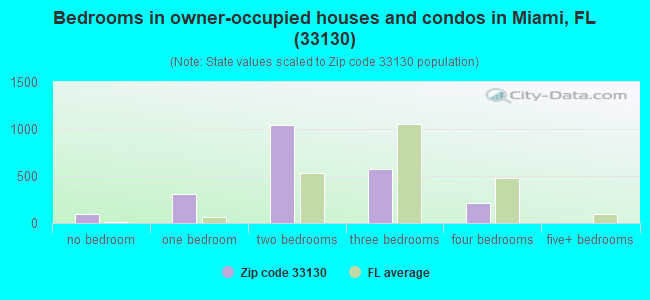
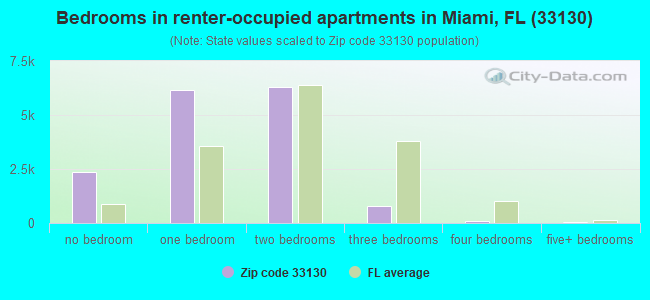
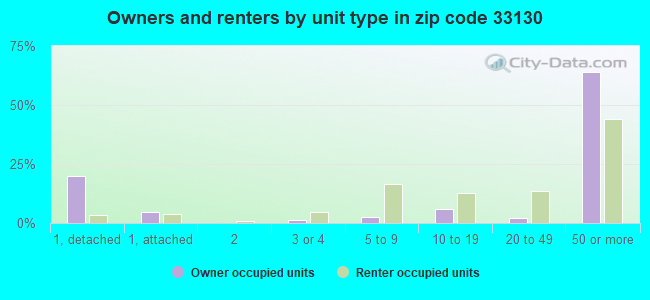
Houses and condos: 20,595 Renter-occupied apartments: 15,485
% of renters here:
87%
State:
33%
March 2022 cost of living index in zip code 33130: 107.9 (more than average, U.S. average is 100)
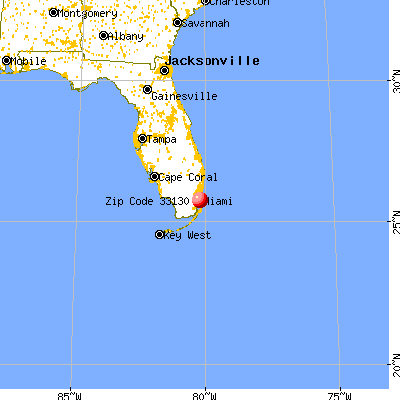
Land area: 1.1 sq. mi. Water area: 0.0 sq. mi.
Population density: 30,712 people per square mile
(very high).
OSM Map
General Map
Google Map
MSN Map
OSM Map
General Map
Google Map
MSN Map
OSM Map
General Map
Google Map
MSN Map
OSM Map
General Map
Google Map
MSN Map
Please wait while loading the map...
Real estate property taxes paid for housing units in 2022:
This zip code:
1.0% ($5,390)
Florida:
0.7% ($2,529)
Median real estate property taxes paid for housing units with mortgages in 2022: $5,345 (1.0%) Median real estate property taxes paid for housing units with no mortgage in 2022: $5,499 (1.0%)
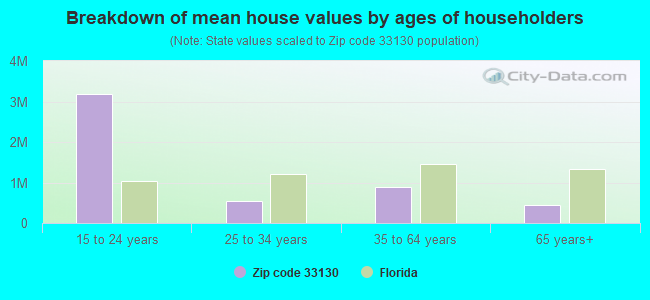
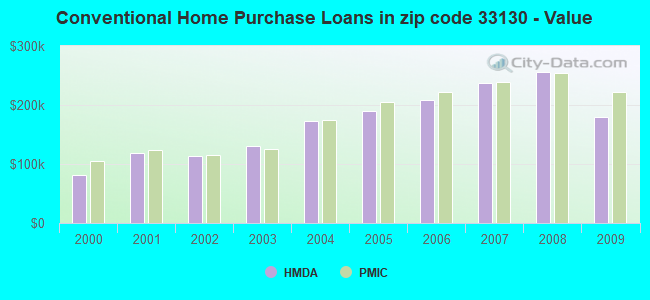
Estimated median house/condo value in 2022: $528,363
33130:
$528,363
Florida:
$354,100
According to our research of Florida and other state lists, there were 10 registered sex offenders living in 33130 zip code as of April 27, 2024. The ratio of all residents to sex offenders in zip code 33130 is 2,587 to 1. The ratio of registered sex offenders to all residents in this zip code is much lower than the state average.
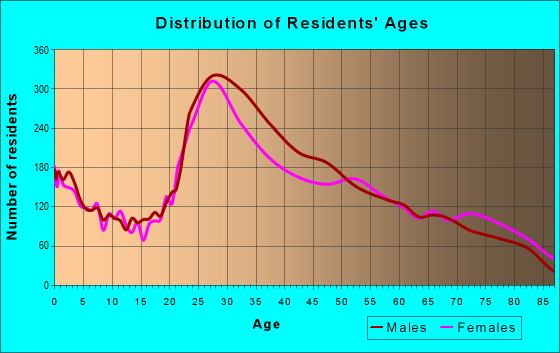
Median resident age:
This zip code:
38.2 years
Florida median age:
42.7 years
Average household size:
This zip code:
1.9 people
Florida:
2.5 people
Averages for the 2020 tax year for zip code 33130, filed in 2021:
Average Adjusted Gross Income (AGI) in 2020: $68,042 (Individual Income Tax Returns)
Here:
$68,042
State:
$82,200
Salary/wage: $64,993 (reported on 77.1% of returns)
Here:
$64,993
State:
$58,347
(% of AGI for various income ranges: 1128.7% for AGIs below $25k, 3817.0% for AGIs $25k-50k, 7328.6% for AGIs $50k-75k, 11247.6% for AGIs $75k-100k, 20996.7% for AGIs $100k-200k, 109648.1% for AGIs over 200k)
Taxable interest for individuals: $2,588 (reported on 15.5% of returns)
This zip code:
$2,588
Florida:
$4,272
(% of AGI for various income ranges: 5.4% for AGIs below $25k, 12.1% for AGIs $25k-50k, 22.8% for AGIs $50k-75k, 46.6% for AGIs $75k-100k, 123.5% for AGIs $100k-200k, 1630.0% for AGIs over 200k)
Ordinary dividends: $5,730 (reported on 14.2% of returns)
Here:
$5,730
State:
$15,863
(% of AGI for various income ranges: 7.5% for AGIs below $25k, 14.0% for AGIs $25k-50k, 33.5% for AGIs $50k-75k, 151.1% for AGIs $75k-100k, 206.8% for AGIs $100k-200k, 3541.2% for AGIs over 200k)
Net capital gain/loss in AGI: +$33,735 (reported on 16.1% of returns)
Here:
+$33,735
State:
+$62,983
(% of AGI for various income ranges: 9.5% for AGIs below $25k, 30.7% for AGIs $25k-50k, 59.1% for AGIs $50k-75k, 213.0% for AGIs $75k-100k, 660.1% for AGIs $100k-200k, 30688.5% for AGIs over 200k)
Profit/loss from business: +$9,593 (reported on 38.1% of returns)
Here:
+$9,593
State:
+$9,719
(% of AGI for various income ranges: 408.9% for AGIs below $25k, 197.7% for AGIs $25k-50k, 237.7% for AGIs $50k-75k, 410.8% for AGIs $75k-100k, 789.9% for AGIs $100k-200k, 7931.5% for AGIs over 200k)
Taxable individual retirement arrangement distribution: $21,979 (reported on 1.2% of returns)
33130:
$21,979
Florida:
$24,823
(% of AGI for various income ranges: 4.8% for AGIs below $25k, 9.5% for AGIs $25k-50k, 24.5% for AGIs $50k-75k, 53.6% for AGIs $75k-100k, 197.0% for AGIs $100k-200k, 453.1% for AGIs over 200k)
Self-employed (Keogh) retirement plans: $29,783 (reported on 0.4% of returns)
33130:
$29,783
Florida:
$29,694
(% of AGI for various income ranges: 31.0% for AGIs $50k-75k, 519.2% for AGIs over 200k)
Total itemized deductions: $31,087 (reported on 4.7% of returns)
Here:
$31,087
State:
$45,393
(% of AGI for various income ranges: 18.4% for AGIs below $25k, 96.6% for AGIs $25k-50k, 189.6% for AGIs $50k-75k, 268.8% for AGIs $75k-100k, 571.1% for AGIs $100k-200k, 4017.7% for AGIs over 200k)
Charity contributions: $10,391 (reported on 3.2% of returns)
Here:
$10,391
State:
$20,178
(% of AGI for various income ranges: 2.0% for AGIs below $25k, 8.5% for AGIs $25k-50k, 27.7% for AGIs $50k-75k, 48.9% for AGIs $75k-100k, 104.5% for AGIs $100k-200k, 1338.8% for AGIs over 200k)
Taxes paid: $8,495 (reported on 4.4% of returns)
33130:
$8,495
State:
$6,967
(% of AGI for various income ranges: 4.2% for AGIs below $25k, 35.2% for AGIs $25k-50k, 64.1% for AGIs $50k-75k, 71.4% for AGIs $75k-100k, 182.2% for AGIs $100k-200k, 732.7% for AGIs over 200k)
Earned income credit: $1,895 (reported on 24.4% of returns)
Here:
$1,895
State:
$2,306
(% of AGI for various income ranges: 122.2% for AGIs below $25k, 50.8% for AGIs $25k-50k)
Percentage of individuals using paid preparers for their 2020 taxes: 89.1%
Here:
89%
State:
92%
(% for various income ranges: 83.8% for AGIs below $25k, 92.2% for AGIs $25k-50k, 93.6% for AGIs $50k-75k, 94.6% for AGIs $75k-100k, 94.2% for AGIs $100k-200k, 94.5% for AGIs over 200k)
Averages for the 2012 tax year for zip code 33130, filed in 2013:
Average Adjusted Gross Income (AGI) in 2012: $38,642 (Individual Income Tax Returns)
Here:
$38,642
State:
$60,316
Salary/wage: $36,131 (reported on 80.0% of returns)
Here:
$36,131
State:
$45,277
(% of AGI for various income ranges: 76.2% for AGIs below $25k, 93.6% for AGIs $25k-50k, 92.7% for AGIs $50k-75k, 92.9% for AGIs $75k-100k, 88.3% for AGIs $100k-200k, 33.4% for AGIs over 200k)
Taxable interest for individuals: $1,229 (reported on 10.8% of returns)
This zip code:
$1,229
Florida:
$3,587
(% of AGI for various income ranges: 0.3% for AGIs below $25k, 0.2% for AGIs $25k-50k, 0.2% for AGIs $50k-75k, 0.8% for AGIs $75k-100k, 0.2% for AGIs $100k-200k, 0.5% for AGIs over 200k)
Ordinary dividends: $6,874 (reported on 5.6% of returns)
Here:
$6,874
State:
$12,831
(% of AGI for various income ranges: 0.8% for AGIs below $25k, 0.7% for AGIs $25k-50k, 0.8% for AGIs $50k-75k, 0.4% for AGIs $75k-100k, 1.1% for AGIs $100k-200k, 1.7% for AGIs over 200k)
Net capital gain/loss in AGI: +$10,030 (reported on 5.0% of returns)
Here:
+$10,030
State:
+$33,493
(% of AGI for various income ranges: 0.2% for AGIs $25k-50k, 0.6% for AGIs $50k-75k, 0.5% for AGIs $75k-100k, 1.0% for AGIs $100k-200k, 4.0% for AGIs over 200k)
Profit/loss from business: +$6,851 (reported on 31.4% of returns)
Here:
+$6,851
State:
+$10,012
(% of AGI for various income ranges: 19.9% for AGIs below $25k, 3.0% for AGIs $25k-50k, 2.7% for AGIs $50k-75k, 1.5% for AGIs $75k-100k, 3.6% for AGIs $100k-200k, 1.1% for AGIs over 200k)
Taxable individual retirement arrangement distribution: $11,350 (reported on 1.1% of returns)
33130:
$11,350
Florida:
$21,544
(% of AGI for various income ranges: 0.2% for AGIs below $25k, 0.2% for AGIs $25k-50k, 0.4% for AGIs $50k-75k, 1.2% for AGIs $100k-200k)
Self-employment retirement plans: $8,075 (reported on 0.3% of returns)
33130:
$8,075
Florida:
$20,611
Total itemized deductions: $18,800 (21% of AGI, reported on 13.8% of returns)
Here:
$18,800
State:
$25,533
Here:
21.3% of AGI
State:
18.0% of AGI
(% of AGI for various income ranges: 4.2% for AGIs below $25k, 9.4% for AGIs $25k-50k, 8.4% for AGIs $50k-75k, 8.4% for AGIs $75k-100k, 7.1% for AGIs $100k-200k, 4.7% for AGIs over 200k)
Charity contributions: $3,077 (reported on 9.2% of returns)
Here:
$3,077
State:
$5,698
(% of AGI for various income ranges: 0.2% for AGIs below $25k, 0.8% for AGIs $25k-50k, 0.8% for AGIs $50k-75k, 1.3% for AGIs $75k-100k, 0.7% for AGIs $100k-200k, 0.9% for AGIs over 200k)
Taxes paid: $4,195 (reported on 12.2% of returns)
33130:
$4,195
State:
$6,203
(% of AGI for various income ranges: 0.5% for AGIs below $25k, 1.1% for AGIs $25k-50k, 1.1% for AGIs $50k-75k, 1.4% for AGIs $75k-100k, 1.8% for AGIs $100k-200k, 1.9% for AGIs over 200k)
Earned income credit: $2,151 (reported on 32.6% of returns)
Here:
$2,151
State:
$2,372
(% of AGI for various income ranges: 9.0% for AGIs below $25k, 0.8% for AGIs $25k-50k)
Percentage of individuals using paid preparers for their 2012 taxes: 62.9%
Here:
63%
State:
54%
(% for various income ranges: 64.3% for AGIs below $25k, 58.7% for AGIs $25k-50k, 61.0% for AGIs $50k-75k, 61.7% for AGIs $75k-100k, 63.8% for AGIs $100k-200k, 81.2% for AGIs over 200k)
Averages for the 2004 tax year for zip code 33130, filed in 2005:
Average Adjusted Gross Income (AGI) in 2004: $23,755 (Individual Income Tax Returns)
Here:
$23,755
State:
$50,523
Salary/wage: $21,953 (reported on 79.2% of returns)
Here:
$21,953
State:
$39,563
(% of AGI for various income ranges: 74.8% for AGIs below $10k, 86.2% for AGIs $10k-25k, 95.3% for AGIs $25k-50k, 86.2% for AGIs $50k-75k, 86.6% for AGIs $75k-100k, 30.3% for AGIs over 100k)
Taxable interest for individuals: $1,511 (reported on 13.8% of returns)
This zip code:
$1,511
Florida:
$3,211
(% of AGI for various income ranges: 1.6% for AGIs below $10k, 0.5% for AGIs $10k-25k, 0.4% for AGIs $25k-50k, 0.9% for AGIs $50k-75k, 0.5% for AGIs $75k-100k, 1.6% for AGIs over 100k)
Taxable dividends: $8,815 (reported on 3.7% of returns)
Here:
$8,815
State:
$6,129
(% of AGI for various income ranges: 0.7% for AGIs below $10k, 0.2% for AGIs $10k-25k, 0.3% for AGIs $25k-50k, 1.5% for AGIs $50k-75k, 1.2% for AGIs $75k-100k, 3.9% for AGIs over 100k)
Net capital gain/loss: +$42,610 (reported on 3.4% of returns)
Here:
+$42,610
State:
+$27,205
(% of AGI for various income ranges: 0.0% for AGIs below $10k, -0.1% for AGIs $10k-25k, -0.0% for AGIs $25k-50k, 1.7% for AGIs $50k-75k, 1.0% for AGIs $75k-100k, 22.2% for AGIs over 100k)
Profit/loss from business: +$6,721 (reported on 29.9% of returns)
Here:
+$6,721
State:
+$10,634
(% of AGI for various income ranges: 57.7% for AGIs below $10k, 11.4% for AGIs $10k-25k, 2.2% for AGIs $25k-50k, 3.5% for AGIs $50k-75k, 0.7% for AGIs $75k-100k, 3.9% for AGIs over 100k)
IRA payment deduction: $2,144 (reported on 1.2% of returns)
33130:
$2,144
Florida:
$3,082
Total itemized deductions: $16,134 (24% of AGI, reported on 13.5% of returns)
Here:
$16,134
State:
$20,370
Here:
23.6% of AGI
State:
20.7% of AGI
(% of AGI for various income ranges: 6.5% for AGIs below $10k, 8.7% for AGIs $10k-25k, 13.0% for AGIs $25k-50k, 12.8% for AGIs $50k-75k, 10.7% for AGIs $75k-100k, 5.0% for AGIs over 100k)
Charity contributions deductions: $2,158 (3% of AGI, reported on 10.1% of returns)
Here:
$2,158
State:
$4,064
Here:
3.1% of AGI
State:
3.8% of AGI
(% of AGI for various income ranges: 0.1% for AGIs below $10k, 0.5% for AGIs $10k-25k, 1.0% for AGIs $25k-50k, 1.2% for AGIs $50k-75k, 1.0% for AGIs $75k-100k, 1.3% for AGIs over 100k)
Total tax: $3,372 (reported on 66.6% of returns)
33130:
$3,372
State:
$9,431
(% of AGI for various income ranges: 8.8% for AGIs below $10k, 3.9% for AGIs $10k-25k, 6.1% for AGIs $25k-50k, 10.3% for AGIs $50k-75k, 14.1% for AGIs $75k-100k, 17.8% for AGIs over 100k)
Earned income credit: $1,806 (reported on 41.4% of returns)
Here:
$1,806
State:
$1,808
Percentage of individuals using paid preparers for their 2004 taxes: 71.6%
Here:
72%
State:
60%
(% for various income ranges: 70.2% for AGIs below $10k, 75.0% for AGIs $10k-25k, 68.6% for AGIs $25k-50k, 66.8% for AGIs $50k-75k, 48.4% for AGIs $75k-100k, 76.9% for AGIs over 100k)
Likely homosexual households (counted as self-reported same-sex unmarried-partner households)
Lesbian couples: 0.0% of all households
Gay men: 0.2% of all households
Household received Food Stamps/SNAP in the past 12 months: 4,531 Household did not receive Food Stamps/SNAP in the past 12 months: 13,182
Women who had a birth in the past 12 months: 288 (246 now married, 49 unmarried) Women who did not have a birth in the past 12 months: 8,195 (2,678 now married, 5,514 unmarried)
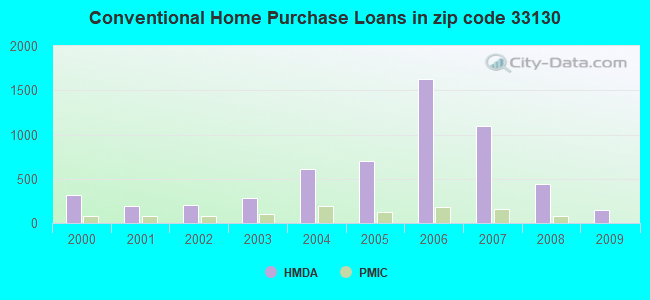
Housing units in zip code 33130 with a mortgage: 1,674 (206 second mortgage, 19 home equity loan, 102 both second mortgage and home equity loan) Houses without a mortgage: 50
Median monthly owner costs for units with a mortgage: $2,679 Median monthly owner costs for units without a mortgage: $1,275
Residents with income below the poverty level in 2022:
This zip code:
21.4%
Whole state:
12.7%
Residents with income below 50% of the poverty level in 2022:
This zip code:
13.9%
Whole state:
6.6%
Median number of rooms in houses and condos:
Here:
4.2
State:
5.9
Median number of rooms in apartments:
Here:
3.3
State:
4.2
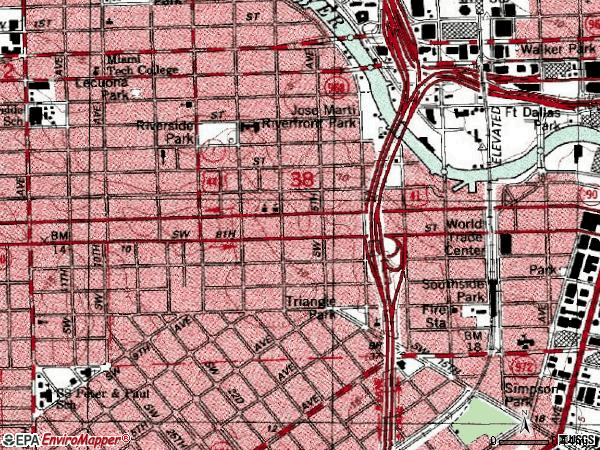
Notable locations in this zip code not listed on our city pages
Notable locations in zip code 33130: Miami Avenue Station (A), Financial District Station (B), Eighth Street Station (C), Brickell Station (D), Tenth Street-Promenade Station (E), Third Street Station (F), Miami Hispanic Ballet and Creation Art Center (G), Charlton W Tebeau Library of Florida History (H), Miami - Dade County Law Library (I), Miami Dade Cultural Center (J), Miami - Dade County Historical Museum of Southern Florida (K), Museum of the Americas (L), Sagrada Familia Child Care Center (M), Rainbow Day Care Center (N), Rainbow Little Havana Day Care Center (O), Renacer Day Care Center (P), Miami Art Museum (Q), Miami Dade County Main Library (R), Miami East Havana Network Police Station (S), Historical Museum of South Florida (T). Display/hide their locations on the map
Parks in zip code 33130 include: Southside Park (1), Jose Marti Riverfront Park (2), Lecuona Park (3), Walker Park (4), Riverside Park (5). Display/hide their locations on the map
2,118 married couples with children.
1,202 single-parent households (178 men, 1,024 women).
22.0% of residents of 33130 zip code speak English at home.
72.7% of residents speak Spanish at home (42% very well, 15% well, 24% not well, 18% not at all).
3.8% of residents speak other Indo-European language at home (90% very well, 6% well, 4% not well, 1% not at all).
1.1% of residents speak Asian or Pacific Island language at home (65% very well, 27% well, 7% not well).
1.2% of residents speak other language at home (96% very well, 4% well).
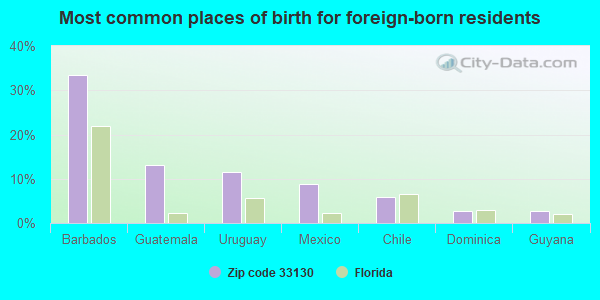
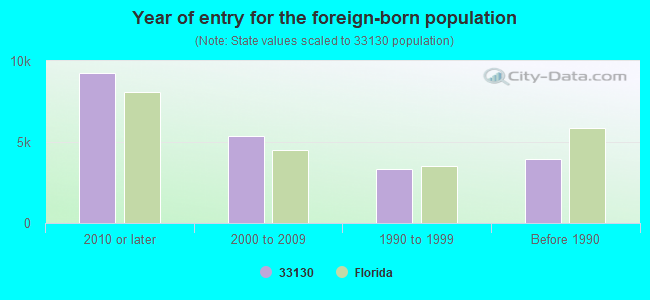
Foreign born population: 20,673 (61.0%) (43.0% of them are naturalized citizens)
Major facilities with environmental interests located in this zip code:
RIVERSIDE ELEMENTARY SCHOOL (1190 S.W. 2ND STREET in MIAMI, FL)
(National Center for Education Statistics) - STATE ID-4681 Small Quantity Generators, between 100 kg and 1000 kg of hazardous waste/month (Resource Conservation and Recovery Act (tracking hazardous waste)) - notification Organizations: SYLVIA CORDERO, PRINCIPAL (CONTACT/OWNER)
, DADE COUNTY SCHOOL DISTRICT (SCHOOL DISTRICT)
Alternative names: DADE CO RIVERSIDE ELEMENTARY
SOUTHSIDE ELEMENTARY SCHOOL (45 S.W. 13TH STREET in MIAMI, FL)
(National Center for Education Statistics) - STATE ID-5321 Small Quantity Generators, between 100 kg and 1000 kg of hazardous waste/month (Resource Conservation and Recovery Act (tracking hazardous waste)) - notification Organizations: PATRICK DOYLE, PRINCIPAL (CONTACT/OWNER)
, DADE COUNTY SCHOOL DISTRICT (SCHOOL DISTRICT)
Alternative names: DADE CO SOUTHSIDE ELEMENTARY
MATER ACADEMY EAST CHARTER SCHOOL (450 SW 4TH STREET in MIAMI, FL)
(National Center for Education Statistics) - STATE ID-3100 Organizations: DADE COUNTY SCHOOL DISTRICT (SCHOOL DISTRICT)
HOUSE OF RADIATORS (725 WEST FLAGLER STREET in MIAMI, FL)
National Pollutant Discharge Elimination System NON-MAJOR (Tracking pollutant discharge elimination systems) - permit Organizations: ROBERT BAER (CONTACT/OWNER)
NEW BRANCH CORP (99 SW 7TH ST in MIAMI, FL)
AIR MINOR (AIRS/AFS) Small Quantity Generators, between 100 kg and 1000 kg of hazardous waste/month (Resource Conservation and Recovery Act (tracking hazardous waste)) - notification Business SIC classification: DRYCLEANING PLANTS, EXCEPT RUG CLEANING Organizations: RICHARDO GONZALEZ, MGR (CONTACT/OWNER)
Alternative names: KEYES, MAC JONES INC
LATITUDE ON THE RIVER (615 SW 2ND AVE in MIAMI, FL)
National Pollutant Discharge Elimination System NON-MAJOR (Tracking pollutant discharge elimination systems) - permit Organizations: STEVE GELB (CONTACT/OWNER)
LUIS VENTURA BODY SHOP (1128 SW 8TH ST in MIAMI, FL)
(Resource Conservation and Recovery Act (tracking hazardous waste)) Organizations: LUIS VENTURA, OWNER (CONTACT/OWNER)
MARY BRICKELL VILLAGE (900 S MIAMI AVE in MIAMI, FL)
National Pollutant Discharge Elimination System NON-MAJOR (Tracking pollutant discharge elimination systems) - permit Organizations: DEAN BALANEY (CONTACT/OWNER)
METRO MOVER MAINTENANCE (101 SW 1ST AVE in MIAMI, FL)
(Resource Conservation and Recovery Act (tracking hazardous waste)) Organizations: JOSEPH DECARO (CONTACT/OWNER)
MIAMI SHIPYARD CORP (615 SW 2ND AVE in MIAMI, FL)
(Resource Conservation and Recovery Act (tracking hazardous waste)) Organizations: JOHN CUNNINGHAM, SUPER (CONTACT/OWNER)
NEO WIND (40 SW 3RD ST in MIAMI, FL)
National Pollutant Discharge Elimination System NON-MAJOR (Tracking pollutant discharge elimination systems) - permit Organizations: STEVE SILVERMAN (CONTACT/OWNER)
ONE MIAMI RESIDENTIAL DEVELOPM (BISCAYNE BLVD & SE 4TH STREET in MIAMI, FL)
National Pollutant Discharge Elimination System NON-MAJOR (Tracking pollutant discharge elimination systems) - permit Organizations: ROBERT SIMONS (CONTACT/OWNER)
Housing units lacking complete plumbing facilities: 0.6% Housing units lacking complete kitchen facilities: 0.9%
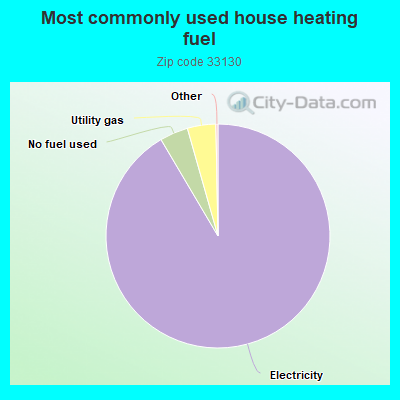
91.6%Electricity
4.1%No fuel used
4.1%Utility gas
Population in 1990: 21,777.
Place of birth for U.S.-born residents:
This state: 7,040
Northeast: 2,508
Midwest: 683
South: 1,921
West: 387
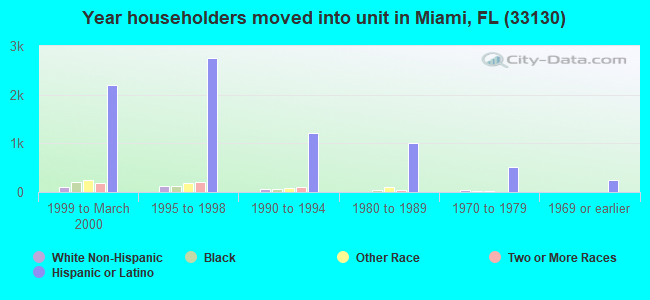
54% of the 33130 zip code residents lived in the same house 5 years ago. Out of people who lived in different houses, 91% lived in this county. Out of people who lived in different counties, 50% lived in Florida.
81% of the 33130 zip code residents lived in the same house 1 year ago. Out of people who lived in different houses, 54% moved from this county. Out of people who lived in different houses, 8% moved from different county within same state. Out of people who lived in different houses, 16% moved from different state. Out of people who lived in different houses, 19% moved from abroad.
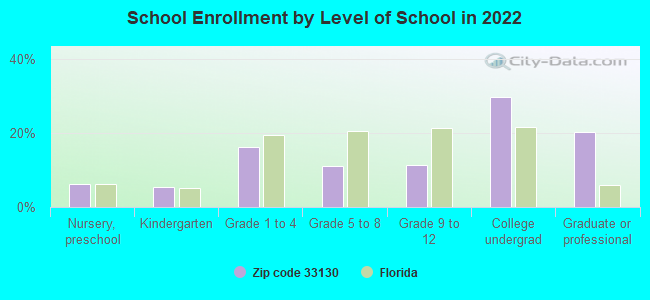
Private vs. public school enrollment:
Students in private schools in grades 1 to 8 (elementary and middle school): 165
Here:
10.5%
Florida:
15.8%
Students in private schools in grades 9 to 12 (high school):
Here:
0.0%
Florida:
12.9%
Students in private undergraduate colleges: 249
Here:
14.8%
Florida:
23.6%
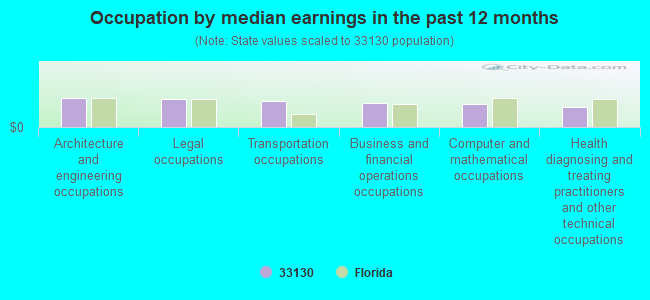
Occupation by median earnings in the past 12 months ($)
102,272Architecture and engineering occupations
96,775Legal occupations
90,698Transportation occupations
84,382Business and financial operations occupations
80,843Computer and mathematical occupations
71,149Health diagnosing and treating practitioners and other technical occupations
Companies with federal contracts located in this zip code (MIAMI, FL):
KIRA,INC (155 S MIAMI AVE , STE 620; small business) : $120,593,024 in 3500 contractsfrom 1999 to 2006
Contracts for Facilities Operations Support Services, Maintenance, Repair or Alteration of Real Property -- Family Housing Facilities, Operation of Government-Owned Facilities -- Family Housing Facilities, Other Housekeeping Services, and moreby Navy, Air Force, Army, ENERGY, Department of, and others Signed by year:2000: $6,280,159; 2001: $13,449,516; 2002: $17,669,080; 2003: $24,879,698; 2004: $26,533,153; 2005: $18,137,671; 2006: $10,160,213.
Biggest contracts:
$7,329,015 with Navy for Facilities Operations Support Services. Signed on 2004-11-08. Completion date: 2004-12-31.
$7,015,160, same as above.Signed on 2003-12-05. Completion date: 2004-12-31.
$3,804,679 with Navy for Maintenance, Repair or Alteration of Real Property -- Family Housing Facilities. Taking place in CA. Signed on 2005-08-01. Completion date: 2006-07-31.
$3,385,040, same as above.Signed on 2004-08-01. Completion date: 2005-07-31.
ALSTOM POWER CONVERSION USA IN (155 SOUTH MIAMI AVE , STE; small business) : $305,784 in 19 contractsfrom 2004 to 2006
Contracts for Non-nuclear Ship Repair (West) Ship repair (including overhauls and conversions) performed on. non-nuclear propelled and nonpropelled ships west of the 108th meridian, Cable, Cord, and Wire Assemblies: Communications Equipment, Non-nuclear Ship Repair (East) Ship repair (including overhauls and conversions) performed on non-nuclear propelled and nonpropelled ships east of the 108th meridian, Miscellaneous Electrical and Electronic Components, and moreby Navy, Defense Logistics Agency Signed by year:2000: $0; 2001: $0; 2002: $0; 2003: $0; 2004: $16,916; 2005: $179,824; 2006: $109,044.
Biggest contracts:
$59,695 with Navy for Non-nuclear Ship Repair (West) Ship repair (including overhauls and conversions) performed on. non-nuclear propelled and nonpropelled ships west of the 108th meridian. Signed on 2006-01-31. Completion date: 2006-02-20.
$45,454, same as above.Signed on 2005-12-06. Completion date: 2005-12-28.
$40,011 with Navy for Non-nuclear Ship Repair (West) Ship repair (including overhauls and conversions) performed on. non-nuclear propelled and nonpropelled ships west of the 108th meridian. Taking place in HI. Signed on 2005-11-22. Completion date: 2005-12-01.
$40,000 with Navy for Non-nuclear Ship Repair (West) Ship repair (including overhauls and conversions) performed on. non-nuclear propelled and nonpropelled ships west of the 108th meridian. Taking place in CA. Signed on 2005-01-10. Completion date: 2005-01-10.
cITY OF MIAMI - EMS (444 SW 2ND AVE) : $35,597 in 69 contractsfrom 2004 to 2006
Contracts for Other Medical Services by Bureau of Prisoners/Federal Prison System Signed by year:2000: $0; 2001: $0; 2002: $0; 2003: $0; 2004: $2,741; 2005: $27,156; 2006: $5,700.
Biggest contracts:
$1,000 with Bureau of Prisoners/Federal Prison System for Other Medical Services. Signed on 2005-09-06. Effective on 2005-09-03. Completion date: 2005-09-30.
$1,000, same as above.Signed on 2005-09-12. Completion date: 2005-09-30.
$1,000, same as above.Signed on 2005-09-19. Effective on 2005-09-14. Completion date: 2005-09-30.
$1,000, same as above.Signed on 2005-09-06. Effective on 2005-09-02. Completion date: 2005-09-30.
NCI CONSTRUCTION CO (130 SW 8TH STREET #200; small business) : $8,370 in 2 contractsin 2003
$8,370 with Navy for Construction of Structures and Facilities -- Office Buildings. Signed on 2003-07-17. Completion date: 2003-08-15.
$0, same as above.Signed on 2003-07-17. Completion date: 2003-08-15.
PROFESSIONAL TRANSLATING SERVI (44 WEST FLAGLER STREET, SU; small business)
$5,880 with Army for Translation and Interpreting Services(Including Sign Language). Taking place in AZ. Signed on 2004-08-30. Completion date: 2004-09-02.
Top industries in this zip code by the number of employees in 2005:


 Nearest zip codes: 33128, 33101, 33136, 33131, 33129, 33132.