Estimated zip code population in 2022: 21,081 Zip code population in 2010: 21,427 Zip code population in 2000: 21,244
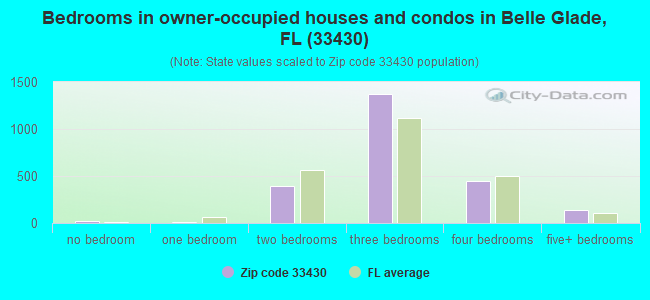
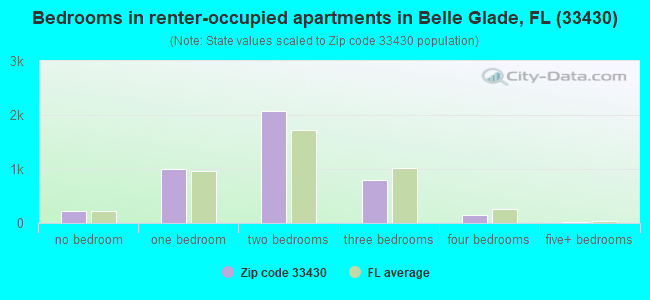
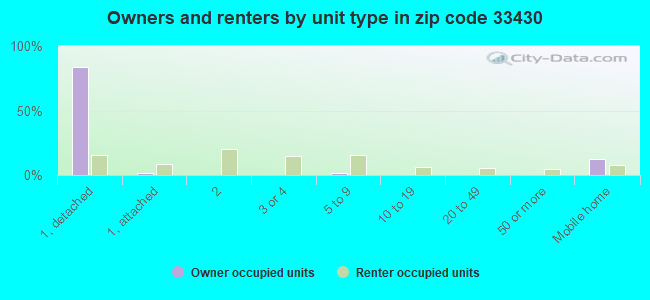
Houses and condos: 7,490 Renter-occupied apartments: 4,226
% of renters here:
64%
State:
33%
March 2022 cost of living index in zip code 33430: 96.5 (near average, U.S. average is 100)
Land area: 113.7 sq. mi. Water area: 0.3 sq. mi.
Population density: 185 people per square mile
(very low).
OSM Map
General Map
Google Map
MSN Map
OSM Map
General Map
Google Map
MSN Map
OSM Map
General Map
Google Map
MSN Map
OSM Map
General Map
Google Map
MSN Map
Please wait while loading the map...
Real estate property taxes paid for housing units in 2022:
This zip code:
0.9% ($1,473)
Florida:
0.7% ($2,529)
Median real estate property taxes paid for housing units with mortgages in 2022: $1,777 (0.7%) Median real estate property taxes paid for housing units with no mortgage in 2022: $1,279 (1.2%)
Business Search- 14 Million verified businesses
Males: 11,390
(54.0%)
Females: 9,691
(46.0%)
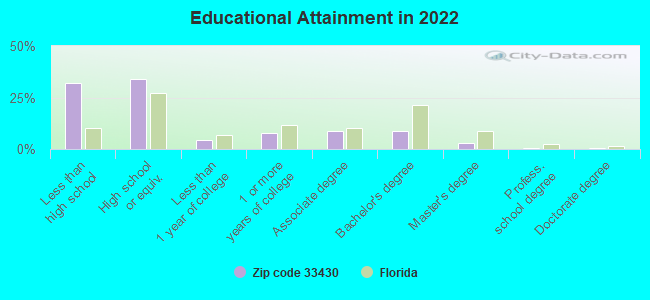
For population 25 years and over in 33430:
High school or higher: 66.6%
Bachelor's degree or higher: 12.6%
Graduate or professional degree: 3.8%
Unemployed: 9.7%
Mean travel time to work (commute): 26.7 minutes
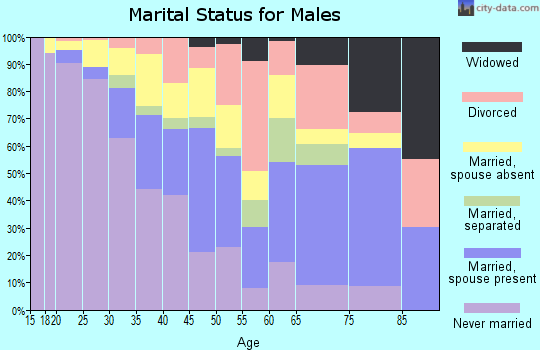
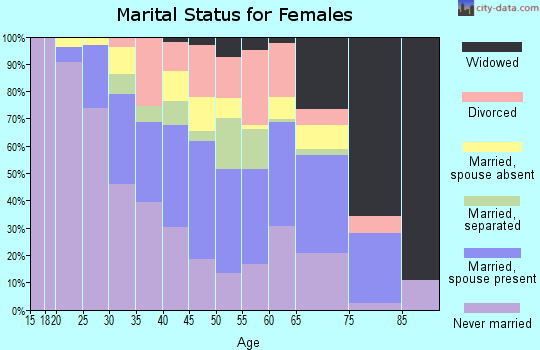
For population 15 years and over in 33430:
Never married: 45.8%
Now married: 38.1%
Separated: 2.2%
Widowed: 4.6%
Divorced: 9.2%
Zip code 33430 compared to state average:
Median household income below state average.
Median house value below state average.
Unemployed percentage above state average.
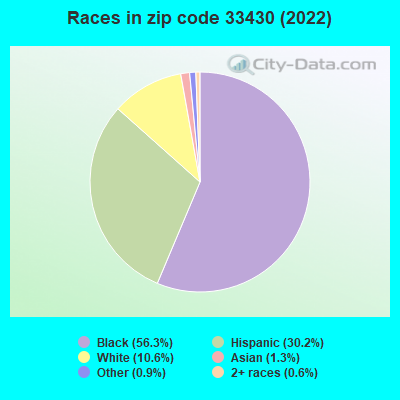
Black race population percentage significantly above state average.
Median age significantly below state average.
Renting percentage above state average.
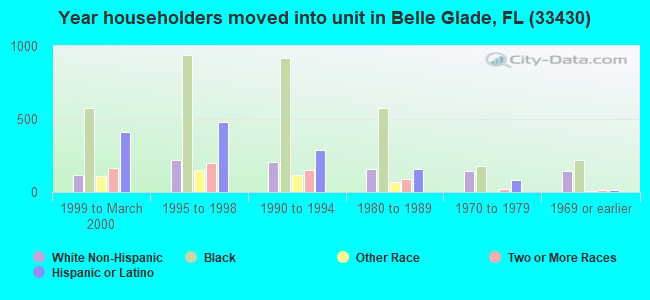
Length of stay since moving in significantly above state average.
Percentage of population with a bachelor's degree or higher significantly below state average.
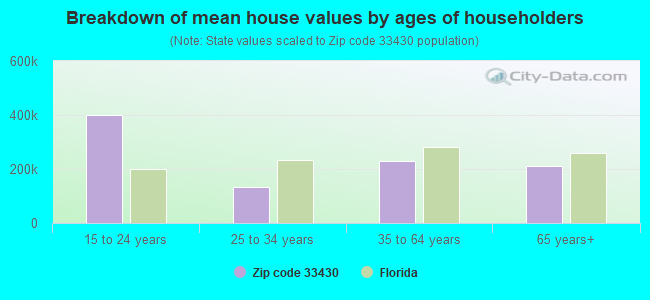
Estimated median house/condo value in 2022: $161,781
33430:
$161,781
Florida:
$354,100
According to our research of Florida and other state lists, there were 44 registered sex offenders living in 33430 zip code as of April 27, 2024. The ratio of all residents to sex offenders in zip code 33430 is 504 to 1. The ratio of registered sex offenders to all residents in this zip code is near the state average.
Median resident age:
This zip code:
32.5 years
Florida median age:
42.7 years
Average household size:
This zip code:
3.1 people
Florida:
2.5 people
Averages for the 2020 tax year for zip code 33430, filed in 2021:
Average Adjusted Gross Income (AGI) in 2020: $30,442 (Individual Income Tax Returns)
Here:
$30,442
State:
$82,200
Salary/wage: $28,355 (reported on 90.8% of returns)
Here:
$28,355
State:
$58,347
(% of AGI for various income ranges: 1863.2% for AGIs below $25k, 3965.3% for AGIs $25k-50k, 6795.1% for AGIs $50k-75k, 9794.3% for AGIs $75k-100k, 14693.3% for AGIs $100k-200k)
Taxable interest for individuals: $852 (reported on 7.2% of returns)
This zip code:
$852
Florida:
$4,272
(% of AGI for various income ranges: 1.3% for AGIs below $25k, 2.5% for AGIs $25k-50k, 3.3% for AGIs $50k-75k, 8.6% for AGIs $75k-100k, 184.7% for AGIs $100k-200k)
Ordinary dividends: $2,991 (reported on 2.2% of returns)
Here:
$2,991
State:
$15,863
(% of AGI for various income ranges: 1.7% for AGIs below $25k, 2.0% for AGIs $25k-50k, 2.9% for AGIs $50k-75k, 21.0% for AGIs $75k-100k, 149.3% for AGIs $100k-200k)
Net capital gain/loss in AGI: +$9,556 (reported on 2.5% of returns)
Here:
+$9,556
State:
+$62,983
(% of AGI for various income ranges: 1.1% for AGIs below $25k, 1.4% for AGIs $25k-50k, 3.2% for AGIs $50k-75k, 11.9% for AGIs $75k-100k, 244.0% for AGIs $100k-200k)
Taxable individual retirement arrangement distribution: $11,620 (reported on 2.0% of returns)
33430:
$11,620
Florida:
$24,823
(% of AGI for various income ranges: 9.9% for AGIs below $25k, 22.3% for AGIs $25k-50k, 70.8% for AGIs $50k-75k, 147.6% for AGIs $75k-100k, 459.3% for AGIs $100k-200k)
Total itemized deductions: $30,138 (reported on 3.2% of returns)
Here:
$30,138
State:
$45,393
(% of AGI for various income ranges: 14.2% for AGIs below $25k, 114.2% for AGIs $25k-50k, 385.4% for AGIs $50k-75k, 685.2% for AGIs $75k-100k, 852.7% for AGIs $100k-200k)
Charity contributions: $12,804 (reported on 2.7% of returns)
Here:
$12,804
State:
$20,178
(% of AGI for various income ranges: 53.1% for AGIs $25k-50k, 117.0% for AGIs $50k-75k, 271.9% for AGIs $75k-100k, 312.0% for AGIs $100k-200k)
Taxes paid: $4,546 (reported on 2.8% of returns)
33430:
$4,546
State:
$6,967
(% of AGI for various income ranges: 1.6% for AGIs below $25k, 15.2% for AGIs $25k-50k, 46.7% for AGIs $50k-75k, 121.9% for AGIs $75k-100k, 106.7% for AGIs $100k-200k)
Earned income credit: $2,561 (reported on 44.2% of returns)
Here:
$2,561
State:
$2,306
(% of AGI for various income ranges: 217.2% for AGIs below $25k, 129.4% for AGIs $25k-50k)
Percentage of individuals using paid preparers for their 2020 taxes: 84.9%
Here:
85%
State:
92%
(% for various income ranges: 83.5% for AGIs below $25k, 86.7% for AGIs $25k-50k, 84.8% for AGIs $50k-75k, 89.7% for AGIs $75k-100k, 88.0% for AGIs $100k-200k, 100.0% for AGIs over 200k)
Averages for the 2012 tax year for zip code 33430, filed in 2013:
Average Adjusted Gross Income (AGI) in 2012: $24,168 (Individual Income Tax Returns)
Here:
$24,168
State:
$60,316
Salary/wage: $22,162 (reported on 80.6% of returns)
Here:
$22,162
State:
$45,277
(% of AGI for various income ranges: 82.3% for AGIs below $25k, 92.0% for AGIs $25k-50k, 84.1% for AGIs $50k-75k, 75.9% for AGIs $75k-100k, 67.5% for AGIs $100k-200k, 17.6% for AGIs over 200k)
Taxable interest for individuals: $8,704 (reported on 18.1% of returns)
This zip code:
$8,704
Florida:
$3,587
(% of AGI for various income ranges: 18.1% for AGIs below $25k, 0.2% for AGIs $25k-50k, 0.1% for AGIs $50k-75k, 0.3% for AGIs $75k-100k, 1.4% for AGIs $100k-200k, 1.3% for AGIs over 200k)
Ordinary dividends: $8,160 (reported on 3.8% of returns)
Here:
$8,160
State:
$12,831
(% of AGI for various income ranges: 0.6% for AGIs below $25k, 0.9% for AGIs $25k-50k, 1.3% for AGIs $50k-75k, 0.8% for AGIs $75k-100k, 0.8% for AGIs $100k-200k, 4.3% for AGIs over 200k)
Net capital gain/loss in AGI: +$5,400 (reported on 2.0% of returns)
Here:
+$5,400
State:
+$33,493
(% of AGI for various income ranges: 0.2% for AGIs $25k-50k, 0.4% for AGIs $50k-75k, 2.3% for AGIs $100k-200k, 1.0% for AGIs over 200k)
Profit/loss from business: +$984 (reported on 13.4% of returns)
Here:
+$984
State:
+$10,012
(% of AGI for various income ranges: 1.8% for AGIs below $25k, 1.3% for AGIs $75k-100k, 1.2% for AGIs $100k-200k)
Taxable individual retirement arrangement distribution: $16,236 (reported on 2.0% of returns)
33430:
$16,236
Florida:
$21,544
(% of AGI for various income ranges: 0.4% for AGIs below $25k, 0.8% for AGIs $25k-50k, 1.8% for AGIs $50k-75k, 3.7% for AGIs $75k-100k, 6.4% for AGIs $100k-200k)
Total itemized deductions: $20,195 (24% of AGI, reported on 9.5% of returns)
Here:
$20,195
State:
$25,533
Here:
24.4% of AGI
State:
18.0% of AGI
(% of AGI for various income ranges: 3.1% for AGIs below $25k, 12.0% for AGIs $25k-50k, 11.9% for AGIs $50k-75k, 11.0% for AGIs $75k-100k, 11.1% for AGIs $100k-200k, 5.9% for AGIs over 200k)
Charity contributions: $6,820 (reported on 7.5% of returns)
Here:
$6,820
State:
$5,698
(% of AGI for various income ranges: 0.6% for AGIs below $25k, 2.5% for AGIs $25k-50k, 2.8% for AGIs $50k-75k, 2.7% for AGIs $75k-100k, 3.4% for AGIs $100k-200k, 3.5% for AGIs over 200k)
Taxes paid: $2,837 (reported on 8.3% of returns)
33430:
$2,837
State:
$6,203
(% of AGI for various income ranges: 0.3% for AGIs below $25k, 0.9% for AGIs $25k-50k, 1.4% for AGIs $50k-75k, 1.7% for AGIs $75k-100k, 2.1% for AGIs $100k-200k, 1.3% for AGIs over 200k)
Earned income credit: $2,777 (reported on 37.2% of returns)
Here:
$2,777
State:
$2,372
(% of AGI for various income ranges: 10.9% for AGIs below $25k, 2.2% for AGIs $25k-50k)
Percentage of individuals using paid preparers for their 2012 taxes: 40.7%
Here:
41%
State:
54%
(% for various income ranges: 37.2% for AGIs below $25k, 47.2% for AGIs $25k-50k, 50.9% for AGIs $50k-75k, 54.5% for AGIs $75k-100k, 68.2% for AGIs $100k-200k, 100.0% for AGIs over 200k)
Averages for the 2004 tax year for zip code 33430, filed in 2005:
Average Adjusted Gross Income (AGI) in 2004: $28,746 (Individual Income Tax Returns)
Here:
$28,746
State:
$50,523
Salary/wage: $24,320 (reported on 93.7% of returns)
Here:
$24,320
State:
$39,563
(% of AGI for various income ranges: 90.4% for AGIs below $10k, 88.7% for AGIs $10k-25k, 93.0% for AGIs $25k-50k, 87.4% for AGIs $50k-75k, 82.6% for AGIs $75k-100k, 42.1% for AGIs over 100k)
Taxable interest for individuals: $1,604 (reported on 13.0% of returns)
This zip code:
$1,604
Florida:
$3,211
(% of AGI for various income ranges: 0.4% for AGIs below $10k, 0.3% for AGIs $10k-25k, 0.3% for AGIs $25k-50k, 0.3% for AGIs $50k-75k, 0.3% for AGIs $75k-100k, 2.1% for AGIs over 100k)
Taxable dividends: $1,912 (reported on 6.9% of returns)
Here:
$1,912
State:
$6,129
(% of AGI for various income ranges: 0.4% for AGIs below $10k, 0.2% for AGIs $10k-25k, 0.2% for AGIs $25k-50k, 0.7% for AGIs $50k-75k, 0.4% for AGIs $75k-100k, 1.0% for AGIs over 100k)
Net capital gain/loss: +$14,515 (reported on 3.7% of returns)
Here:
+$14,515
State:
+$27,205
(% of AGI for various income ranges: -0.3% for AGIs below $10k, -0.1% for AGIs $10k-25k, 0.2% for AGIs $25k-50k, 0.2% for AGIs $50k-75k, 0.7% for AGIs $75k-100k, 8.1% for AGIs over 100k)
Profit/loss from business: +$5,670 (reported on 7.9% of returns)
Here:
+$5,670
State:
+$10,634
(% of AGI for various income ranges: 5.4% for AGIs below $10k, 2.8% for AGIs $10k-25k, 0.5% for AGIs $25k-50k, 0.4% for AGIs $50k-75k, 1.7% for AGIs $75k-100k, 1.6% for AGIs over 100k)
Profit/loss from farming: +$11,588 (reported on 0.2% of returns)
Here:
+$11,588
State:
-$6,005
IRA payment deduction: $2,902 (reported on 1.8% of returns)
33430:
$2,902
Florida:
$3,082
(% of AGI for various income ranges: 0.2% for AGIs $10k-25k, 0.3% for AGIs $25k-50k, 0.2% for AGIs $75k-100k, 0.1% for AGIs over 100k)
Total itemized deductions: $18,826 (27% of AGI, reported on 14.2% of returns)
Here:
$18,826
State:
$20,370
Here:
26.6% of AGI
State:
20.7% of AGI
(% of AGI for various income ranges: 4.0% for AGIs below $10k, 4.8% for AGIs $10k-25k, 11.3% for AGIs $25k-50k, 12.6% for AGIs $50k-75k, 13.3% for AGIs $75k-100k, 9.2% for AGIs over 100k)
Charity contributions deductions: $6,533 (9% of AGI, reported on 12.6% of returns)
Here:
$6,533
State:
$4,064
Here:
9.2% of AGI
State:
3.8% of AGI
(% of AGI for various income ranges: 0.2% for AGIs below $10k, 0.9% for AGIs $10k-25k, 2.5% for AGIs $25k-50k, 2.6% for AGIs $50k-75k, 4.0% for AGIs $75k-100k, 5.8% for AGIs over 100k)
Total tax: $5,205 (reported on 46.5% of returns)
33430:
$5,205
State:
$9,431
(% of AGI for various income ranges: 1.4% for AGIs below $10k, 1.8% for AGIs $10k-25k, 4.2% for AGIs $25k-50k, 8.2% for AGIs $50k-75k, 10.5% for AGIs $75k-100k, 22.1% for AGIs over 100k)
Earned income credit: $2,010 (reported on 50.7% of returns)
Here:
$2,010
State:
$1,808
Percentage of individuals using paid preparers for their 2004 taxes: 57.2%
Here:
57%
State:
60%
(% for various income ranges: 55.5% for AGIs below $10k, 60.2% for AGIs $10k-25k, 53.2% for AGIs $25k-50k, 51.8% for AGIs $50k-75k, 59.2% for AGIs $75k-100k, 80.4% for AGIs over 100k)
Likely homosexual households (counted as self-reported same-sex unmarried-partner households)
Lesbian couples: 0.4% of all households
Gay men: 0.0% of all households
Household received Food Stamps/SNAP in the past 12 months: 2,456 Household did not receive Food Stamps/SNAP in the past 12 months: 4,061
Women who had a birth in the past 12 months: 352 (201 now married, 147 unmarried) Women who did not have a birth in the past 12 months: 3,904 (1,237 now married, 2,666 unmarried)
Housing units in zip code 33430 with a mortgage: 960 (107 second mortgage, 108 both second mortgage and home equity loan) Median monthly owner costs for units with a mortgage: $1,371 Median monthly owner costs for units without a mortgage: $448
Residents with income below the poverty level in 2022:
This zip code:
31.6%
Whole state:
12.7%
Residents with income below 50% of the poverty level in 2022:
This zip code:
17.8%
Whole state:
6.6%
Median number of rooms in houses and condos:
Here:
6.1
State:
5.9
Median number of rooms in apartments:
Here:
3.8
State:
4.2
Notable locations in this zip code not listed on our city pages
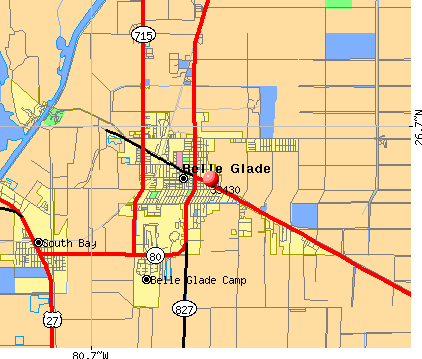
Notable locations in zip code 33430: Everglades Experiment Station (A), South Florida Water Management District Pumping Station Number 2 (B), Knott Railroad Station (C), Glades Plaza (D), Palm Beach County Fire Rescue Station 73 (E), Glades Correctional Institution (F), Belle Glade Police Department (G), Palm Beach County Sheriff's Office (H), Belle Glade Police Chief (I), Palm Beach County Sheriff's Office District 5 (J), Glades Correctional Institution Library (K), Palm Beach County Library System Belle Glade Branch (L). Display/hide their locations on the map
Shopping Centers: Royals Shopping Center (1), Glades Shopping Center (2), Carter Shopping Center (3), Belle Glade Shopping Center (4). Display/hide their locations on the map
In group quarters: 748 (-1 institutionalized population)
Size of family households: 1,458 2-persons, 1,077 3-persons, 1,199 4-persons, 492 5-persons, 259 6-persons, 283 7-or-more-persons
Size of nonfamily households: 1,526 1-person, 324 2-persons, 13 3-persons
1,919 married couples with children.
2,597 single-parent households (721 men, 1,876 women).
52.6% of residents of 33430 zip code speak English at home.
27.7% of residents speak Spanish at home (53% very well, 16% well, 16% not well, 16% not at all).
17.9% of residents speak other Indo-European language at home (51% very well, 19% well, 14% not well, 15% not at all).
2.8% of residents speak other language at home (82% very well, 8% well, 10% not well).
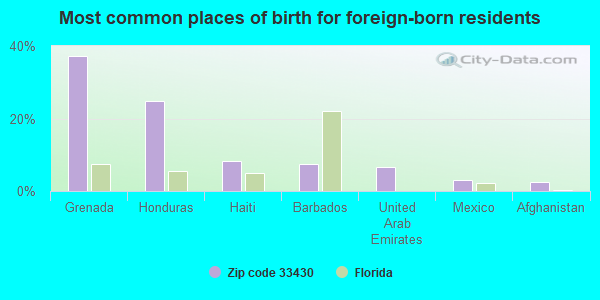
Foreign born population: 6,280 (29.8%) (53.9% of them are naturalized citizens)
This zip code:
29.8%
Whole state:
21.7%
37%Grenada
25%Honduras
8%Haiti
7%Barbados
6%United Arab Emirates
3%Mexico
2%Afghanistan
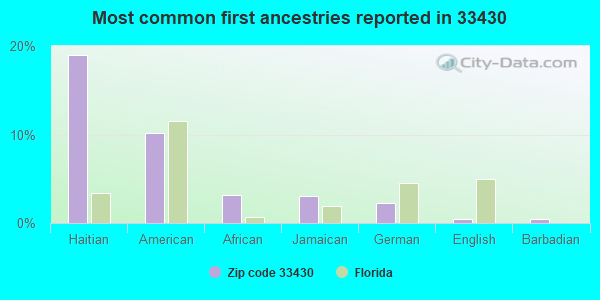
19%Haitian
10%American
3%African
3%Jamaican
2%German
0%English
0%Barbadian
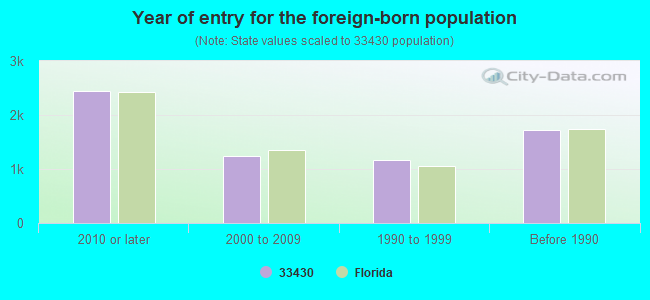
Year of entry for the foreign-born population
2,4362010 or later
1,2472000 to 2009
1,1711990 to 1999
1,719Before 1990
Major facilities with environmental interests located in this zip code:
ATLANTIC SUGAR ASSOCIATION (26400 OLD STATE ROAD 80 in BELLE GLADE, FL)
AIR MAJOR (AIRS/AFS) (Integrated Compliance Information System) - ICIS-04-1985-0017, FORMAL ENFORCEMENT ACTION COMPLIANCE ACTIVITY (Tracking inspections of insecticide, fungicide, and rodenticide, and toxic substances) CRITERIA AND HAZARDOUS AIR POLLUTANT INVENTORY (Inventory of air pollution sources) AIR MAJOR ("Best Available" air pollution technologies tracking) Small Quantity Generators, between 100 kg and 1000 kg of hazardous waste/month (Resource Conservation and Recovery Act (tracking hazardous waste)) TRI REPORTER (Tracking of toxic chemicals releasing facilities) Business SIC classification: CANE SUGAR, EXCEPT REFINING; CANE SUGAR REFINING Business NAICS classification: SUGARCANE MILLS. Organizations: J C CABRERA (CONTACT/OWNER)
Alternative names: ATLANTIC SUGAR ASSOC., ATLANTIC SUGAR ASSOCATION
GLADE VIEW ELEMENTARY SCHOOL (1100 SW AVE G in BELLE GLADE, FL)
(National Center for Education Statistics) - STATE ID-1251 Organizations: PALM BEACH COUNTY SCHOOL DISTRICT (SCHOOL DISTRICT)
GLADES CENTRAL HIGH SCHOOL (FO (1001 SW AVE M in BELLE GLADE, FL)
(National Center for Education Statistics) - STATE ID-2301 Organizations: PALM BEACH COUNTY SCHOOL DISTRICT (SCHOOL DISTRICT)
INTENSIVE TRANSITION WEST (1224 SW AVENUE E in BELLE GLADE, FL)
(National Center for Education Statistics) - STATE ID-3048 Organizations: PALM BEACH COUNTY SCHOOL DISTRICT (SCHOOL DISTRICT)
LAKE SHORE ANNEX TRANSITION SCHOOL (1102 NW AVENUE A in BELLE GLADE, FL)
(National Center for Education Statistics) - STATE ID-3101 Organizations: PALM BEACH COUNTY SCHOOL DISTRICT (SCHOOL DISTRICT)
GOVE ELEMENTARY SCHOOL (900 SE AVE G in BELLE GLADE, FL)
(National Center for Education Statistics) - STATE ID-1241 Organizations: PALM BEACH COUNTY SCHOOL DISTRICT (SCHOOL DISTRICT)
LAKE SIDE ACADEMY (FORMERLY PARTNERSHI (710 SOUTH MAIN STREET in BELLE GLADE, FL)
(National Center for Education Statistics) - STATE ID-2641 Organizations: PALM BEACH COUNTY SCHOOL DISTRICT (SCHOOL DISTRICT)
PIONEER PARK ELEMENTARY SCHOOL (FORMERL (39500 PIONEER PARK RD in BELLE GLADE, FL)
(National Center for Education Statistics) - STATE ID-2371 Organizations: PALM BEACH COUNTY SCHOOL DISTRICT (SCHOOL DISTRICT)
QO CHEMICAL INCORPORATED BELLE GLADE PLANT (1602 WEST SUGARHOUSE ROAD in BELLE GLADE, FL)
AIR MAJOR (AIRS/AFS) (Resource Conservation and Recovery Act (tracking hazardous waste)) TRI REPORTER (Tracking of toxic chemicals releasing facilities) Business SIC classification: INDUSTRIAL ORGANIC CHEMICALS Business NAICS classification: ALL OTHER MISCELLANEOUS CHEMICAL PRODUCT AND PREPARATION MANUFACTURING. Organizations: JOSE CALAS, SENIOR ENG (CONTACT/OWNER)
Alternative names: Q O CHEMICALS
AFFORDABLE DRY CLEANING (349 SOUTH MAIN STREET in BELLE GLADE, FL)
AIR MINOR (AIRS/AFS) Small Quantity Generators, between 100 kg and 1000 kg of hazardous waste/month (Resource Conservation and Recovery Act (tracking hazardous waste)) Business SIC classification: DRYCLEANING PLANTS, EXCEPT RUG CLEANING Organizations: JEFF HAWKINS (CONTACT/OWNER)
Alternative names: AFFORDABLE DRYCLEANING
ASGROW FLORIDA CO (425 N.W. AVE. L in BELLE GLADE, FL)
(Resource Conservation and Recovery Act (tracking hazardous waste)) TRI REPORTER (Tracking of toxic chemicals releasing facilities) Business SIC classification: PESTICIDES AND AGRICULTURAL CHEMICALS Organizations: SIMMIE MCNEAL, SAFETY COORDINATOR (CONTACT/OWNER)
NORMAN BROTHERS INC (233 SE AVENUE E in BELLE GLADE, FL)
AIR MINOR (AIRS/AFS) Small Quantity Generators, between 100 kg and 1000 kg of hazardous waste/month (Resource Conservation and Recovery Act (tracking hazardous waste)) - notification Business SIC classification: DRYCLEANING PLANTS, EXCEPT RUG CLEANING Organizations: LARRY R NORMAN (CONTACT/OWNER)
Alternative names: BROTHERS DRY CLEANERS
GLADES FORMULATING CORP (909 NE 13TH ST in BELLE GLADE, FL)
(Resource Conservation and Recovery Act (tracking hazardous waste))
Housing units lacking complete plumbing facilities: 3.7% Housing units lacking complete kitchen facilities: 6.2%
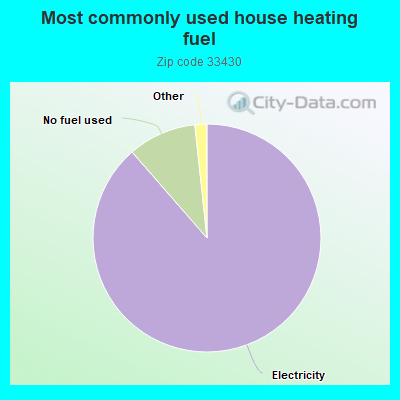
88.6%Electricity
9.7%No fuel used
0.8%Bottled, tank, or LP gas
0.6%Other fuel
Population in 1990: 22,652.
Place of birth for U.S.-born residents:
This state: 12,036
Northeast: 394
Midwest: 219
South: 1,553
West: 224
60% of the 33430 zip code residents lived in the same house 5 years ago. Out of people who lived in different houses, 83% lived in this county. Out of people who lived in different counties, 50% lived in Florida.
89% of the 33430 zip code residents lived in the same house 1 year ago. Out of people who lived in different houses, 62% moved from this county. Out of people who lived in different houses, 18% moved from different county within same state. Out of people who lived in different houses, 6% moved from different state. Out of people who lived in different houses, 9% moved from abroad.
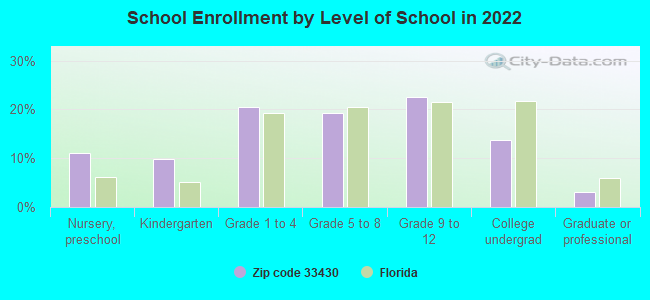
Private vs. public school enrollment:
Students in private schools in grades 1 to 8 (elementary and middle school): 134
Here:
5.9%
Florida:
15.8%
Students in private schools in grades 9 to 12 (high school): 155
Here:
12.0%
Florida:
12.9%
Students in private undergraduate colleges: 80
Here:
10.4%
Florida:
23.6%
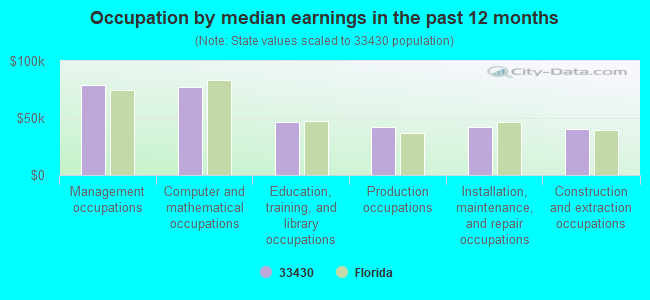
Occupation by median earnings in the past 12 months ($)
79,094Management occupations
77,447Computer and mathematical occupations
46,465Education, training, and library occupations
42,196Production occupations
41,929Installation, maintenance, and repair occupations
39,964Construction and extraction occupations
Companies with federal contracts located in this zip code:
IRONCLAD-EEI A JOINT VENTURE (200 S MAIN ST in BELLE GLADE, FL; small business) : $20,006,000 in 5 contractsfrom 2005 to 2006
Contracts for Construction of Structures and Facilities -- Miscellaneous Buildings by Army Signed by year:2000: $0; 2001: $0; 2002: $0; 2003: $0; 2004: $0; 2005: $20,005,000; 2006: $1,000.
Biggest contracts:
$10,000,000 with Army for Construction of Structures and Facilities -- Miscellaneous Buildings. Signed on 2005-11-10. Completion date: 2006-11-10.
$5,000,000, same as above.Signed on 2005-11-23. Completion date: 2006-11-10.
$5,000,000, same as above.Signed on 2005-12-09. Completion date: 2006-11-10.
$5,000, same as above.Signed on 2005-11-07. Completion date: 2006-05-15.
ALL BRITE CLEANING (224 N W 14 TH ST in BELLE GLADE, FL; small business) : $66,749 in 4 contractsfrom 2002 to 2004
$22,348 with Navy for Custodial Janitorial Services. Signed on 2004-08-23. Completion date: 2005-09-27.
$22,201, same as above.Signed on 2002-09-20. Completion date: 2002-09-27.
$22,200, same as above.Signed on 2003-09-09. Completion date: 2004-09-27.
$0, same as above.Signed on 2002-09-20. Completion date: 2002-09-27.
Top industries in this zip code by the number of employees in 2005:
Health Care and Social Assistance: General Medical and Surgical Hospitals (250-499 employees: 1 establishment)
2002 - 2018 National Fire Incident Reporting System (NFIRS) incidents
According to the data from the years 2002 - 2018 the average number of fires per year is 72. The highest number of reported fire incidents - 112 took place in 2007, and the least - 2 in 2004. The data has a declining trend.
When looking into fire subcategories, the most reports belonged to: Outside Fires (49.6%), and Structure Fires (23.0%).
Fire incident types reported to NFIRS in Zip Code 33430


+$11,588
-$6,005
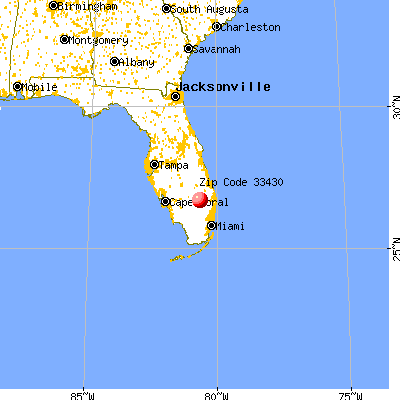
 Nearest zip codes: 33476, 33493, 33470, 33438, 33414, 33449.


 According to the data from the years 2002 - 2018 the average number of fires per year is 72. The highest number of reported fire incidents - 112 took place in 2007, and the least - 2 in 2004. The data has a declining trend.
 When looking into fire subcategories, the most reports belonged to: Outside Fires (49.6%), and Structure Fires (23.0%).