Estimated zip code population in 2022: 12,586 Zip code population in 2010: 11,161 Zip code population in 2000: 34,439
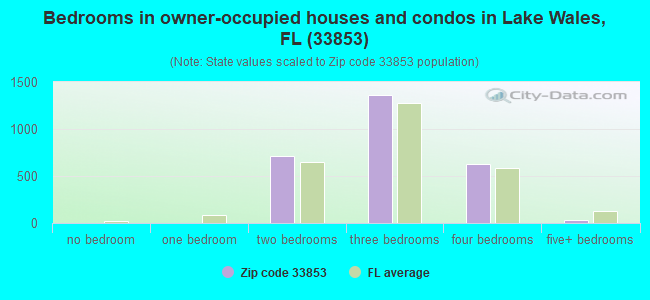
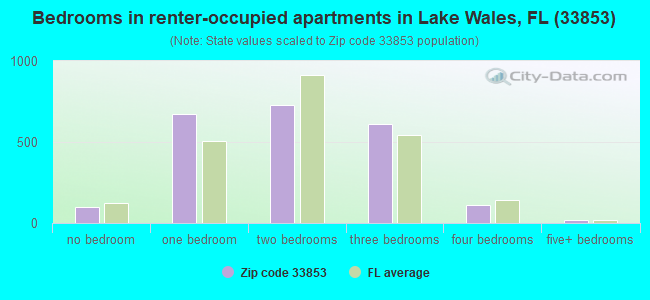
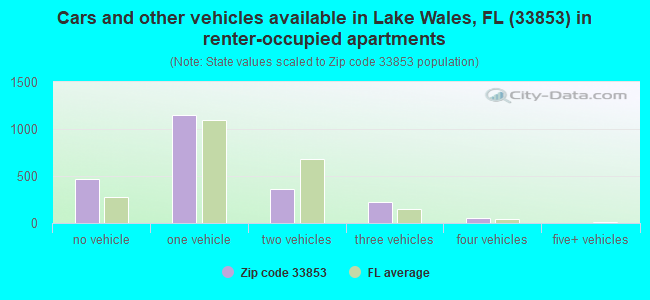
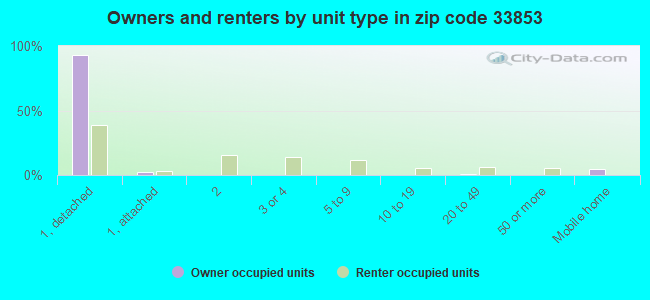
Houses and condos: 5,730 Renter-occupied apartments: 2,246
% of renters here:
45%
State:
33%
March 2022 cost of living index in zip code 33853: 87.1 (less than average, U.S. average is 100)
Land area: 8.2 sq. mi. Water area: 1.0 sq. mi.
Population density: 1,543 people per square mile
(low).
OSM Map
General Map
Google Map
MSN Map
OSM Map
General Map
Google Map
MSN Map
OSM Map
General Map
Google Map
MSN Map
OSM Map
General Map
Google Map
MSN Map
Please wait while loading the map...
Real estate property taxes paid for housing units in 2022:
This zip code:
0.6% ($1,268)
Florida:
0.7% ($2,529)
Median real estate property taxes paid for housing units with mortgages in 2022: $1,502 (0.7%) Median real estate property taxes paid for housing units with no mortgage in 2022: $967 (0.7%)
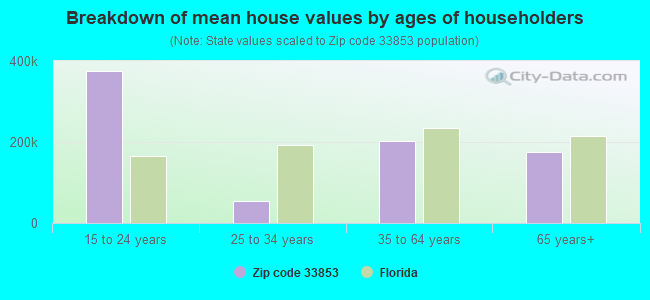
Estimated median house/condo value in 2022: $214,738
33853:
$214,738
Florida:
$354,100
According to our research of Florida and other state lists, there were 14 registered sex offenders living in 33853 zip code as of April 27, 2024. The ratio of all residents to sex offenders in zip code 33853 is 874 to 1. The ratio of registered sex offenders to all residents in this zip code is lower than the state average.
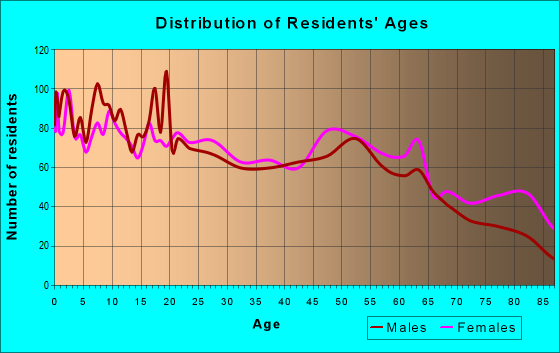
Median resident age:
This zip code:
38.6 years
Florida median age:
42.7 years
Average household size:
This zip code:
2.5 people
Florida:
2.5 people
Averages for the 2020 tax year for zip code 33853, filed in 2021:
Average Adjusted Gross Income (AGI) in 2020: $41,171 (Individual Income Tax Returns)
Here:
$41,171
State:
$82,200
Salary/wage: $35,097 (reported on 83.2% of returns)
Here:
$35,097
State:
$58,347
(% of AGI for various income ranges: 1223.2% for AGIs below $25k, 3612.0% for AGIs $25k-50k, 6705.3% for AGIs $50k-75k, 9405.8% for AGIs $75k-100k, 14030.6% for AGIs $100k-200k)
Taxable interest for individuals: $1,462 (reported on 12.4% of returns)
This zip code:
$1,462
Florida:
$4,272
(% of AGI for various income ranges: 5.9% for AGIs below $25k, 8.0% for AGIs $25k-50k, 20.0% for AGIs $50k-75k, 63.7% for AGIs $75k-100k, 72.8% for AGIs $100k-200k)
Ordinary dividends: $11,900 (reported on 7.8% of returns)
Here:
$11,900
State:
$15,863
(% of AGI for various income ranges: 7.4% for AGIs below $25k, 21.6% for AGIs $25k-50k, 63.9% for AGIs $50k-75k, 113.7% for AGIs $75k-100k, 572.2% for AGIs $100k-200k)
Net capital gain/loss in AGI: +$20,247 (reported on 6.9% of returns)
Here:
+$20,247
State:
+$62,983
(% of AGI for various income ranges: 2.0% for AGIs below $25k, 8.5% for AGIs $25k-50k, 40.0% for AGIs $50k-75k, 303.2% for AGIs $75k-100k, 961.7% for AGIs $100k-200k)
Profit/loss from business: +$5,639 (reported on 16.0% of returns)
Here:
+$5,639
State:
+$9,719
(% of AGI for various income ranges: 112.5% for AGIs below $25k, 79.7% for AGIs $25k-50k, 76.9% for AGIs $50k-75k, 60.0% for AGIs $75k-100k, 547.2% for AGIs $100k-200k)
Taxable individual retirement arrangement distribution: $16,332 (reported on 4.8% of returns)
33853:
$16,332
Florida:
$24,823
(% of AGI for various income ranges: 20.3% for AGIs below $25k, 44.8% for AGIs $25k-50k, 146.1% for AGIs $50k-75k, 300.0% for AGIs $75k-100k, 1012.2% for AGIs $100k-200k)
Total itemized deductions: $32,135 (reported on 3.2% of returns)
Here:
$32,135
State:
$45,393
(% of AGI for various income ranges: 98.8% for AGIs $25k-50k, 446.7% for AGIs $50k-75k, 495.0% for AGIs $100k-200k)
Charity contributions: $10,254 (reported on 2.5% of returns)
Here:
$10,254
State:
$20,178
(% of AGI for various income ranges: 13.4% for AGIs $25k-50k, 105.5% for AGIs $50k-75k, 197.2% for AGIs $100k-200k)
Taxes paid: $5,080 (reported on 2.9% of returns)
33853:
$5,080
State:
$6,967
(% of AGI for various income ranges: 12.1% for AGIs $25k-50k, 61.6% for AGIs $50k-75k, 76.7% for AGIs $100k-200k)
Earned income credit: $2,834 (reported on 33.3% of returns)
Here:
$2,834
State:
$2,306
(% of AGI for various income ranges: 177.8% for AGIs below $25k, 110.5% for AGIs $25k-50k)
Percentage of individuals using paid preparers for their 2020 taxes: 93.7%
Here:
94%
State:
92%
(% for various income ranges: 93.4% for AGIs below $25k, 94.7% for AGIs $25k-50k, 92.5% for AGIs $50k-75k, 92.6% for AGIs $75k-100k, 93.3% for AGIs $100k-200k, 100.0% for AGIs over 200k)
Averages for the 2012 tax year for zip code 33853, filed in 2013:
Average Adjusted Gross Income (AGI) in 2012: $33,668 (Individual Income Tax Returns)
Here:
$33,668
State:
$60,316
Salary/wage: $29,407 (reported on 83.2% of returns)
Here:
$29,407
State:
$45,277
(% of AGI for various income ranges: 79.2% for AGIs below $25k, 82.0% for AGIs $25k-50k, 74.8% for AGIs $50k-75k, 74.7% for AGIs $75k-100k, 61.4% for AGIs $100k-200k, 41.0% for AGIs over 200k)
Taxable interest for individuals: $1,599 (reported on 17.8% of returns)
This zip code:
$1,599
Florida:
$3,587
(% of AGI for various income ranges: 0.6% for AGIs below $25k, 0.9% for AGIs $25k-50k, 1.1% for AGIs $50k-75k, 0.4% for AGIs $75k-100k, 1.1% for AGIs $100k-200k, 0.9% for AGIs over 200k)
Ordinary dividends: $5,633 (reported on 11.4% of returns)
Here:
$5,633
State:
$12,831
(% of AGI for various income ranges: 1.4% for AGIs below $25k, 1.5% for AGIs $25k-50k, 1.0% for AGIs $50k-75k, 2.0% for AGIs $75k-100k, 4.6% for AGIs $100k-200k, 1.5% for AGIs over 200k)
Net capital gain/loss in AGI: +$6,925 (reported on 7.6% of returns)
Here:
+$6,925
State:
+$33,493
(% of AGI for various income ranges: 0.4% for AGIs $25k-50k, 0.3% for AGIs $50k-75k, 0.4% for AGIs $75k-100k, 3.4% for AGIs $100k-200k, 10.0% for AGIs over 200k)
Profit/loss from business: +$6,993 (reported on 13.5% of returns)
Here:
+$6,993
State:
+$10,012
(% of AGI for various income ranges: 7.8% for AGIs below $25k, 1.5% for AGIs $25k-50k, 0.8% for AGIs $50k-75k, 1.4% for AGIs $75k-100k, 3.0% for AGIs $100k-200k)
Taxable individual retirement arrangement distribution: $10,438 (reported on 6.9% of returns)
33853:
$10,438
Florida:
$21,544
(% of AGI for various income ranges: 1.5% for AGIs below $25k, 1.7% for AGIs $25k-50k, 1.6% for AGIs $50k-75k, 3.3% for AGIs $75k-100k, 5.2% for AGIs $100k-200k)
Total itemized deductions: $18,198 (23% of AGI, reported on 13.5% of returns)
Here:
$18,198
State:
$25,533
Here:
23.5% of AGI
State:
18.0% of AGI
(% of AGI for various income ranges: 3.6% for AGIs below $25k, 7.7% for AGIs $25k-50k, 9.2% for AGIs $50k-75k, 7.6% for AGIs $75k-100k, 10.0% for AGIs $100k-200k, 7.0% for AGIs over 200k)
Charity contributions: $5,232 (reported on 10.4% of returns)
Here:
$5,232
State:
$5,698
(% of AGI for various income ranges: 0.3% for AGIs below $25k, 1.6% for AGIs $25k-50k, 2.0% for AGIs $50k-75k, 1.8% for AGIs $75k-100k, 2.6% for AGIs $100k-200k, 2.5% for AGIs over 200k)
Taxes paid: $2,970 (reported on 12.8% of returns)
33853:
$2,970
State:
$6,203
(% of AGI for various income ranges: 0.4% for AGIs below $25k, 0.8% for AGIs $25k-50k, 1.4% for AGIs $50k-75k, 1.4% for AGIs $75k-100k, 1.7% for AGIs $100k-200k, 2.1% for AGIs over 200k)
Earned income credit: $2,704 (reported on 35.1% of returns)
Here:
$2,704
State:
$2,372
(% of AGI for various income ranges: 10.8% for AGIs below $25k, 1.7% for AGIs $25k-50k)
Percentage of individuals using paid preparers for their 2012 taxes: 44.8%
Here:
45%
State:
54%
(% for various income ranges: 42.4% for AGIs below $25k, 43.4% for AGIs $25k-50k, 51.2% for AGIs $50k-75k, 50.0% for AGIs $75k-100k, 56.2% for AGIs $100k-200k, 100.0% for AGIs over 200k)
Averages for the 2004 tax year for zip code 33853, filed in 2005:
Average Adjusted Gross Income (AGI) in 2004: $34,186 (Individual Income Tax Returns)
Here:
$34,186
State:
$50,523
Salary/wage: $29,601 (reported on 81.9% of returns)
Here:
$29,601
State:
$39,563
(% of AGI for various income ranges: 138.4% for AGIs below $10k, 77.5% for AGIs $10k-25k, 79.1% for AGIs $25k-50k, 75.8% for AGIs $50k-75k, 75.0% for AGIs $75k-100k, 48.2% for AGIs over 100k)
Taxable interest for individuals: $2,886 (reported on 33.4% of returns)
This zip code:
$2,886
Florida:
$3,211
(% of AGI for various income ranges: 8.6% for AGIs below $10k, 2.4% for AGIs $10k-25k, 2.0% for AGIs $25k-50k, 1.6% for AGIs $50k-75k, 2.0% for AGIs $75k-100k, 4.5% for AGIs over 100k)
Taxable dividends: $4,579 (reported on 17.5% of returns)
Here:
$4,579
State:
$6,129
(% of AGI for various income ranges: 6.8% for AGIs below $10k, 1.5% for AGIs $10k-25k, 1.1% for AGIs $25k-50k, 1.5% for AGIs $50k-75k, 2.5% for AGIs $75k-100k, 4.3% for AGIs over 100k)
Net capital gain/loss: +$11,718 (reported on 14.5% of returns)
Here:
+$11,718
State:
+$27,205
(% of AGI for various income ranges: -1.7% for AGIs below $10k, 0.4% for AGIs $10k-25k, 1.3% for AGIs $25k-50k, 2.5% for AGIs $50k-75k, 3.4% for AGIs $75k-100k, 14.3% for AGIs over 100k)
Profit/loss from business: +$9,801 (reported on 11.2% of returns)
Here:
+$9,801
State:
+$10,634
(% of AGI for various income ranges: 2.4% for AGIs below $10k, 3.8% for AGIs $10k-25k, 2.7% for AGIs $25k-50k, 1.9% for AGIs $50k-75k, 1.2% for AGIs $75k-100k, 5.1% for AGIs over 100k)
IRA payment deduction: $3,000 (reported on 2.0% of returns)
33853:
$3,000
Florida:
$3,082
(% of AGI for various income ranges: 0.1% for AGIs $10k-25k, 0.2% for AGIs $25k-50k, 0.2% for AGIs $50k-75k, 0.2% for AGIs over 100k)
Total itemized deductions: $17,817 (25% of AGI, reported on 18.8% of returns)
Here:
$17,817
State:
$20,370
Here:
25.4% of AGI
State:
20.7% of AGI
(% of AGI for various income ranges: 10.2% for AGIs below $10k, 8.2% for AGIs $10k-25k, 11.2% for AGIs $25k-50k, 10.9% for AGIs $50k-75k, 11.6% for AGIs $75k-100k, 7.8% for AGIs over 100k)
Charity contributions deductions: $4,523 (6% of AGI, reported on 16.1% of returns)
Here:
$4,523
State:
$4,064
Here:
6.1% of AGI
State:
3.8% of AGI
(% of AGI for various income ranges: 0.7% for AGIs below $10k, 1.1% for AGIs $10k-25k, 1.8% for AGIs $25k-50k, 2.1% for AGIs $50k-75k, 2.6% for AGIs $75k-100k, 3.0% for AGIs over 100k)
Total tax: $5,611 (reported on 61.8% of returns)
33853:
$5,611
State:
$9,431
(% of AGI for various income ranges: 2.8% for AGIs below $10k, 3.0% for AGIs $10k-25k, 6.0% for AGIs $25k-50k, 8.4% for AGIs $50k-75k, 10.7% for AGIs $75k-100k, 20.1% for AGIs over 100k)
Earned income credit: $1,996 (reported on 28.7% of returns)
Here:
$1,996
State:
$1,808
Percentage of individuals using paid preparers for their 2004 taxes: 58.9%
Here:
59%
State:
60%
(% for various income ranges: 56.0% for AGIs below $10k, 62.1% for AGIs $10k-25k, 55.9% for AGIs $25k-50k, 55.9% for AGIs $50k-75k, 62.5% for AGIs $75k-100k, 73.0% for AGIs over 100k)
Household received Food Stamps/SNAP in the past 12 months: 1,081 Household did not receive Food Stamps/SNAP in the past 12 months: 3,872
Women who had a birth in the past 12 months: 202 (168 now married, 39 unmarried) Women who did not have a birth in the past 12 months: 2,664 (1,003 now married, 1,660 unmarried)
Housing units in zip code 33853 with a mortgage: 1,570 (99 second mortgage, 51 both second mortgage and home equity loan) Houses without a mortgage: 11
Median monthly owner costs for units with a mortgage: $1,193 Median monthly owner costs for units without a mortgage: $449
Residents with income below the poverty level in 2022:
This zip code:
20.9%
Whole state:
12.7%
Residents with income below 50% of the poverty level in 2022:
This zip code:
13.3%
Whole state:
6.6%
Median number of rooms in houses and condos:
Here:
5.7
State:
5.9
Median number of rooms in apartments:
Here:
4.4
State:
4.2
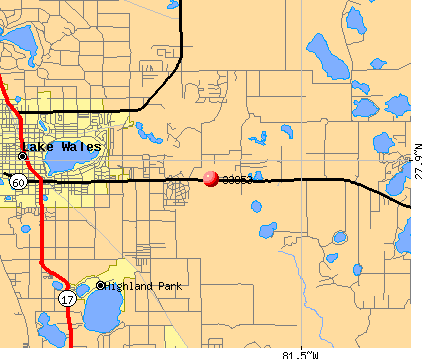
Notable locations in this zip code not listed on our city pages
Notable locations in zip code 33853: Dopler Railroad Station (A), Lake Wales Museum and Cultural Center (B), Lake Wales Public Library (C), City of Lake Wales Fire Department (D), Lake Wales Police Department (E). Display/hide their locations on the map
Lakes: Lake Lorraine (A), Lake Alta (B), Lake Altamaha (C), Lake Caroline (D), Lake Warren (E), Tractor Lake (F), North Lake Wales (G), Lake Belle (H). Display/hide their locations on the map
In group quarters: 307 (-1 institutionalized population)
Size of family households: 1,153 2-persons, 662 3-persons, 569 4-persons, 405 5-persons, 161 6-persons, 36 7-or-more-persons
Size of nonfamily households: 1,670 1-person, 299 2-persons, 18 3-persons
1,691 married couples with children.
843 single-parent households (58 men, 785 women).
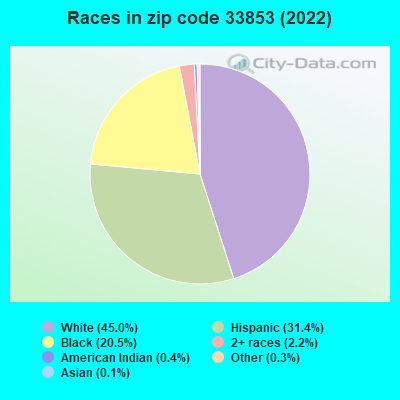
74.9% of residents of 33853 zip code speak English at home.
24.1% of residents speak Spanish at home (55% very well, 16% well, 13% not well, 17% not at all).
0.4% of residents speak other Indo-European language at home (83% very well, 17% not well).
0.1% of residents speak Asian or Pacific Island language at home (62% very well, 38% not well).
0.1% of residents speak other language at home (100% very well).
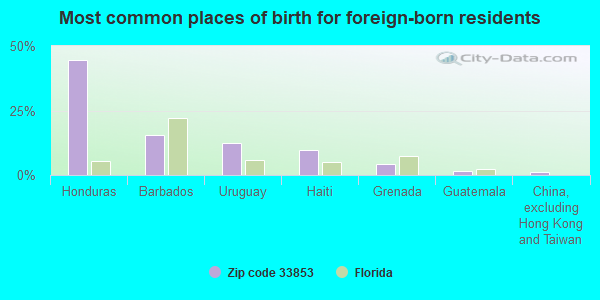
Foreign born population: 1,175 (9.3%) (33.4% of them are naturalized citizens)
This zip code:
9.3%
Whole state:
21.7%
44%Honduras
15%Barbados
12%Uruguay
10%Haiti
4%Grenada
2%Guatemala
1%China, excluding Hong Kong and Taiwan
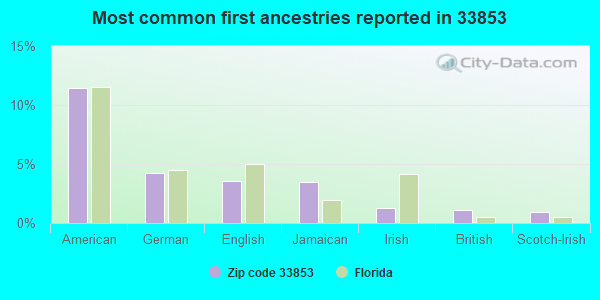
11%American
4%German
4%English
4%Jamaican
1%Irish
1%British
1%Scotch-Irish
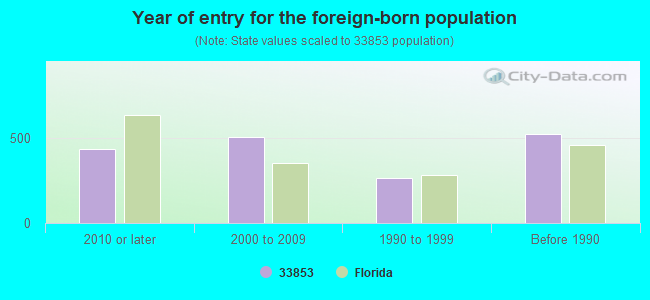
Year of entry for the foreign-born population
4322010 or later
5032000 to 2009
2621990 to 1999
523Before 1990
Major facilities with environmental interests located in this zip code:
INSILCO TECHNOLOGIES - ITG GLOBAL DIVISION (2800 US HWY 27 N in LAKE WALES, FL)
STATE MASTER (FDM) - CHAZ-FLD982117632, HAZARDOUS WASTE REGULATION PROGRAM, WAFR-FLR05B564, NPDES STORMWATER PROGRAM, NPDES STORMWATER PERMIT National Pollutant Discharge Elimination System NON-MAJOR (Tracking pollutant discharge elimination systems) - permit (Resource Conservation and Recovery Act (tracking hazardous waste)) Business SIC classification: CURRENT-CARRYING WIRING DEVICES; ELECTRONIC COMPONENTS Business NAICS classification: CURRENT-CARRYING WIRING DEVICE MANUFACTURING. Organizations: INSILCO TECHNOLOGIES ITG GLOBAL DIV, INSILCO TECHNOLOGIES INC (CONTACT/APPLICANT)
, JEFFERY HERMAN (CONTACT/OWNER)
, INSILCO CORP (CONTACT/OWNER)
, INSILCO TECHNOLOGIES INC (CONTACT/PERMIT)
Alternative names: ESCOD INDUSTRIES, ESCOD INDUSTRIES INC, INSILCO TECHNOLOGIES ITG GLOBA
CITRUS WORLD INCORPORATED (650 U.S. HWY. 27 in LAKE WALES, FL)
AIR MAJOR (AIRS/AFS) (Integrated Compliance Information System) - ICIS-04-2000-0528, FORMAL ENFORCEMENT ACTION CRITERIA AND HAZARDOUS AIR POLLUTANT INVENTORY (Inventory of air pollution sources) National Pollutant Discharge Elimination System NON-MAJOR (Tracking pollutant discharge elimination systems) - permit National Pollutant Discharge Elimination System NON-MAJOR (Tracking pollutant discharge elimination systems) - permit Business SIC classification: CROP PREPARATION SERVICES FOR MARKET, EXCEPT COTTON GINNING; FROZEN FRUITS, FRUIT JUICES, AND VEGETABLES; PREPARED FEEDS AND FEED INGREDIENTS FOR ANIMALS AND FOWLS, EXCEPT DOGS AND CATS Business NAICS classification: FROZEN FRUIT, JUICE, AND VEGETABLE MANUFACTURING. Organizations: FRED FULKS (CONTACT/OWNER)
CITROSUCO NORTH AMERICA INCORPORATED ALCOMA DIVISION (5937 HIGHWAY 60 EAST in LAKE WALES, FL)
AIR MAJOR (AIRS/AFS) (Integrated Compliance Information System) - ICIS-04-2003-2013, FORMAL ENFORCEMENT ACTION CRITERIA AND HAZARDOUS AIR POLLUTANT INVENTORY (Inventory of air pollution sources) (Resource Conservation and Recovery Act (tracking hazardous waste)) TRI REPORTER (Tracking of toxic chemicals releasing facilities) Business SIC classification: CANNED FRUITS, VEGETABLES, PRESERVES, JAMS, AND JELLIES; FROZEN FRUITS, FRUIT JUICES, AND VEGETABLES Business NAICS classification: FROZEN FRUIT, JUICE, AND VEGETABLE MANUFACTURING. Organizations: NON NOTIFIED (CONTACT/OWNER)
Alternative names: ALCOMA PACKING CO INC, CITROSUCO N A INCORPORATED ALCOMA DIVISION, Citrosuco North America, Inc.
HIGHLANDS OIL CO INC (1130 N SCENIC in LAKE WALES, FL)
STATE MASTER (FDM) - CHAZ-FLR000044016, HAZARDOUS WASTE REGULATION PROGRAM TRANSPORTER (Resource Conservation and Recovery Act (tracking hazardous waste)) USED OIL PROGRAM (Resource Conservation and Recovery Act (tracking hazardous waste)) Business SIC classification: PETROLEUM AND PETROLEUM PRODUCTS WHOLESALERS, EXCEPT BULK STATIONS AND TERMINALS; SERVICES Business NAICS classification: ALL OTHER INFORMATION SERVICES. Organizations: MID STATE ENERGY INC (CONTACT/OWNER)
Alternative names: HIGHLANDS OIL CO USED OIL DIV
OAKLEY GROVES INC (101 ABC RD in LAKE WALES, FL)
National Pollutant Discharge Elimination System NON-MAJOR (Tracking pollutant discharge elimination systems) - permit National Pollutant Discharge Elimination System NON-MAJOR (Tracking pollutant discharge elimination systems) - permit (Resource Conservation and Recovery Act (tracking hazardous waste)) Business SIC classification: TRUCKING, EXCEPT LOCAL Organizations: FRANK MISLYAN (CONTACT/OWNER)
, BOB HONOUR, DIR-MGR (CONTACT/OWNER)
Alternative names: OAKLEY TRANSPORT INC
LAKE WALES SENIOR HIGH SCHOOL (#1 HIGHLANDER WAY in LAKE WALES, FL)
(Geographic Names Information System) (National Center for Education Statistics) - STATE ID-1721 Organizations: POLK COUNTY SCHOOL DISTRICT (SCHOOL DISTRICT)
HILLCREST ELEMENTARY SCHOOL (1051 STATE ROAD 60, EAST in LAKE WALES, FL)
(Geographic Names Information System) (National Center for Education Statistics) - STATE ID-1361 Organizations: POLK COUNTY SCHOOL DISTRICT (SCHOOL DISTRICT)
JANIE HOWARD WILSON SCHOOL (306 FLORIDA AVE in LAKE WALES, FL)
(National Center for Education Statistics) - STATE ID-1401 Organizations: POLK COUNTY SCHOOL DISTRICT (SCHOOL DISTRICT)
POLK AVENUE ELEMENTARY SCHOOL (110 E POLK AVE in LAKE WALES, FL)
(National Center for Education Statistics) - STATE ID-1351 Organizations: POLK COUNTY SCHOOL DISTRICT (SCHOOL DISTRICT)
ROOSEVELT ACADEMY OF LEADERSHIP AND APPLIED TECHNO (115 E ST in LAKE WALES, FL)
(National Center for Education Statistics) - STATE ID-1381 Organizations: POLK COUNTY SCHOOL DISTRICT (SCHOOL DISTRICT)
MCLAUGHLIN MIDDLE SCHOOL (800 S 4TH ST in LAKE WALES, FL)
(National Center for Education Statistics) - STATE ID-1341 Organizations: POLK COUNTY SCHOOL DISTRICT (SCHOOL DISTRICT)
SPOOK HILL ELEMENTARY SCHOOL (321 E NORTH AVE in LAKE WALES, FL)
(National Center for Education Statistics) - STATE ID-1371 Organizations: POLK COUNTY SCHOOL DISTRICT (SCHOOL DISTRICT)
CITRUS WORLD INC FLORIDA'S NATURAL GROWERS LAKE WALES DIV (20205 US HWY 27 S in LAKE WALES, FL)
(Resource Conservation and Recovery Act (tracking hazardous waste)) TRI REPORTER (Tracking of toxic chemicals releasing facilities) Business SIC classification: FROZEN FRUITS, FRUIT JUICES, AND VEGETABLES Organizations: FLORIDA NATURAL GROWERS (CONTACT/OWNER)
Alternative names: CITRUS WORLD INC., FLORIDA NATURAL GROWERS
Housing units lacking complete plumbing facilities: 0.7% Housing units lacking complete kitchen facilities: 2.5%
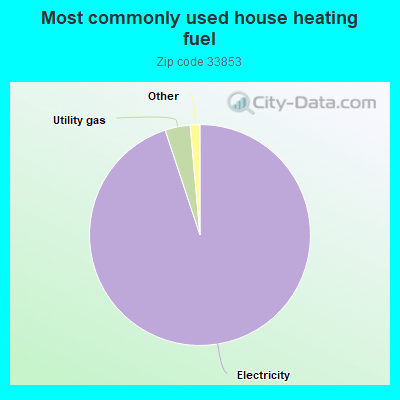
94.9%Electricity
3.7%Utility gas
0.7%No fuel used
0.5%Solar energy
Population in 1990: 32,570. Population change in the 1990s: +1,869 (+5.7%).
Place of birth for U.S.-born residents:
This state: 5,978
Northeast: 2,003
Midwest: 1,207
South: 1,401
West: 153
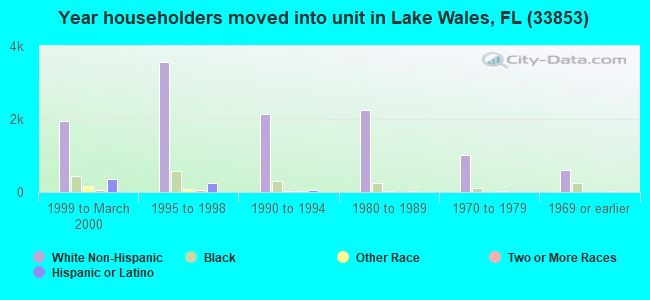
53% of the 33853 zip code residents lived in the same house 5 years ago. Out of people who lived in different houses, 62% lived in this county. Out of people who lived in different counties, 50% lived in Florida.
90% of the 33853 zip code residents lived in the same house 1 year ago. Out of people who lived in different houses, 50% moved from this county. Out of people who lived in different houses, 23% moved from different county within same state. Out of people who lived in different houses, 23% moved from different state. Out of people who lived in different houses, 3% moved from abroad.
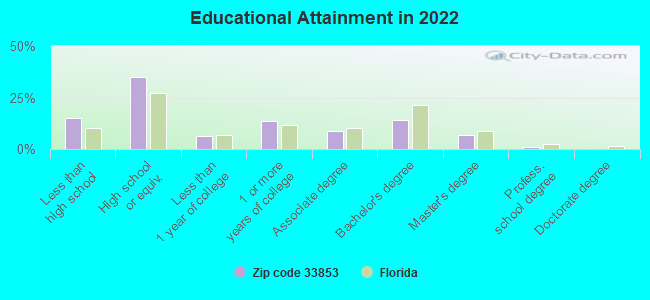
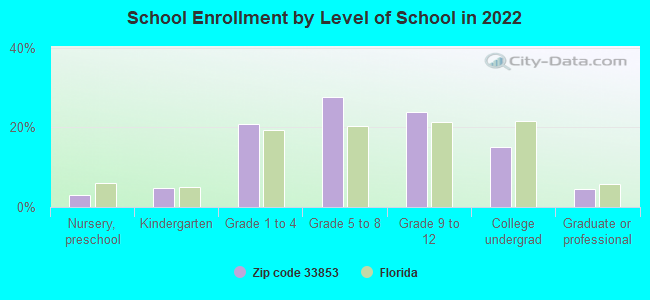
Private vs. public school enrollment:
Students in private schools in grades 1 to 8 (elementary and middle school): 137
Here:
9.6%
Florida:
15.8%
Students in private schools in grades 9 to 12 (high school): 187
Here:
26.3%
Florida:
12.9%
Students in private undergraduate colleges: 93
Here:
20.9%
Florida:
23.6%
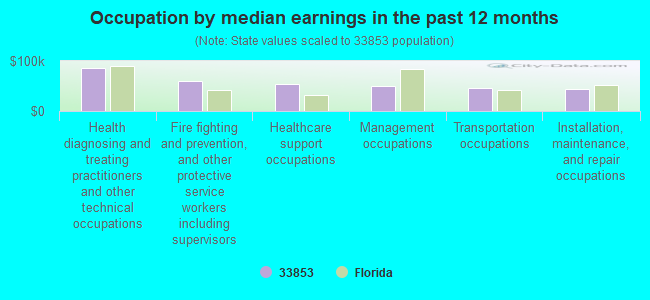
Occupation by median earnings in the past 12 months ($)
86,116Health diagnosing and treating practitioners and other technical occupations
59,561Fire fighting and prevention, and other protective service workers including supervisors
54,811Healthcare support occupations
50,472Management occupations
46,716Transportation occupations
44,007Installation, maintenance, and repair occupations
Companies with federal contracts located in this zip code:
PBG OF CENTRAL FLORIDA INC (331 S 1ST ST in LAKE WALES, FL) : $14,121,504 in 23 contractsfrom 2004 to 2005
Contracts for Maintenance, Repair or Alteration of Real Property -- Family Housing Facilities by U.S. Army Corps of Engineers - civil program financing only, Army Signed by year:2000: $0; 2001: $0; 2002: $0; 2003: $0; 2004: $14,650,000; 2005: -$528,496; 2006: $0.
Biggest contracts:
$3,000,000 with U.S. Army Corps of Engineers - civil program financing only for Maintenance, Repair or Alteration of Real Property -- Family Housing Facilities. Signed on 2004-10-29. Completion date: 2005-04-29.
$3,000,000 with Army for Maintenance, Repair or Alteration of Real Property -- Family Housing Facilities. Signed on 2004-10-29. Completion date: 2005-04-29.
$1,000,000, same as above.Signed on 2004-11-16. Completion date: 2005-04-29.
$1,000,000, same as above.Signed on 2004-11-30. Completion date: 2005-04-29.
CITRUS WORLD, INC (20205 HWY 27 in LAKE WALES, FL) : $13,815,385 in 34 contractsfrom 1999 to 2005
Contracts for Fruits and Vegetables, Non-Food Items For Resale, Food Items For Resale, Dairy Foods and Eggs by Agricultural Marketing Service (disused code), Agricultural Marketing Service, Defense Commissary Agency Signed by year:2000: $0; 2001: $3,449,000; 2002: $218,272; 2003: $2,365,261; 2004: $6,771,010; 2005: $901,842; 2006: $0.
Biggest contracts:
$2,925,000 with Agricultural Marketing Service (disused code) for Fruits and Vegetables. Signed on 2001-09-15. Completion date: 2002-06-15.
$2,316,473 with Agricultural Marketing Service for Fruits and Vegetables. Signed on 2004-02-18. Completion date: 2004-10-31.
$1,802,240, same as above.Signed on 2004-03-02. Completion date: 2004-10-31.
$1,087,650, same as above.Signed on 2003-12-19. Completion date: 2004-03-31.
Top industries in this zip code by the number of employees in 2005:
2004 - 2018 National Fire Incident Reporting System (NFIRS) incidents
According to the data from the years 2004 - 2018 the average number of fires per year is 78. The highest number of reported fires - 124 took place in 2006, and the least - 52 in 2014. The data has a declining trend.
When looking into fire subcategories, the most reports belonged to: Outside Fires (50.3%), and Structure Fires (30.2%).
Fire incident types reported to NFIRS in Zip Code 33853


 Nearest zip codes: 33859, 33877, 33827, 33884, 33838, 33851.
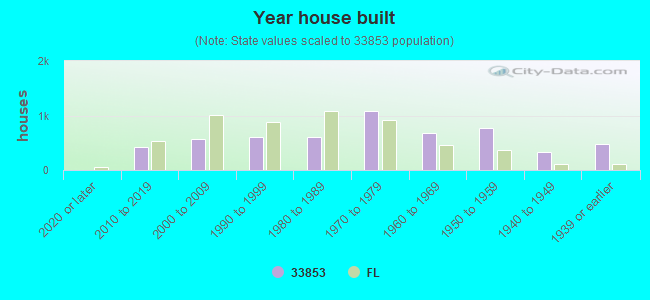


 According to the data from the years 2004 - 2018 the average number of fires per year is 78. The highest number of reported fires - 124 took place in 2006, and the least - 52 in 2014. The data has a declining trend.
 When looking into fire subcategories, the most reports belonged to: Outside Fires (50.3%), and Structure Fires (30.2%).