Estimated zip code population in 2022: 44,965 Zip code population in 2010: 37,798 Zip code population in 2000: 33,778
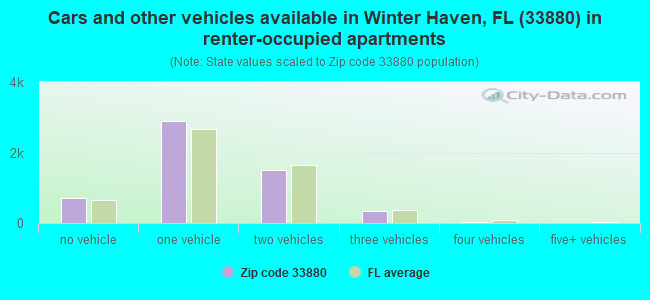
Houses and condos: 17,955 Renter-occupied apartments: 5,476
% of renters here:
34%
State:
33%
March 2022 cost of living index in zip code 33880: 86.3 (less than average, U.S. average is 100)
Land area: 42.6 sq. mi. Water area: 12.6 sq. mi.
Population density: 1,055 people per square mile
(low).
OSM Map
General Map
Google Map
MSN Map
OSM Map
General Map
Google Map
MSN Map
OSM Map
General Map
Google Map
MSN Map
OSM Map
General Map
Google Map
MSN Map
Please wait while loading the map...
Real estate property taxes paid for housing units in 2022:
This zip code:
0.6% ($1,262)
Florida:
0.7% ($2,529)
Median real estate property taxes paid for housing units with mortgages in 2022: $1,492 (0.6%) Median real estate property taxes paid for housing units with no mortgage in 2022: $953 (0.6%)
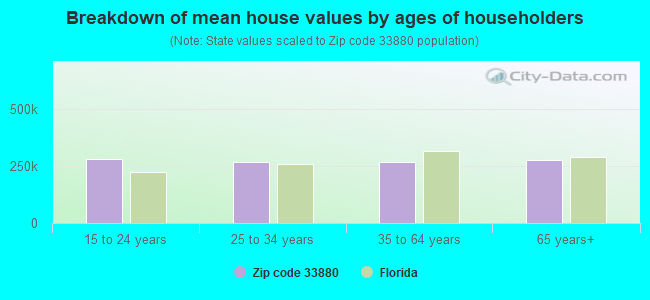
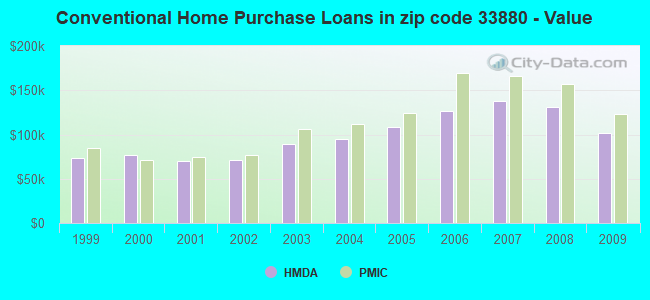
Estimated median house/condo value in 2022: $216,192
33880:
$216,192
Florida:
$354,100
According to our research of Florida and other state lists, there were 59 registered sex offenders living in 33880 zip code as of April 27, 2024. The ratio of all residents to sex offenders in zip code 33880 is 639 to 1. The ratio of registered sex offenders to all residents in this zip code is near the state average.
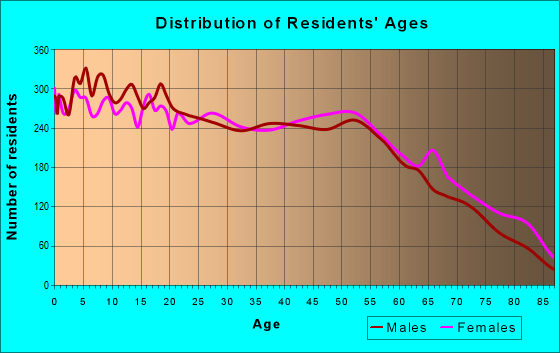
Median resident age:
This zip code:
37.6 years
Florida median age:
42.7 years
Average household size:
This zip code:
2.8 people
Florida:
2.5 people
Averages for the 2020 tax year for zip code 33880, filed in 2021:
Average Adjusted Gross Income (AGI) in 2020: $43,484 (Individual Income Tax Returns)
Here:
$43,484
State:
$82,200
Salary/wage: $38,303 (reported on 85.3% of returns)
Here:
$38,303
State:
$58,347
(% of AGI for various income ranges: 1268.6% for AGIs below $25k, 3704.5% for AGIs $25k-50k, 6413.4% for AGIs $50k-75k, 9350.9% for AGIs $75k-100k, 15482.8% for AGIs $100k-200k, 78368.3% for AGIs over 200k)
Taxable interest for individuals: $1,813 (reported on 12.8% of returns)
This zip code:
$1,813
Florida:
$4,272
(% of AGI for various income ranges: 6.3% for AGIs below $25k, 6.2% for AGIs $25k-50k, 16.8% for AGIs $50k-75k, 68.6% for AGIs $75k-100k, 173.2% for AGIs $100k-200k, 2660.0% for AGIs over 200k)
Ordinary dividends: $4,444 (reported on 8.7% of returns)
Here:
$4,444
State:
$15,863
(% of AGI for various income ranges: 9.6% for AGIs below $25k, 14.0% for AGIs $25k-50k, 51.9% for AGIs $50k-75k, 96.6% for AGIs $75k-100k, 268.3% for AGIs $100k-200k, 3958.3% for AGIs over 200k)
Net capital gain/loss in AGI: +$16,454 (reported on 7.3% of returns)
Here:
+$16,454
State:
+$62,983
(% of AGI for various income ranges: 4.3% for AGIs below $25k, 13.0% for AGIs $25k-50k, 57.1% for AGIs $50k-75k, 161.5% for AGIs $75k-100k, 453.1% for AGIs $100k-200k, 27716.7% for AGIs over 200k)
Profit/loss from business: +$6,171 (reported on 15.8% of returns)
Here:
+$6,171
State:
+$9,719
(% of AGI for various income ranges: 110.1% for AGIs below $25k, 55.2% for AGIs $25k-50k, 92.1% for AGIs $50k-75k, 227.7% for AGIs $75k-100k, 271.4% for AGIs $100k-200k, 5145.0% for AGIs over 200k)
Taxable individual retirement arrangement distribution: $14,650 (reported on 5.3% of returns)
33880:
$14,650
Florida:
$24,823
(% of AGI for various income ranges: 29.9% for AGIs below $25k, 47.5% for AGIs $25k-50k, 130.6% for AGIs $50k-75k, 237.8% for AGIs $75k-100k, 680.7% for AGIs $100k-200k, 1748.3% for AGIs over 200k)
Total itemized deductions: $37,598 (reported on 2.7% of returns)
Here:
$37,598
State:
$45,393
(% of AGI for various income ranges: 14.1% for AGIs below $25k, 61.6% for AGIs $25k-50k, 209.5% for AGIs $50k-75k, 263.8% for AGIs $75k-100k, 483.9% for AGIs $100k-200k, 10000.0% for AGIs over 200k)
Charity contributions: $12,509 (reported on 2.3% of returns)
Here:
$12,509
State:
$20,178
(% of AGI for various income ranges: 10.6% for AGIs $25k-50k, 43.2% for AGIs $50k-75k, 44.4% for AGIs $75k-100k, 167.9% for AGIs $100k-200k, 4210.0% for AGIs over 200k)
Taxes paid: $6,392 (reported on 2.5% of returns)
33880:
$6,392
State:
$6,967
(% of AGI for various income ranges: 1.4% for AGIs below $25k, 10.6% for AGIs $25k-50k, 42.7% for AGIs $50k-75k, 47.5% for AGIs $75k-100k, 96.4% for AGIs $100k-200k, 928.3% for AGIs over 200k)
Earned income credit: $2,630 (reported on 29.6% of returns)
Here:
$2,630
State:
$2,306
(% of AGI for various income ranges: 154.5% for AGIs below $25k, 97.9% for AGIs $25k-50k, 1.3% for AGIs $50k-75k)
Percentage of individuals using paid preparers for their 2020 taxes: 92.7%
Here:
93%
State:
92%
(% for various income ranges: 91.9% for AGIs below $25k, 93.5% for AGIs $25k-50k, 92.6% for AGIs $50k-75k, 92.7% for AGIs $75k-100k, 93.3% for AGIs $100k-200k, 95.7% for AGIs over 200k)
Averages for the 2012 tax year for zip code 33880, filed in 2013:
Average Adjusted Gross Income (AGI) in 2012: $35,535 (Individual Income Tax Returns)
Here:
$35,535
State:
$60,316
Salary/wage: $32,025 (reported on 85.9% of returns)
Here:
$32,025
State:
$45,277
(% of AGI for various income ranges: 79.8% for AGIs below $25k, 85.3% for AGIs $25k-50k, 81.0% for AGIs $50k-75k, 80.3% for AGIs $75k-100k, 74.8% for AGIs $100k-200k, 37.7% for AGIs over 200k)
Taxable interest for individuals: $1,590 (reported on 18.5% of returns)
This zip code:
$1,590
Florida:
$3,587
(% of AGI for various income ranges: 0.7% for AGIs below $25k, 0.5% for AGIs $25k-50k, 0.7% for AGIs $50k-75k, 0.7% for AGIs $75k-100k, 0.7% for AGIs $100k-200k, 2.7% for AGIs over 200k)
Ordinary dividends: $5,334 (reported on 11.0% of returns)
Here:
$5,334
State:
$12,831
(% of AGI for various income ranges: 1.9% for AGIs below $25k, 1.2% for AGIs $25k-50k, 1.0% for AGIs $50k-75k, 1.1% for AGIs $75k-100k, 1.9% for AGIs $100k-200k, 4.5% for AGIs over 200k)
Net capital gain/loss in AGI: +$10,303 (reported on 6.9% of returns)
Here:
+$10,303
State:
+$33,493
(% of AGI for various income ranges: 0.2% for AGIs $25k-50k, 0.3% for AGIs $50k-75k, 0.2% for AGIs $75k-100k, 1.9% for AGIs $100k-200k, 19.4% for AGIs over 200k)
Profit/loss from business: +$6,102 (reported on 14.2% of returns)
Here:
+$6,102
State:
+$10,012
(% of AGI for various income ranges: 7.7% for AGIs below $25k, 0.9% for AGIs $25k-50k, 1.1% for AGIs $50k-75k, 0.9% for AGIs $75k-100k, 2.7% for AGIs $100k-200k)
Taxable individual retirement arrangement distribution: $12,585 (reported on 6.6% of returns)
33880:
$12,585
Florida:
$21,544
(% of AGI for various income ranges: 1.8% for AGIs below $25k, 1.7% for AGIs $25k-50k, 2.2% for AGIs $50k-75k, 2.8% for AGIs $75k-100k, 4.1% for AGIs $100k-200k, 2.4% for AGIs over 200k)
Total itemized deductions: $18,331 (25% of AGI, reported on 13.7% of returns)
Here:
$18,331
State:
$25,533
Here:
24.6% of AGI
State:
18.0% of AGI
(% of AGI for various income ranges: 3.9% for AGIs below $25k, 7.0% for AGIs $25k-50k, 7.5% for AGIs $50k-75k, 8.7% for AGIs $75k-100k, 9.5% for AGIs $100k-200k, 6.8% for AGIs over 200k)
Charity contributions: $4,668 (reported on 9.6% of returns)
Here:
$4,668
State:
$5,698
(% of AGI for various income ranges: 0.4% for AGIs below $25k, 1.0% for AGIs $25k-50k, 1.2% for AGIs $50k-75k, 1.8% for AGIs $75k-100k, 2.1% for AGIs $100k-200k, 2.1% for AGIs over 200k)
Taxes paid: $2,837 (reported on 12.9% of returns)
33880:
$2,837
State:
$6,203
(% of AGI for various income ranges: 0.3% for AGIs below $25k, 0.8% for AGIs $25k-50k, 1.0% for AGIs $50k-75k, 1.3% for AGIs $75k-100k, 1.8% for AGIs $100k-200k, 1.5% for AGIs over 200k)
Earned income credit: $2,693 (reported on 32.7% of returns)
Here:
$2,693
State:
$2,372
(% of AGI for various income ranges: 10.2% for AGIs below $25k, 1.8% for AGIs $25k-50k)
Percentage of individuals using paid preparers for their 2012 taxes: 47.4%
Here:
47%
State:
54%
(% for various income ranges: 46.4% for AGIs below $25k, 47.4% for AGIs $25k-50k, 45.2% for AGIs $50k-75k, 46.9% for AGIs $75k-100k, 58.1% for AGIs $100k-200k, 90.9% for AGIs over 200k)
Averages for the 2004 tax year for zip code 33880, filed in 2005:
Average Adjusted Gross Income (AGI) in 2004: $33,383 (Individual Income Tax Returns)
Here:
$33,383
State:
$50,523
Salary/wage: $30,635 (reported on 87.0% of returns)
Here:
$30,635
State:
$39,563
(% of AGI for various income ranges: 107.1% for AGIs below $10k, 83.0% for AGIs $10k-25k, 86.1% for AGIs $25k-50k, 85.7% for AGIs $50k-75k, 82.9% for AGIs $75k-100k, 55.6% for AGIs over 100k)
Taxable interest for individuals: $1,833 (reported on 28.0% of returns)
This zip code:
$1,833
Florida:
$3,211
(% of AGI for various income ranges: 3.1% for AGIs below $10k, 1.7% for AGIs $10k-25k, 1.1% for AGIs $25k-50k, 0.9% for AGIs $50k-75k, 1.2% for AGIs $75k-100k, 2.7% for AGIs over 100k)
Taxable dividends: $3,015 (reported on 13.4% of returns)
Here:
$3,015
State:
$6,129
(% of AGI for various income ranges: 2.9% for AGIs below $10k, 0.8% for AGIs $10k-25k, 0.8% for AGIs $25k-50k, 0.7% for AGIs $50k-75k, 1.2% for AGIs $75k-100k, 2.6% for AGIs over 100k)
Net capital gain/loss: +$8,551 (reported on 10.9% of returns)
Here:
+$8,551
State:
+$27,205
(% of AGI for various income ranges: 0.9% for AGIs below $10k, 0.4% for AGIs $10k-25k, 0.5% for AGIs $25k-50k, 1.0% for AGIs $50k-75k, 1.3% for AGIs $75k-100k, 11.7% for AGIs over 100k)
Profit/loss from business: +$7,301 (reported on 11.8% of returns)
Here:
+$7,301
State:
+$10,634
(% of AGI for various income ranges: 1.5% for AGIs below $10k, 3.6% for AGIs $10k-25k, 2.0% for AGIs $25k-50k, 2.2% for AGIs $50k-75k, 0.9% for AGIs $75k-100k, 4.3% for AGIs over 100k)
IRA payment deduction: $2,103 (reported on 2.4% of returns)
33880:
$2,103
Florida:
$3,082
(% of AGI for various income ranges: 0.2% for AGIs below $10k, 0.1% for AGIs $10k-25k, 0.2% for AGIs $25k-50k, 0.2% for AGIs $50k-75k, 0.1% for AGIs $75k-100k, 0.1% for AGIs over 100k)
Self-employed pension: $11,031 (reported on 0.2% of returns)
Here:
$11,031
Florida:
$15,857
Total itemized deductions: $15,715 (25% of AGI, reported on 17.1% of returns)
Here:
$15,715
State:
$20,370
Here:
24.6% of AGI
State:
20.7% of AGI
(% of AGI for various income ranges: 6.9% for AGIs below $10k, 5.1% for AGIs $10k-25k, 8.5% for AGIs $25k-50k, 9.2% for AGIs $50k-75k, 9.9% for AGIs $75k-100k, 7.7% for AGIs over 100k)
Charity contributions deductions: $3,560 (5% of AGI, reported on 13.3% of returns)
Here:
$3,560
State:
$4,064
Here:
5.2% of AGI
State:
3.8% of AGI
(% of AGI for various income ranges: 0.5% for AGIs below $10k, 0.6% for AGIs $10k-25k, 1.2% for AGIs $25k-50k, 1.7% for AGIs $50k-75k, 2.0% for AGIs $75k-100k, 1.9% for AGIs over 100k)
Total tax: $4,676 (reported on 65.8% of returns)
33880:
$4,676
State:
$9,431
(% of AGI for various income ranges: 2.7% for AGIs below $10k, 3.3% for AGIs $10k-25k, 6.1% for AGIs $25k-50k, 8.4% for AGIs $50k-75k, 10.7% for AGIs $75k-100k, 19.9% for AGIs over 100k)
Earned income credit: $1,926 (reported on 26.9% of returns)
Here:
$1,926
State:
$1,808
Percentage of individuals using paid preparers for their 2004 taxes: 59.2%
Here:
59%
State:
60%
(% for various income ranges: 57.8% for AGIs below $10k, 62.2% for AGIs $10k-25k, 57.5% for AGIs $25k-50k, 56.2% for AGIs $50k-75k, 52.1% for AGIs $75k-100k, 73.4% for AGIs over 100k)
Likely homosexual households (counted as self-reported same-sex unmarried-partner households)
Lesbian couples: 0.1% of all households
Gay men: 0.1% of all households
Household received Food Stamps/SNAP in the past 12 months: 3,190 Household did not receive Food Stamps/SNAP in the past 12 months: 12,754
Women who had a birth in the past 12 months: 620 (457 now married, 170 unmarried) Women who did not have a birth in the past 12 months: 10,263 (4,130 now married, 6,132 unmarried)
Housing units in zip code 33880 with a mortgage: 5,792 (189 second mortgage, 133 both second mortgage and home equity loan) Houses without a mortgage: 86
Median monthly owner costs for units with a mortgage: $1,253 Median monthly owner costs for units without a mortgage: $421
Residents with income below the poverty level in 2022:
This zip code:
20.7%
Whole state:
12.7%
Residents with income below 50% of the poverty level in 2022:
This zip code:
9.2%
Whole state:
6.6%
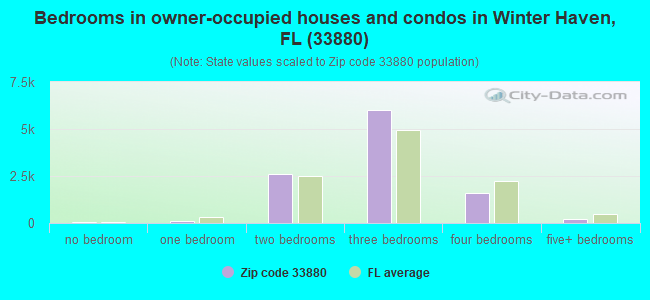
Median number of rooms in houses and condos:
Here:
5.6
State:
5.9
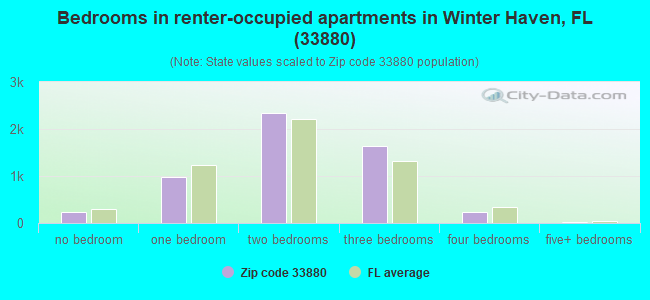
Median number of rooms in apartments:
Here:
4.8
State:
4.2
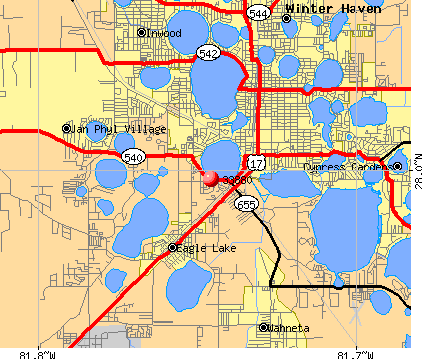
Notable locations in this zip code not listed on our city pages
Notable locations in zip code 33880: Sunshine Plaza (A), Cypress Row Plaza (B), Winter Haven Amtrak Station (C), City of Winter Haven Wastewater Treatment Plant (D), Winter Haven Motor Speedway (E), Winter Haven Public Library (F), Polk County Fire Department Station 15 Jan Phyl (G), Polk County Fire Department Station 25 Rifle Range (H), Polk County Sheriff's Office (I), Polk County Sheriff's Office Main (J), Polk County Sheriff's Office Training (K), Polk County Sheriff's Office Northeast District Substation (L), Polk County Sheriff's Office Community Policing Unit Eloise (M). Display/hide their locations on the map
Churches in zip code 33880 include: Rifle Range Church (A), First Assembly of God Church (B), Cypress Cathedral (C), Saint Marys Anglican Church (D). Display/hide their locations on the map
Lakes: Lake Arrowhead (A), Grassy Lake (B), Lake Gwyn (C), Lake Hancock (D), Spirit Lake (E), Lake Howard (F), Lake Otis (G), Lake Rey (H). Display/hide their locations on the map
6,006 married couples with children.
3,358 single-parent households (1,136 men, 2,222 women).
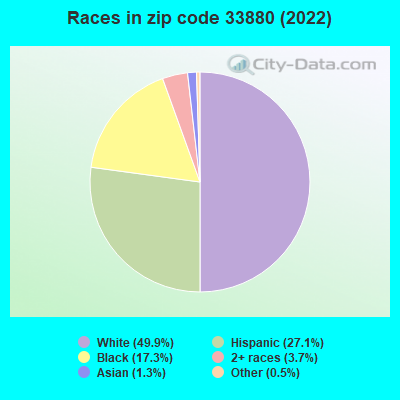
72.2% of residents of 33880 zip code speak English at home.
21.0% of residents speak Spanish at home (63% very well, 15% well, 14% not well, 8% not at all).
5.2% of residents speak other Indo-European language at home (65% very well, 20% well, 8% not well, 7% not at all).
0.9% of residents speak Asian or Pacific Island language at home (38% very well, 13% well, 40% not well, 9% not at all).
0.2% of residents speak other language at home (100% very well).
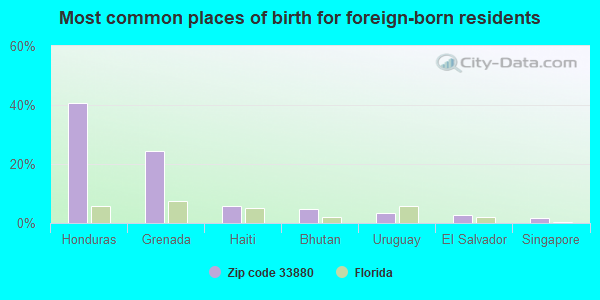
Foreign born population: 4,556 (10.1%) (39.5% of them are naturalized citizens)
This zip code:
10.1%
Whole state:
21.7%
41%Honduras
25%Grenada
6%Haiti
5%Bhutan
3%Uruguay
3%El Salvador
2%Singapore
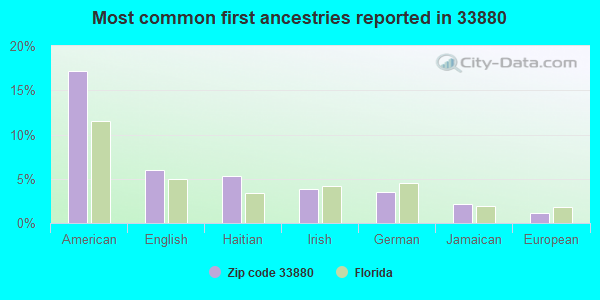
17%American
6%English
5%Haitian
4%Irish
3%German
2%Jamaican
1%European
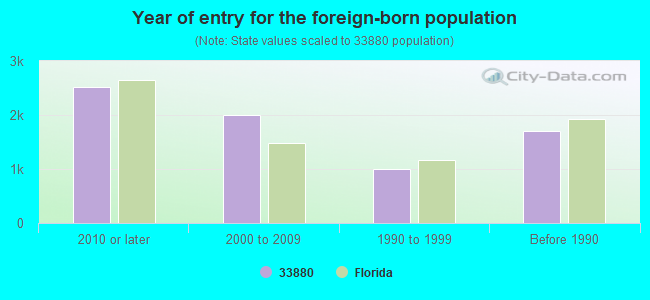
Year of entry for the foreign-born population
2,5102010 or later
1,9962000 to 2009
1,0061990 to 1999
1,705Before 1990
Public elementary/middle school in in zip code 33880 not listed on the city page:
Major facilities with environmental interests located in this zip code:
ARR MAZ PRODUCTS L P (621 SNIVELY AVE. in WINTER HAVEN, FL)
ENFORCEMENT/COMPLIANCE ACTIVITY (Integrated Compliance Information System) - ICIS-04-2003-9915, FORMAL ENFORCEMENT ACTION (Integrated Compliance Information System) - ICIS-04-2003-9915, FORMAL ENFORCEMENT ACTION COMPLIANCE ACTIVITY (Tracking inspections of insecticide, fungicide, and rodenticide, and toxic substances) CRITERIA AND HAZARDOUS AIR POLLUTANT INVENTORY (Inventory of air pollution sources) TRI REPORTER (Tracking of toxic chemicals releasing facilities) Business SIC classification: INDUSTRIAL ORGANIC CHEMICALS Alternative names: ARR-MAZ CUSTOM CHEMICALS INC, ARR-MAZ PRODUCTS
J CUSTOM COLLISION (550 AVE K SW in WINTER HAVEN, FL)
STATE MASTER (FDM) - CHAZ-FLD981473176, HAZARDOUS WASTE REGULATION PROGRAM (Resource Conservation and Recovery Act (tracking hazardous waste)) Business SIC classification: TOP, BODY, AND UPHOLSTERY REPAIR SHOPS AND PAINT SHOPS Business NAICS classification: AUTOMOTIVE BODY, PAINT, AND INTERIOR REPAIR AND MAINTENANCE. Organizations: MERISTELLA FERRARI GILBERT BOWEN (CONTACT/OWNER)
Alternative names: ARRINGTONS BODY SHOP INC
KING BROTHERS AUTO BODY & BOAT REPAIR (5605 COMMERCIAL BLVD in WINTER HAVEN, FL)
STATE MASTER (FDM) - CHAZ-FLD984258806, HAZARDOUS WASTE REGULATION PROGRAM (Resource Conservation and Recovery Act (tracking hazardous waste)) Business SIC classification: TOP, BODY, AND UPHOLSTERY REPAIR SHOPS AND PAINT SHOPS Business NAICS classification: AUTOMOTIVE BODY, PAINT, AND INTERIOR REPAIR AND MAINTENANCE. Organizations: WALTER G KING (CONTACT/OWNER)
HILL OLDSMOBILE NISSAN INC (401 6TH STREET SW in WINTER HAVEN, FL)
STATE MASTER (FDM) - CHAZ-FLD052604170, HAZARDOUS WASTE REGULATION PROGRAM (Resource Conservation and Recovery Act (tracking hazardous waste)) Business SIC classification: MOTOR VEHICLE DEALERS (NEW AND USED); TOP, BODY, AND UPHOLSTERY REPAIR SHOPS AND PAINT SHOPS; GENERAL AUTOMOTIVE REPAIR SHOPS Business NAICS classification: GENERAL AUTOMOTIVE REPAIR.; AUTOMOTIVE BODY, PAINT, AND INTERIOR REPAIR AND MAINTENANCE. Organizations: JAMES W HILL JR (CONTACT/OWNER)
S S DESIGNS INC (5558 COMMERCIAL BLVD in WINTER HAVEN, FL)
STATE MASTER (FDM) - CHAZ-FLD093594760, HAZARDOUS WASTE REGULATION PROGRAM Small Quantity Generators, between 100 kg and 1000 kg of hazardous waste/month (Resource Conservation and Recovery Act (tracking hazardous waste)) Business SIC and NAICS classification: COMMERCIAL PRINTING Organizations: BOB CARTER PRES (CONTACT/OWNER)
MILLER'S LANDING COMMERCIAL (LAKE BESS AND CR 542 in WINTER HAVEN, FL)
National Pollutant Discharge Elimination System NON-MAJOR (Tracking pollutant discharge elimination systems) - permit National Pollutant Discharge Elimination System NON-MAJOR (Tracking pollutant discharge elimination systems) - permit Organizations: ALBERT CASSIDY (CONTACT/OWNER)
, WILLIAM DROST (CONTACT/OWNER)
OSBORN MARINE (888 S LAKE HOWARD DR in WINTER HAVEN, FL)
(Integrated Compliance Information System) - ICIS-04-2000-0052, FORMAL ENFORCEMENT ACTION Small Quantity Generators, between 100 kg and 1000 kg of hazardous waste/month (Resource Conservation and Recovery Act (tracking hazardous waste)) - notification Business SIC classification: MARINAS Business NAICS classification: BOAT BUILDING. Organizations: NON NOTIFIED (CONTACT/OWNER)
LAKE SHIPP ELEMENTARY SCHOOL (250 CAMELLIA DRIVE, SW in WINTER HAVEN, FL)
(Geographic Names Information System) (National Center for Education Statistics) - STATE ID-0621 Organizations: POLK COUNTY SCHOOL DISTRICT (SCHOOL DISTRICT)
HIGH PERFORMANCE FINISHERS & EXTRUDERS INC (1201 AMERICAN SUPERIOR BOULEVARD in WINTER HAVEN, FL)
AIR MAJOR (AIRS/AFS) CRITERIA AND HAZARDOUS AIR POLLUTANT INVENTORY (Inventory of air pollution sources) HAZARDOUS WASTE BIENNIAL REPORTER (Resource Conservation and Recovery Act (tracking hazardous waste)) Large Quantity Generators, more that 1000 kg of hazardous waste/month (Resource Conservation and Recovery Act (tracking hazardous waste)) TRI REPORTER (Tracking of toxic chemicals releasing facilities) Business SIC classification: SPECIAL TRADE CONTRACTORS; COATING, ENGRAVING, AND ALLIED SERVICES Organizations: HIGH PERFORMANCE SYSTEMS, INC. (CONTACT/OPERATOR)
Alternative names: HIGH PERFORMANCE SYSTEMS INC
INWOOD ELEMENTARY SCHOOL (2200 AVENUE G NW in WINTER HAVEN, FL)
(National Center for Education Statistics) - STATE ID-0611 Organizations: POLK COUNTY SCHOOL DISTRICT (SCHOOL DISTRICT)
DENISON MIDDLE SCHOOL (400 AVE A SE in WINTER HAVEN, FL)
(National Center for Education Statistics) - STATE ID-0491 Organizations: POLK COUNTY SCHOOL DISTRICT (SCHOOL DISTRICT)
JOHN SNIVELY ELEMENTARY SCHOOL OF CHOICE (1004 SNIVELY AVE in WINTER HAVEN, FL)
(National Center for Education Statistics) - STATE ID-0631 Organizations: POLK COUNTY SCHOOL DISTRICT (SCHOOL DISTRICT)
MARK WILCOX CENTER (611 POST AVE, SW in WINTER HAVEN, FL)
(National Center for Education Statistics) - STATE ID-9210 Organizations: POLK COUNTY SCHOOL DISTRICT (SCHOOL DISTRICT)
Housing units lacking complete plumbing facilities: 0.9% Housing units lacking complete kitchen facilities: 1.0%
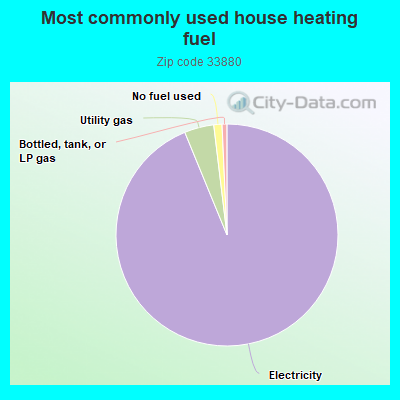
93.9%Electricity
4.3%Utility gas
1.2%No fuel used
0.7%Bottled, tank, or LP gas
Population in 1990: 30,803. Population change in the 1990s: +2,975 (+9.7%).
Place of birth for U.S.-born residents:
This state: 22,571
Northeast: 4,879
Midwest: 4,421
South: 4,722
West: 864
53% of the 33880 zip code residents lived in the same house 5 years ago. Out of people who lived in different houses, 66% lived in this county. Out of people who lived in different counties, 50% lived in Florida.
89% of the 33880 zip code residents lived in the same house 1 year ago. Out of people who lived in different houses, 46% moved from this county. Out of people who lived in different houses, 21% moved from different county within same state. Out of people who lived in different houses, 27% moved from different state. Out of people who lived in different houses, 5% moved from abroad.
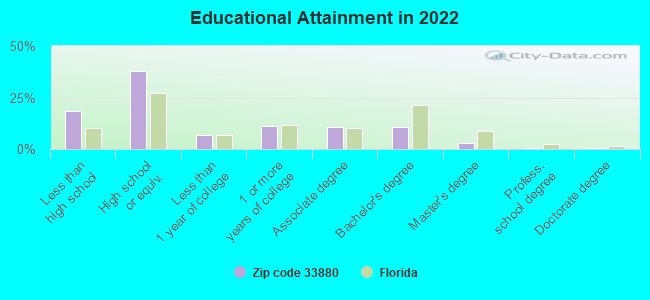
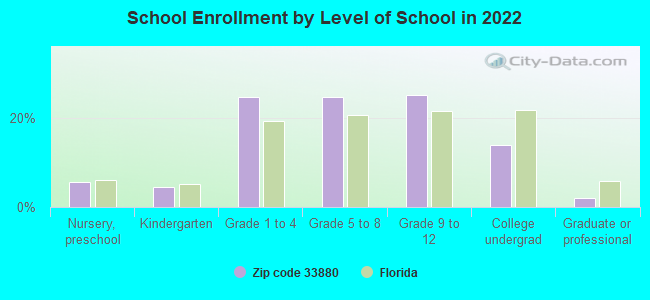
Private vs. public school enrollment:
Students in private schools in grades 1 to 8 (elementary and middle school): 1,008
Here:
19.6%
Florida:
15.8%
Students in private schools in grades 9 to 12 (high school): 194
Here:
7.4%
Florida:
12.9%
Students in private undergraduate colleges: 307
Here:
21.3%
Florida:
23.6%
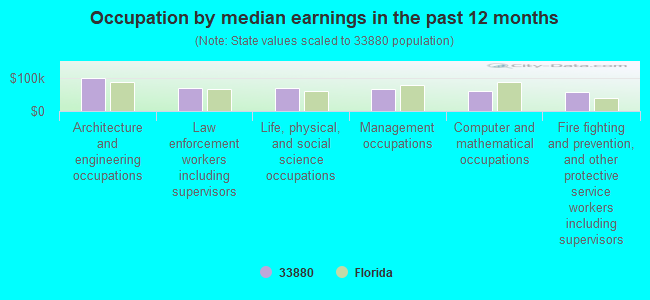
Occupation by median earnings in the past 12 months ($)
101,778Architecture and engineering occupations
70,049Law enforcement workers including supervisors
69,042Life, physical, and social science occupations
66,746Management occupations
60,791Computer and mathematical occupations
57,190Fire fighting and prevention, and other protective service workers including supervisors
Companies with federal contracts located in this zip code:
GFA DU CHATEAU FERRIERE (CHATEAU DUDON in BAURECH, In; small business)
$38,000 with Financial Crimes Enforcement Network for ADPE System Configuration. Taking place in UT. Signed on 2001-07-15. Completion date: 2001-07-15.
BOB CRAWFORD INC (1300 3RD STREET SW in WINTER HAVEN, FL; small business)
$5,120 with Army for Lodging - Hotel/Motel. Signed on 2005-03-16. Completion date: 2005-07-15.
PROGRAPHIX (212 1ST ST S in WINTER HAVEN, FL; small business)
$2,500 with Navy for Outerwear, Men's. Signed on 2005-01-19. Completion date: 2005-01-21.
Top industries in this zip code by the number of employees in 2005:
Health Care and Social Assistance: General Medical and Surgical Hospitals (over 1000 employees: 1 establishment)
Health Care and Social Assistance: Offices of Physicians (except Mental Health Specialists) (250-499: 1, 100-249: 1, 50-99: 2, 20-49: 2, 10-19: 6, 5-9: 7, 1-4: 11)
2002 - 2018 National Fire Incident Reporting System (NFIRS) incidents
According to the data from the years 2002 - 2018 the average number of fire incidents per year is 152. The highest number of fires - 246 took place in 2017, and the least - 48 in 2003. The data has a growing trend.
When looking into fire subcategories, the most incidents belonged to: Structure Fires (42.9%), and Outside Fires (40.7%).
Fire incident types reported to NFIRS in Zip Code 33880


 Nearest zip codes: 33839, 33881, 33884, 33830, 33823, 33812.
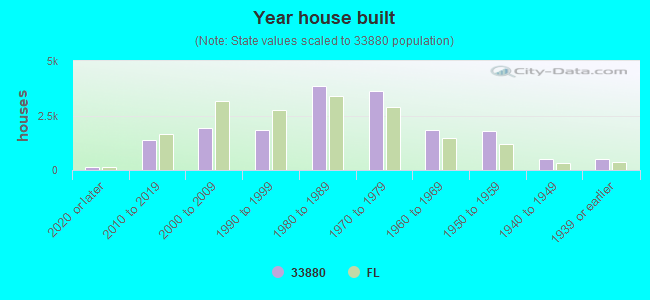


 (Students: 198, Location: 1004 SNIVELY AVE, Grades: PK-5)

 According to the data from the years 2002 - 2018 the average number of fire incidents per year is 152. The highest number of fires - 246 took place in 2017, and the least - 48 in 2003. The data has a growing trend.
 When looking into fire subcategories, the most incidents belonged to: Structure Fires (42.9%), and Outside Fires (40.7%).