Estimated zip code population in 2022: 35,050 Zip code population in 2010: 31,816 Zip code population in 2000: 33,228
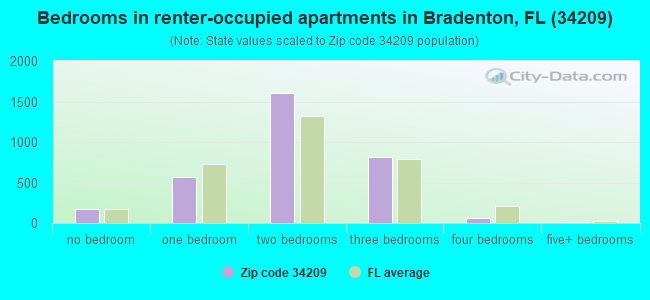
Houses and condos: 19,551 Renter-occupied apartments: 3,250
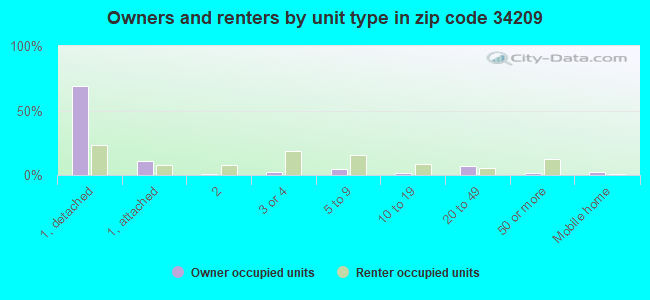
% of renters here:
21%
State:
33%
March 2022 cost of living index in zip code 34209: 95.3 (near average, U.S. average is 100)
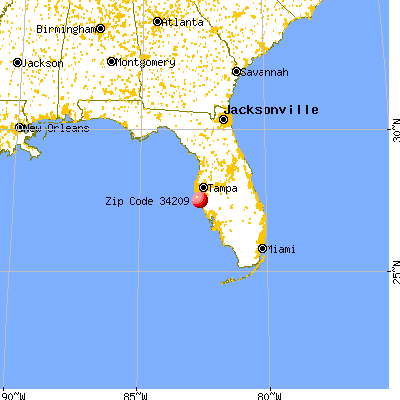
Land area: 12.6 sq. mi. Water area: 8.2 sq. mi.
Population density: 2,783 people per square mile
(average).
OSM Map
General Map
Google Map
MSN Map
OSM Map
General Map
Google Map
MSN Map
OSM Map
General Map
Google Map
MSN Map
OSM Map
General Map
Google Map
MSN Map
Please wait while loading the map...
Real estate property taxes paid for housing units in 2022:
This zip code:
0.6% ($2,544)
Florida:
0.7% ($2,529)
Median real estate property taxes paid for housing units with mortgages in 2022: $2,501 (0.6%) Median real estate property taxes paid for housing units with no mortgage in 2022: $2,602 (0.7%)
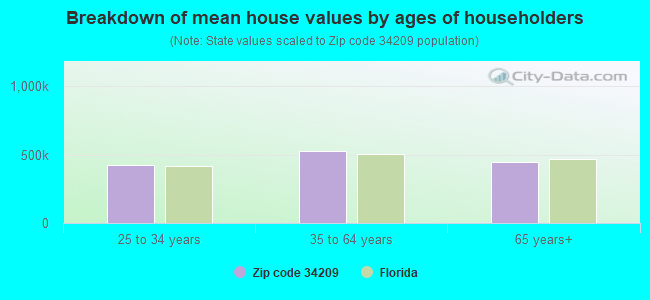
Estimated median house/condo value in 2022: $391,788
34209:
$391,788
Florida:
$354,100
According to our research of Florida and other state lists, there were 18 registered sex offenders living in 34209 zip code as of April 27, 2024. The ratio of all residents to sex offenders in zip code 34209 is 1,934 to 1. The ratio of registered sex offenders to all residents in this zip code is much lower than the state average.
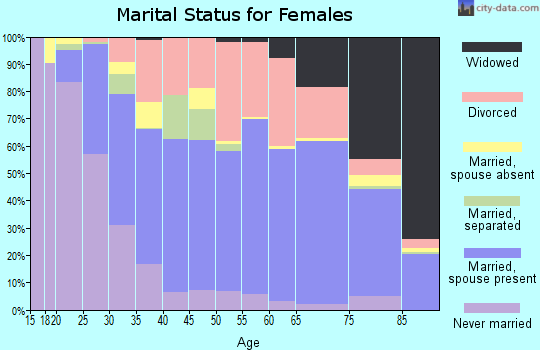
Median resident age:
This zip code:
58.0 years
Florida median age:
42.7 years
Average household size:
This zip code:
2.2 people
Florida:
2.5 people
Averages for the 2020 tax year for zip code 34209, filed in 2021:
Average Adjusted Gross Income (AGI) in 2020: $93,590 (Individual Income Tax Returns)
Here:
$93,590
State:
$82,200
Salary/wage: $62,637 (reported on 66.2% of returns)
Here:
$62,637
State:
$58,347
(% of AGI for various income ranges: 1097.7% for AGIs below $25k, 3276.9% for AGIs $25k-50k, 5559.5% for AGIs $50k-75k, 7379.3% for AGIs $75k-100k, 13569.7% for AGIs $100k-200k, 74121.6% for AGIs over 200k)
Taxable interest for individuals: $3,220 (reported on 40.3% of returns)
This zip code:
$3,220
Florida:
$4,272
(% of AGI for various income ranges: 44.7% for AGIs below $25k, 53.2% for AGIs $25k-50k, 125.8% for AGIs $50k-75k, 189.9% for AGIs $75k-100k, 338.0% for AGIs $100k-200k, 3360.6% for AGIs over 200k)
Ordinary dividends: $10,440 (reported on 32.9% of returns)
Here:
$10,440
State:
$15,863
(% of AGI for various income ranges: 81.9% for AGIs below $25k, 119.0% for AGIs $25k-50k, 304.4% for AGIs $50k-75k, 569.1% for AGIs $75k-100k, 1049.7% for AGIs $100k-200k, 8751.2% for AGIs over 200k)
Net capital gain/loss in AGI: +$24,244 (reported on 29.9% of returns)
Here:
+$24,244
State:
+$62,983
(% of AGI for various income ranges: 22.4% for AGIs below $25k, 72.2% for AGIs $25k-50k, 197.3% for AGIs $50k-75k, 466.6% for AGIs $75k-100k, 1471.5% for AGIs $100k-200k, 29016.6% for AGIs over 200k)
Profit/loss from business: +$15,456 (reported on 16.4% of returns)
Here:
+$15,456
State:
+$9,719
(% of AGI for various income ranges: 166.0% for AGIs below $25k, 170.9% for AGIs $25k-50k, 318.2% for AGIs $50k-75k, 383.3% for AGIs $75k-100k, 731.1% for AGIs $100k-200k, 4468.8% for AGIs over 200k)
Taxable individual retirement arrangement distribution: $24,526 (reported on 19.3% of returns)
34209:
$24,526
Florida:
$24,823
(% of AGI for various income ranges: 132.5% for AGIs below $25k, 237.5% for AGIs $25k-50k, 550.5% for AGIs $50k-75k, 945.2% for AGIs $75k-100k, 2299.5% for AGIs $100k-200k, 6645.0% for AGIs over 200k)
Self-employed (Keogh) retirement plans: $28,578 (reported on 0.5% of returns)
34209:
$28,578
Florida:
$29,694
(% of AGI for various income ranges: 5.5% for AGIs below $25k, 32.3% for AGIs $100k-200k, 615.6% for AGIs over 200k)
Total itemized deductions: $39,622 (reported on 9.4% of returns)
Here:
$39,622
State:
$45,393
(% of AGI for various income ranges: 86.7% for AGIs below $25k, 152.1% for AGIs $25k-50k, 384.6% for AGIs $50k-75k, 686.9% for AGIs $75k-100k, 1191.1% for AGIs $100k-200k, 8673.1% for AGIs over 200k)
Charity contributions: $13,363 (reported on 7.8% of returns)
Here:
$13,363
State:
$20,178
(% of AGI for various income ranges: 4.8% for AGIs below $25k, 18.5% for AGIs $25k-50k, 47.4% for AGIs $50k-75k, 107.7% for AGIs $75k-100k, 254.4% for AGIs $100k-200k, 3707.2% for AGIs over 200k)
Taxes paid: $6,295 (reported on 9.3% of returns)
34209:
$6,295
State:
$6,967
(% of AGI for various income ranges: 10.5% for AGIs below $25k, 20.0% for AGIs $25k-50k, 64.0% for AGIs $50k-75k, 110.1% for AGIs $75k-100k, 221.2% for AGIs $100k-200k, 1260.3% for AGIs over 200k)
Earned income credit: $1,889 (reported on 10.4% of returns)
Here:
$1,889
State:
$2,306
(% of AGI for various income ranges: 67.4% for AGIs below $25k, 40.6% for AGIs $25k-50k)
Percentage of individuals using paid preparers for their 2020 taxes: 91.9%
Here:
92%
State:
92%
(% for various income ranges: 90.1% for AGIs below $25k, 92.7% for AGIs $25k-50k, 92.1% for AGIs $50k-75k, 92.7% for AGIs $75k-100k, 92.5% for AGIs $100k-200k, 94.1% for AGIs over 200k)
Averages for the 2012 tax year for zip code 34209, filed in 2013:
Average Adjusted Gross Income (AGI) in 2012: $65,663 (Individual Income Tax Returns)
Here:
$65,663
State:
$60,316
Salary/wage: $48,911 (reported on 69.8% of returns)
Here:
$48,911
State:
$45,277
(% of AGI for various income ranges: 62.6% for AGIs below $25k, 66.3% for AGIs $25k-50k, 57.8% for AGIs $50k-75k, 56.4% for AGIs $75k-100k, 55.2% for AGIs $100k-200k, 37.7% for AGIs over 200k)
Taxable interest for individuals: $3,033 (reported on 42.6% of returns)
This zip code:
$3,033
Florida:
$3,587
(% of AGI for various income ranges: 2.9% for AGIs below $25k, 1.6% for AGIs $25k-50k, 1.9% for AGIs $50k-75k, 1.8% for AGIs $75k-100k, 2.0% for AGIs $100k-200k, 2.0% for AGIs over 200k)
Ordinary dividends: $8,662 (reported on 31.3% of returns)
Here:
$8,662
State:
$12,831
(% of AGI for various income ranges: 4.6% for AGIs below $25k, 2.9% for AGIs $25k-50k, 3.4% for AGIs $50k-75k, 3.7% for AGIs $75k-100k, 3.9% for AGIs $100k-200k, 5.2% for AGIs over 200k)
Net capital gain/loss in AGI: +$14,160 (reported on 26.9% of returns)
Here:
+$14,160
State:
+$33,493
(% of AGI for various income ranges: 0.5% for AGIs $25k-50k, 1.1% for AGIs $50k-75k, 1.4% for AGIs $75k-100k, 2.6% for AGIs $100k-200k, 15.1% for AGIs over 200k)
Profit/loss from business: +$14,665 (reported on 14.3% of returns)
Here:
+$14,665
State:
+$10,012
(% of AGI for various income ranges: 7.7% for AGIs below $25k, 2.9% for AGIs $25k-50k, 2.3% for AGIs $50k-75k, 2.2% for AGIs $75k-100k, 2.8% for AGIs $100k-200k, 3.3% for AGIs over 200k)
Taxable individual retirement arrangement distribution: $17,309 (reported on 19.8% of returns)
34209:
$17,309
Florida:
$21,544
(% of AGI for various income ranges: 6.4% for AGIs below $25k, 4.8% for AGIs $25k-50k, 5.2% for AGIs $50k-75k, 6.2% for AGIs $75k-100k, 7.6% for AGIs $100k-200k, 3.3% for AGIs over 200k)
Self-employment retirement plans: $17,900 (reported on 0.4% of returns)
34209:
$17,900
Florida:
$20,611
Total itemized deductions: $23,998 (19% of AGI, reported on 29.7% of returns)
Here:
$23,998
State:
$25,533
Here:
18.7% of AGI
State:
18.0% of AGI
(% of AGI for various income ranges: 14.4% for AGIs below $25k, 11.7% for AGIs $25k-50k, 11.9% for AGIs $50k-75k, 11.2% for AGIs $75k-100k, 12.1% for AGIs $100k-200k, 8.4% for AGIs over 200k)
Charity contributions: $5,395 (reported on 24.4% of returns)
Here:
$5,395
State:
$5,698
(% of AGI for various income ranges: 0.9% for AGIs below $25k, 1.1% for AGIs $25k-50k, 1.4% for AGIs $50k-75k, 1.7% for AGIs $75k-100k, 2.1% for AGIs $100k-200k, 2.9% for AGIs over 200k)
Taxes paid: $5,078 (reported on 29.2% of returns)
34209:
$5,078
State:
$6,203
(% of AGI for various income ranges: 2.1% for AGIs below $25k, 1.8% for AGIs $25k-50k, 2.0% for AGIs $50k-75k, 2.2% for AGIs $75k-100k, 2.9% for AGIs $100k-200k, 2.2% for AGIs over 200k)
Earned income credit: $1,987 (reported on 12.6% of returns)
Here:
$1,987
State:
$2,372
(% of AGI for various income ranges: 4.2% for AGIs below $25k, 0.6% for AGIs $25k-50k)
Percentage of individuals using paid preparers for their 2012 taxes: 53.3%
Here:
53%
State:
54%
(% for various income ranges: 47.6% for AGIs below $25k, 47.8% for AGIs $25k-50k, 56.1% for AGIs $50k-75k, 58.5% for AGIs $75k-100k, 64.8% for AGIs $100k-200k, 85.9% for AGIs over 200k)
Averages for the 2004 tax year for zip code 34209, filed in 2005:
Average Adjusted Gross Income (AGI) in 2004: $60,484 (Individual Income Tax Returns)
Here:
$60,484
State:
$50,523
Salary/wage: $44,042 (reported on 69.2% of returns)
Here:
$44,042
State:
$39,563
(% of AGI for various income ranges: 164.3% for AGIs below $10k, 58.6% for AGIs $10k-25k, 62.3% for AGIs $25k-50k, 58.5% for AGIs $50k-75k, 61.5% for AGIs $75k-100k, 39.6% for AGIs over 100k)
Taxable interest for individuals: $3,934 (reported on 58.6% of returns)
This zip code:
$3,934
Florida:
$3,211
(% of AGI for various income ranges: 24.6% for AGIs below $10k, 7.5% for AGIs $10k-25k, 4.4% for AGIs $25k-50k, 3.9% for AGIs $50k-75k, 3.8% for AGIs $75k-100k, 2.9% for AGIs over 100k)
Taxable dividends: $5,335 (reported on 39.2% of returns)
Here:
$5,335
State:
$6,129
(% of AGI for various income ranges: 20.9% for AGIs below $10k, 4.9% for AGIs $10k-25k, 3.5% for AGIs $25k-50k, 3.2% for AGIs $50k-75k, 3.4% for AGIs $75k-100k, 3.2% for AGIs over 100k)
Net capital gain/loss: +$19,625 (reported on 34.3% of returns)
Here:
+$19,625
State:
+$27,205
(% of AGI for various income ranges: -5.3% for AGIs below $10k, -0.0% for AGIs $10k-25k, 1.6% for AGIs $25k-50k, 2.1% for AGIs $50k-75k, 3.2% for AGIs $75k-100k, 20.0% for AGIs over 100k)
Profit/loss from business: +$15,103 (reported on 13.7% of returns)
Here:
+$15,103
State:
+$10,634
(% of AGI for various income ranges: 12.2% for AGIs below $10k, 4.9% for AGIs $10k-25k, 3.0% for AGIs $25k-50k, 3.7% for AGIs $50k-75k, 3.0% for AGIs $75k-100k, 3.3% for AGIs over 100k)
IRA payment deduction: $3,361 (reported on 3.5% of returns)
34209:
$3,361
Florida:
$3,082
(% of AGI for various income ranges: 0.9% for AGIs below $10k, 0.3% for AGIs $10k-25k, 0.3% for AGIs $25k-50k, 0.2% for AGIs $50k-75k, 0.2% for AGIs $75k-100k, 0.1% for AGIs over 100k)
Self-employed pension: $12,630 (reported on 0.8% of returns)
Here:
$12,630
Florida:
$15,857
(% of AGI for various income ranges: 0.1% for AGIs $25k-50k, 0.1% for AGIs $50k-75k, 0.1% for AGIs $75k-100k, 0.3% for AGIs over 100k)
Total itemized deductions: $18,781 (18% of AGI, reported on 36.3% of returns)
Here:
$18,781
State:
$20,370
Here:
18.4% of AGI
State:
20.7% of AGI
(% of AGI for various income ranges: 46.3% for AGIs below $10k, 16.7% for AGIs $10k-25k, 13.7% for AGIs $25k-50k, 13.7% for AGIs $50k-75k, 12.8% for AGIs $75k-100k, 8.3% for AGIs over 100k)
Charity contributions deductions: $4,165 (4% of AGI, reported on 31.1% of returns)
Here:
$4,165
State:
$4,064
Here:
3.8% of AGI
State:
3.8% of AGI
(% of AGI for various income ranges: 2.2% for AGIs below $10k, 1.4% for AGIs $10k-25k, 1.6% for AGIs $25k-50k, 1.8% for AGIs $50k-75k, 2.1% for AGIs $75k-100k, 2.5% for AGIs over 100k)
Total tax: $11,473 (reported on 78.9% of returns)
34209:
$11,473
State:
$9,431
(% of AGI for various income ranges: 5.6% for AGIs below $10k, 4.0% for AGIs $10k-25k, 7.4% for AGIs $25k-50k, 9.6% for AGIs $50k-75k, 10.9% for AGIs $75k-100k, 21.2% for AGIs over 100k)
Earned income credit: $1,523 (reported on 8.6% of returns)
Here:
$1,523
State:
$1,808
Percentage of individuals using paid preparers for their 2004 taxes: 60.4%
Here:
60%
State:
60%
(% for various income ranges: 53.8% for AGIs below $10k, 58.2% for AGIs $10k-25k, 59.1% for AGIs $25k-50k, 60.6% for AGIs $50k-75k, 61.3% for AGIs $75k-100k, 76.9% for AGIs over 100k)
Likely homosexual households (counted as self-reported same-sex unmarried-partner households)
Lesbian couples: 0.4% of all households
Gay men: 0.2% of all households
Household received Food Stamps/SNAP in the past 12 months: 683 Household did not receive Food Stamps/SNAP in the past 12 months: 15,034
Women who had a birth in the past 12 months: 219 (107 now married, 106 unmarried) Women who did not have a birth in the past 12 months: 5,188 (2,431 now married, 2,758 unmarried)
Housing units in zip code 34209 with a mortgage: 6,354 (719 second mortgage, 6 home equity loan, 620 both second mortgage and home equity loan) Houses without a mortgage: 345
Median monthly owner costs for units with a mortgage: $1,737 Median monthly owner costs for units without a mortgage: $679
Residents with income below the poverty level in 2022:
This zip code:
7.7%
Whole state:
12.7%
Residents with income below 50% of the poverty level in 2022:
This zip code:
4.2%
Whole state:
6.6%
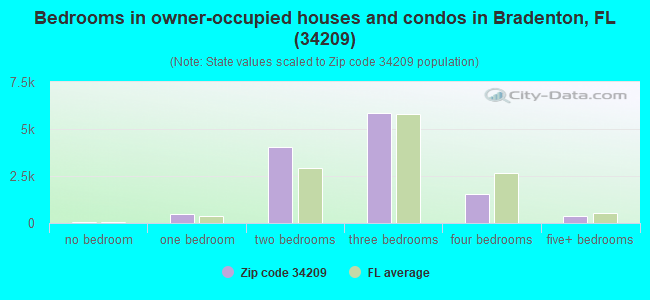
Median number of rooms in houses and condos:
Here:
5.9
State:
5.9
Median number of rooms in apartments:
Here:
4.3
State:
4.2
Notable locations in this zip code not listed on our city pages
Notable locations in zip code 34209: Manatee Plaza (A), West Manatee Fire and Rescue Station 4 (B), City of Bradenton Fire and Rescue Station 3 (C). Display/hide their locations on the map
Churches in zip code 34209 include: Northwest Baptist Church (A), Palma Sola Bay Baptist Church (B), Redeemer Lutheran Church (C), Saints Peter and Paul the Apostles Church (D), Palma Sola Church (E), Braden River Baptist Church (F). Display/hide their locations on the map
In group quarters: 811 (-1 institutionalized population)
Size of family households: 6,675 2-persons, 1,705 3-persons, 1,106 4-persons, 276 5-persons, 155 6-persons, 35 7-or-more-persons
Size of nonfamily households: 4,665 1-person, 971 2-persons, 29 3-persons
2,567 married couples with children.
1,642 single-parent households (730 men, 912 women).
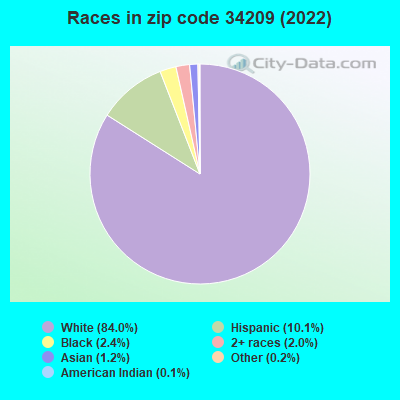
91.1% of residents of 34209 zip code speak English at home.
5.6% of residents speak Spanish at home (61% very well, 29% well, 5% not well, 5% not at all).
2.7% of residents speak other Indo-European language at home (67% very well, 28% well, 5% not well).
0.5% of residents speak Asian or Pacific Island language at home (54% very well, 35% well, 11% not well).
0.3% of residents speak other language at home (89% very well, 11% well).
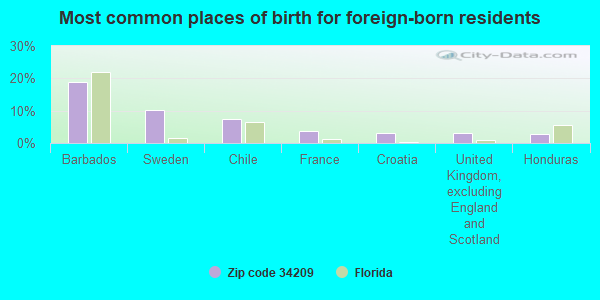
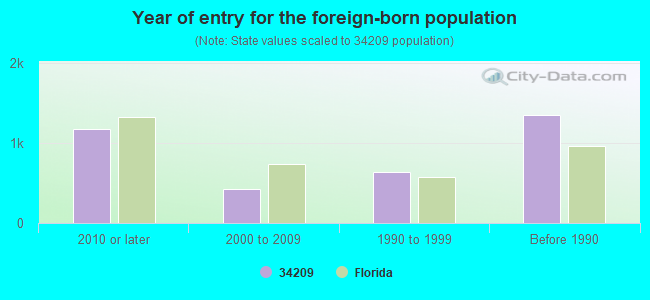
Foreign born population: 2,925 (8.3%) (56.8% of them are naturalized citizens)
Major facilities with environmental interests located in this zip code:
MARTHA B KING MIDDLE SCHOOL (600 75TH ST, NW in BRADENTON, FL)
(Geographic Names Information System) (National Center for Education Statistics) - STATE ID-0611 National Pollutant Discharge Elimination System NON-MAJOR (Tracking pollutant discharge elimination systems) - permit Organizations: TOM PEACOCK (CONTACT/OWNER)
, MANATEE COUNTY SCHOOL DISTRICT (SCHOOL DISTRICT)
H. S. MOODY ELEMENTARY SCHOOL (5425 38TH AVE, WEST in BRADENTON, FL)
(Geographic Names Information System) (National Center for Education Statistics) - STATE ID-0601 Organizations: MANATEE COUNTY SCHOOL DISTRICT (SCHOOL DISTRICT)
PALMA SOLA ELEMENTARY SCHOOL (6806 5TH AVE, NW in BRADENTON, FL)
(Geographic Names Information System) (National Center for Education Statistics) - STATE ID-0291 Organizations: MANATEE COUNTY SCHOOL DISTRICT (SCHOOL DISTRICT)
RICHARD MILBURN ACADEMY (6210 - 17TH AVENUE, WEST in BRADENTON, FL)
(National Center for Education Statistics) - STATE ID-2107 Organizations: MANATEE COUNTY SCHOOL DISTRICT (SCHOOL DISTRICT)
SEA BREEZE ELEMENTARY SCHOOL (3601 71ST ST, W in BRADENTON, FL)
(National Center for Education Statistics) - STATE ID-0671 Organizations: MANATEE COUNTY SCHOOL DISTRICT (SCHOOL DISTRICT)
SHOPPES OF PARADISE BAY PHASE (7474 CORTEZ RD W in BRADENTON, FL)
National Pollutant Discharge Elimination System NON-MAJOR (Tracking pollutant discharge elimination systems) - permit Organizations: DON SICKING (CONTACT/OWNER)
SHOPPES OF PARADISE BAY PHASE (7102 CORTEZ RD W in BRADENTON, FL)
National Pollutant Discharge Elimination System NON-MAJOR (Tracking pollutant discharge elimination systems) - permit Organizations: DON SICKING (CONTACT/OWNER)
HIDDEN LAKES CONDOMINIUMS (CORNER OF 9TH AVE W AND 67TH S in BRADENTON, FL)
National Pollutant Discharge Elimination System NON-MAJOR (Tracking pollutant discharge elimination systems) - permit Organizations: PETER VAN BUSKIRK (CONTACT/OWNER)
MIDAS MUFFLER (6712 MANATEE AVE in BRADENTON, FL)
(Resource Conservation and Recovery Act (tracking hazardous waste)) Business NAICS classification: GENERAL AUTOMOTIVE REPAIR. Organizations: NON-NOTIFIER (CONTACT/OWNER)
PALMA SOLA BAY CLUB (3400 75TH ST W in BRADENTON, FL)
National Pollutant Discharge Elimination System NON-MAJOR (Tracking pollutant discharge elimination systems) - permit Organizations: EVELYN TREWORGY (CONTACT/OWNER)
PINNACLE MEDICAL AT 75TH (315 W 75TH ST in BRADENTON, FL)
National Pollutant Discharge Elimination System NON-MAJOR (Tracking pollutant discharge elimination systems) - permit Organizations: MARK KALINS (CONTACT/OWNER)
BLAKE MEDICAL CENTER PHASE 2A (SW CORNER OF 61ST STREET WEST in BRADENTON, FL)
National Pollutant Discharge Elimination System NON-MAJOR (Tracking pollutant discharge elimination systems) - permit Organizations: DANIEL FRIEDRICH (CONTACT/OWNER)
SAN MICHELE (AT UNIVERSITY COM (NW CORNER OF BROADWAY & TUTTLE in BRADENTON, FL)
National Pollutant Discharge Elimination System NON-MAJOR (Tracking pollutant discharge elimination systems) - permit Organizations: CHRISTOPHER CHEW (CONTACT/OWNER)
Housing units lacking complete plumbing facilities: 0.4% Housing units lacking complete kitchen facilities: 1.1%
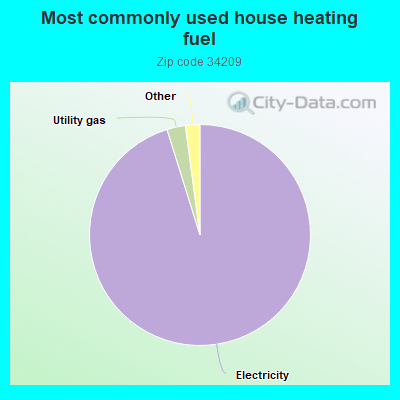
95.1%Electricity
2.7%Utility gas
0.8%No fuel used
0.7%Bottled, tank, or LP gas
Population in 1990: 30,012. Population change in the 1990s: +3,216 (+10.7%).
Place of birth for U.S.-born residents:
This state: 9,772
Northeast: 8,414
Midwest: 7,777
South: 4,088
West: 1,309
56% of the 34209 zip code residents lived in the same house 5 years ago. Out of people who lived in different houses, 55% lived in this county. Out of people who lived in different counties, 50% lived in Florida.
85% of the 34209 zip code residents lived in the same house 1 year ago. Out of people who lived in different houses, 45% moved from this county. Out of people who lived in different houses, 21% moved from different county within same state. Out of people who lived in different houses, 28% moved from different state. Out of people who lived in different houses, 4% moved from abroad.
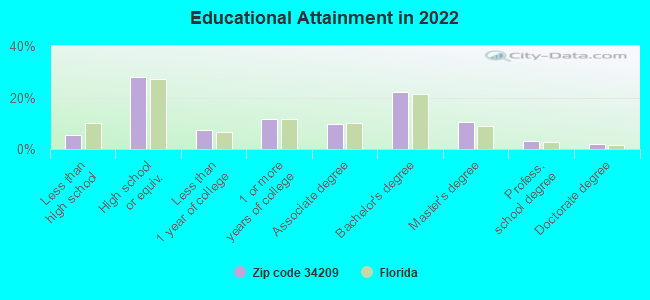
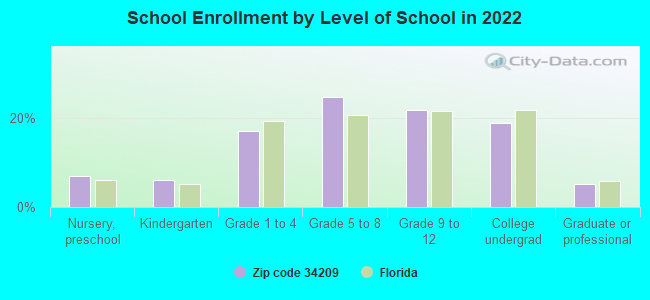
Private vs. public school enrollment:
Students in private schools in grades 1 to 8 (elementary and middle school): 421
Here:
20.0%
Florida:
15.8%
Students in private schools in grades 9 to 12 (high school): 194
Here:
17.8%
Florida:
12.9%
Students in private undergraduate colleges: 262
Here:
27.7%
Florida:
23.6%
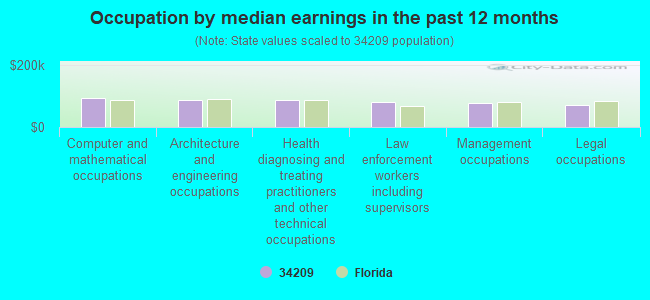
Occupation by median earnings in the past 12 months ($)
95,027Computer and mathematical occupations
87,419Architecture and engineering occupations
86,316Health diagnosing and treating practitioners and other technical occupations
80,939Law enforcement workers including supervisors
77,914Management occupations
70,132Legal occupations
Companies with federal contracts located in this zip code:
COMPERIPHERAL INC (4501 MANATEE AVE W 142 in BRADENTON, FL; small business) : $11,848,899 in 494 contractsfrom 2002 to 2006
Contracts for Antennas, Waveguides, and Related Equipment, Electrical and Electronic assemblies, Boards, Cards, and Associated Hardware, Pressure, Temperature, and Humidity Measuring and Controlling Instruments, Miscellaneous Communication Equipment, and moreby Defense Logistics Agency, Air Force Signed by year:2000: $0; 2001: $0; 2002: $25,568; 2003: $666,368; 2004: $2,879,691; 2005: $5,520,210; 2006: $2,757,062.
Biggest contracts:
$502,668 with Defense Logistics Agency for Antennas, Waveguides, and Related Equipment. Signed on 2005-10-26. Completion date: 2007-04-17.
$363,475 with Defense Logistics Agency for Electrical and Electronic assemblies, Boards, Cards, and Associated Hardware. Signed on 2004-11-23. Completion date: 2005-07-01.
$221,452 with Defense Logistics Agency for Pressure, Temperature, and Humidity Measuring and Controlling Instruments. Signed on 2005-06-07. Completion date: 2006-06-02.
$206,340 with Defense Logistics Agency for Miscellaneous Communication Equipment. Signed on 2005-10-31. Completion date: 2007-03-10.
RIGHT SAFETY WARE,INC (7814 4TH AVENUE WEST in BRADENTON, FL; small business) : $279,185 in 7 contractsfrom 2000 to 2005
Contracts for Clothing, Special Purpose, Tents and Tarpaulins, Safety and Rescue Equipment by Air Force, Federal Bureau of Investigation Signed by year:2000: $42,738; 2001: $55,000; 2002: $0; 2003: $169,923; 2004: $0; 2005: $11,524; 2006: $0.
Biggest contracts:
$64,374 with Air Force for Clothing, Special Purpose. Taking place in SC. Signed on 2003-05-27. Completion date: 2003-06-30.
$60,942, same as above.Signed on 2003-05-07. Completion date: 2003-06-13.
$55,000 with Federal Bureau of Investigation for Tents and Tarpaulins. Signed on 2001-09-15. Completion date: 2001-10-15.
$42,738 with Air Force for Safety and Rescue Equipment. Taking place in SC. Signed on 2000-09-01. Completion date: 2000-10-02.
1800ENDOSCOPE COM LLC (6220 MANATEE AVE W STE 301 in BRADENTON, FL; small business)
$8,300 with Army for Hospital Furniture, Equipment, Utensils, and Supplies. Signed on 2004-08-23. Completion date: 2004-08-31.
Top industries in this zip code by the number of employees in 2005:
Health Care and Social Assistance: General Medical and Surgical Hospitals (over 1000 employees: 1 establishment)
Health Care and Social Assistance: Offices of Physicians (except Mental Health Specialists) (100-249: 1, 50-99: 2, 20-49: 6, 10-19: 15, 5-9: 16, 1-4: 29)
Health Care and Social Assistance: Nursing Care Facilities (250-499: 1, 100-249: 3, 20-49: 1)
Other Services (except Public Administration): Civic and Social Organizations (250-499: 1, 10-19: 3, 1-4: 3)
2002 - 2018 National Fire Incident Reporting System (NFIRS) incidents
Based on the data from the years 2002 - 2018 the average number of fire incidents per year is 68. The highest number of reported fire incidents - 102 took place in 2004, and the least - 39 in 2015. The data has a declining trend.
When looking into fire subcategories, the most incidents belonged to: Outside Fires (41.6%), and Structure Fires (34.0%).
Fire incident types reported to NFIRS in Zip Code 34209


 Nearest zip codes: 34215, 34217, 34210, 34205, 34216, 34207.
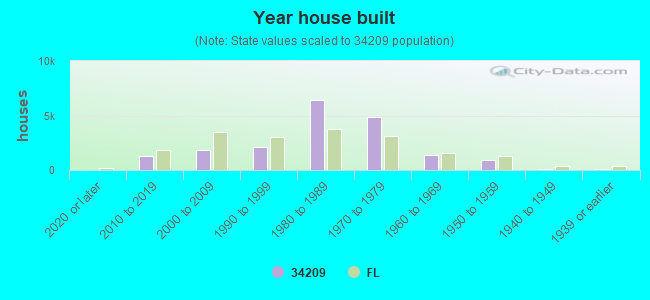


 Based on the data from the years 2002 - 2018 the average number of fire incidents per year is 68. The highest number of reported fire incidents - 102 took place in 2004, and the least - 39 in 2015. The data has a declining trend.
 When looking into fire subcategories, the most incidents belonged to: Outside Fires (41.6%), and Structure Fires (34.0%).