Estimated zip code population in 2022: 22,230 Zip code population in 2010: 19,788 Zip code population in 2000: 20,511
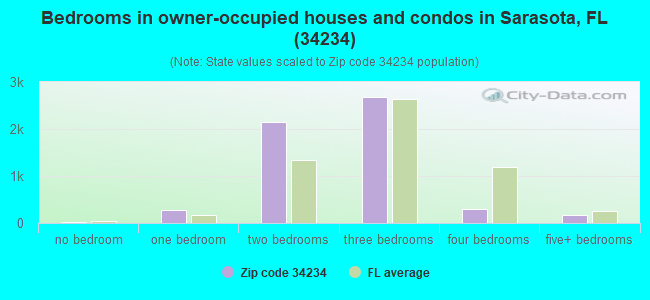
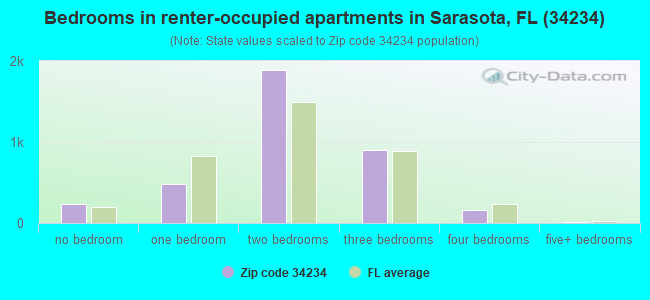
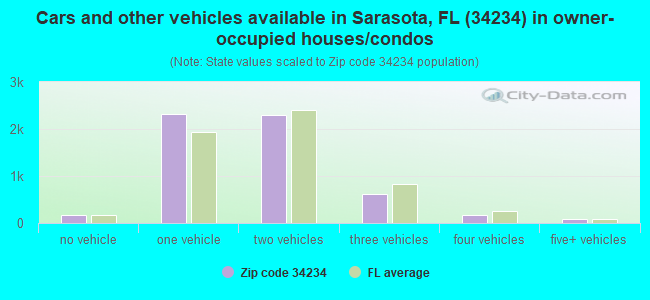
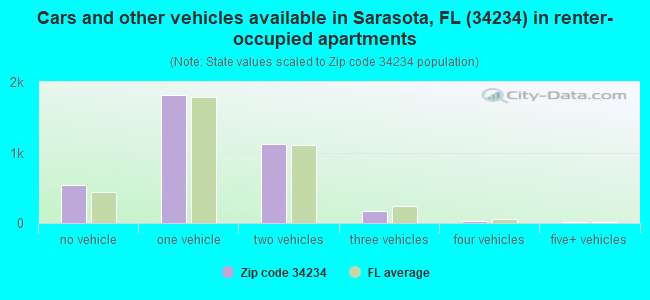
Houses and condos: 10,609 Renter-occupied apartments: 3,673
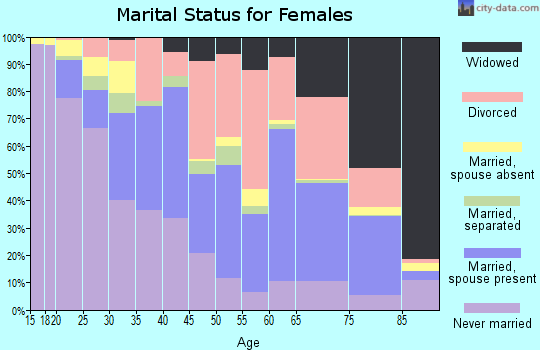
% of renters here:
39%
State:
33%
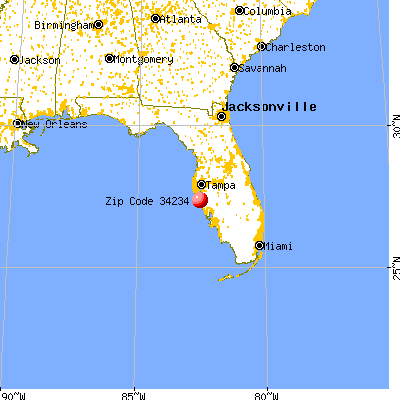
March 2022 cost of living index in zip code 34234: 93.7 (less than average, U.S. average is 100)
Land area: 6.6 sq. mi. Water area: 2.7 sq. mi.
Population density: 3,348 people per square mile
(average).
OSM Map
General Map
Google Map
MSN Map
OSM Map
General Map
Google Map
MSN Map
OSM Map
General Map
Google Map
MSN Map
OSM Map
General Map
Google Map
MSN Map
Please wait while loading the map...
Real estate property taxes paid for housing units in 2022:
This zip code:
0.6% ($1,399)
Florida:
0.7% ($2,529)
Median real estate property taxes paid for housing units with mortgages in 2022: $1,376 (0.5%) Median real estate property taxes paid for housing units with no mortgage in 2022: $1,419 (0.7%)
Averages for the 2020 tax year for zip code 34234, filed in 2021:
Average Adjusted Gross Income (AGI) in 2020: $50,444 (Individual Income Tax Returns)
Here:
$50,444
State:
$82,200
Salary/wage: $35,049 (reported on 80.8% of returns)
Here:
$35,049
State:
$58,347
(% of AGI for various income ranges: 1217.1% for AGIs below $25k, 3789.6% for AGIs $25k-50k, 6557.1% for AGIs $50k-75k, 9805.8% for AGIs $75k-100k, 15794.5% for AGIs $100k-200k, 104125.0% for AGIs over 200k)
Taxable interest for individuals: $2,347 (reported on 15.6% of returns)
This zip code:
$2,347
Florida:
$4,272
(% of AGI for various income ranges: 8.1% for AGIs below $25k, 14.2% for AGIs $25k-50k, 53.7% for AGIs $50k-75k, 81.2% for AGIs $75k-100k, 401.8% for AGIs $100k-200k, 3932.5% for AGIs over 200k)
Ordinary dividends: $18,793 (reported on 11.4% of returns)
Here:
$18,793
State:
$15,863
(% of AGI for various income ranges: 13.2% for AGIs below $25k, 27.8% for AGIs $25k-50k, 95.9% for AGIs $50k-75k, 213.1% for AGIs $75k-100k, 922.7% for AGIs $100k-200k, 43265.0% for AGIs over 200k)
Net capital gain/loss in AGI: +$30,177 (reported on 10.4% of returns)
Here:
+$30,177
State:
+$62,983
(% of AGI for various income ranges: 6.4% for AGIs below $25k, 19.1% for AGIs $25k-50k, 176.3% for AGIs $50k-75k, 419.2% for AGIs $75k-100k, 1518.6% for AGIs $100k-200k, 63707.5% for AGIs over 200k)
Profit/loss from business: +$7,593 (reported on 20.5% of returns)
Here:
+$7,593
State:
+$9,719
(% of AGI for various income ranges: 160.1% for AGIs below $25k, 131.2% for AGIs $25k-50k, 246.9% for AGIs $50k-75k, 413.8% for AGIs $75k-100k, 646.8% for AGIs $100k-200k, 5770.0% for AGIs over 200k)
Taxable individual retirement arrangement distribution: $20,593 (reported on 6.7% of returns)
34234:
$20,593
Florida:
$24,823
(% of AGI for various income ranges: 31.4% for AGIs below $25k, 78.8% for AGIs $25k-50k, 197.1% for AGIs $50k-75k, 632.3% for AGIs $75k-100k, 1519.5% for AGIs $100k-200k, 11035.0% for AGIs over 200k)
Total itemized deductions: $41,026 (reported on 4.1% of returns)
Here:
$41,026
State:
$45,393
(% of AGI for various income ranges: 40.9% for AGIs below $25k, 91.7% for AGIs $25k-50k, 256.7% for AGIs $50k-75k, 472.3% for AGIs $75k-100k, 1140.0% for AGIs $100k-200k, 19402.5% for AGIs over 200k)
Charity contributions: $19,839 (reported on 2.7% of returns)
Here:
$19,839
State:
$20,178
(% of AGI for various income ranges: 1.8% for AGIs below $25k, 12.0% for AGIs $25k-50k, 39.5% for AGIs $50k-75k, 71.9% for AGIs $75k-100k, 168.2% for AGIs $100k-200k, 10835.0% for AGIs over 200k)
Taxes paid: $5,305 (reported on 3.8% of returns)
34234:
$5,305
State:
$6,967
(% of AGI for various income ranges: 4.1% for AGIs below $25k, 9.2% for AGIs $25k-50k, 32.2% for AGIs $50k-75k, 65.8% for AGIs $75k-100k, 208.2% for AGIs $100k-200k, 2037.5% for AGIs over 200k)
Earned income credit: $2,497 (reported on 29.1% of returns)
Here:
$2,497
State:
$2,306
(% of AGI for various income ranges: 148.3% for AGIs below $25k, 77.9% for AGIs $25k-50k)
Percentage of individuals using paid preparers for their 2020 taxes: 92.5%
Here:
92%
State:
92%
(% for various income ranges: 91.6% for AGIs below $25k, 93.2% for AGIs $25k-50k, 93.0% for AGIs $50k-75k, 93.3% for AGIs $75k-100k, 93.3% for AGIs $100k-200k, 95.0% for AGIs over 200k)
Averages for the 2012 tax year for zip code 34234, filed in 2013:
Average Adjusted Gross Income (AGI) in 2012: $36,744 (Individual Income Tax Returns)
Here:
$36,744
State:
$60,316
Salary/wage: $28,769 (reported on 79.8% of returns)
Here:
$28,769
State:
$45,277
(% of AGI for various income ranges: 73.5% for AGIs below $25k, 79.9% for AGIs $25k-50k, 70.1% for AGIs $50k-75k, 64.0% for AGIs $75k-100k, 53.8% for AGIs $100k-200k, 33.0% for AGIs over 200k)
Taxable interest for individuals: $2,856 (reported on 18.5% of returns)
This zip code:
$2,856
Florida:
$3,587
(% of AGI for various income ranges: 1.4% for AGIs below $25k, 1.0% for AGIs $25k-50k, 1.2% for AGIs $50k-75k, 0.9% for AGIs $75k-100k, 1.9% for AGIs $100k-200k, 2.0% for AGIs over 200k)
Ordinary dividends: $17,530 (reported on 12.5% of returns)
Here:
$17,530
State:
$12,831
(% of AGI for various income ranges: 3.4% for AGIs below $25k, 2.3% for AGIs $25k-50k, 2.7% for AGIs $50k-75k, 1.4% for AGIs $75k-100k, 2.6% for AGIs $100k-200k, 17.3% for AGIs over 200k)
Net capital gain/loss in AGI: +$14,823 (reported on 9.7% of returns)
Here:
+$14,823
State:
+$33,493
(% of AGI for various income ranges: 0.6% for AGIs $25k-50k, 1.4% for AGIs $50k-75k, 0.2% for AGIs $75k-100k, 3.6% for AGIs $100k-200k, 14.1% for AGIs over 200k)
Profit/loss from business: +$9,408 (reported on 15.9% of returns)
Here:
+$9,408
State:
+$10,012
(% of AGI for various income ranges: 10.5% for AGIs below $25k, 1.8% for AGIs $25k-50k, 2.6% for AGIs $50k-75k, 2.0% for AGIs $75k-100k, 4.3% for AGIs $100k-200k, 1.8% for AGIs over 200k)
Taxable individual retirement arrangement distribution: $16,640 (reported on 7.7% of returns)
34234:
$16,640
Florida:
$21,544
(% of AGI for various income ranges: 1.9% for AGIs below $25k, 1.9% for AGIs $25k-50k, 3.7% for AGIs $50k-75k, 6.4% for AGIs $75k-100k, 7.0% for AGIs $100k-200k, 3.8% for AGIs over 200k)
Total itemized deductions: $23,791 (23% of AGI, reported on 15.0% of returns)
Here:
$23,791
State:
$25,533
Here:
23.0% of AGI
State:
18.0% of AGI
(% of AGI for various income ranges: 5.5% for AGIs below $25k, 8.3% for AGIs $25k-50k, 10.0% for AGIs $50k-75k, 10.1% for AGIs $75k-100k, 11.3% for AGIs $100k-200k, 14.2% for AGIs over 200k)
Charity contributions: $5,584 (reported on 11.4% of returns)
Here:
$5,584
State:
$5,698
(% of AGI for various income ranges: 0.5% for AGIs below $25k, 1.0% for AGIs $25k-50k, 1.4% for AGIs $50k-75k, 1.5% for AGIs $75k-100k, 1.6% for AGIs $100k-200k, 4.0% for AGIs over 200k)
Taxes paid: $4,937 (reported on 14.0% of returns)
34234:
$4,937
State:
$6,203
(% of AGI for various income ranges: 0.8% for AGIs below $25k, 1.5% for AGIs $25k-50k, 1.7% for AGIs $50k-75k, 2.0% for AGIs $75k-100k, 2.9% for AGIs $100k-200k, 2.9% for AGIs over 200k)
Earned income credit: $2,648 (reported on 34.0% of returns)
Here:
$2,648
State:
$2,372
(% of AGI for various income ranges: 9.9% for AGIs below $25k, 1.3% for AGIs $25k-50k)
Percentage of individuals using paid preparers for their 2012 taxes: 47.1%
Here:
47%
State:
54%
(% for various income ranges: 44.9% for AGIs below $25k, 44.7% for AGIs $25k-50k, 54.1% for AGIs $50k-75k, 51.7% for AGIs $75k-100k, 65.4% for AGIs $100k-200k, 100.0% for AGIs over 200k)
Averages for the 2004 tax year for zip code 34234, filed in 2005:
Average Adjusted Gross Income (AGI) in 2004: $35,552 (Individual Income Tax Returns)
Here:
$35,552
State:
$50,523
Salary/wage: $25,856 (reported on 84.3% of returns)
Here:
$25,856
State:
$39,563
(% of AGI for various income ranges: 153.4% for AGIs below $10k, 82.9% for AGIs $10k-25k, 82.0% for AGIs $25k-50k, 73.2% for AGIs $50k-75k, 66.0% for AGIs $75k-100k, 26.4% for AGIs over 100k)
Taxable interest for individuals: $2,274 (reported on 27.3% of returns)
This zip code:
$2,274
Florida:
$3,211
(% of AGI for various income ranges: 5.6% for AGIs below $10k, 1.8% for AGIs $10k-25k, 1.5% for AGIs $25k-50k, 1.7% for AGIs $50k-75k, 1.6% for AGIs $75k-100k, 1.7% for AGIs over 100k)
Taxable dividends: $5,052 (reported on 14.8% of returns)
Here:
$5,052
State:
$6,129
(% of AGI for various income ranges: 4.2% for AGIs below $10k, 1.3% for AGIs $10k-25k, 1.1% for AGIs $25k-50k, 1.5% for AGIs $50k-75k, 2.2% for AGIs $75k-100k, 3.3% for AGIs over 100k)
Net capital gain/loss: +$56,672 (reported on 12.3% of returns)
Here:
+$56,672
State:
+$27,205
(% of AGI for various income ranges: -1.7% for AGIs below $10k, 0.2% for AGIs $10k-25k, 0.7% for AGIs $25k-50k, 1.4% for AGIs $50k-75k, 5.0% for AGIs $75k-100k, 52.5% for AGIs over 100k)
Profit/loss from business: +$8,430 (reported on 12.9% of returns)
Here:
+$8,430
State:
+$10,634
(% of AGI for various income ranges: 6.1% for AGIs below $10k, 4.3% for AGIs $10k-25k, 2.3% for AGIs $25k-50k, 3.3% for AGIs $50k-75k, 5.5% for AGIs $75k-100k, 2.3% for AGIs over 100k)
IRA payment deduction: $2,578 (reported on 2.0% of returns)
34234:
$2,578
Florida:
$3,082
(% of AGI for various income ranges: 0.2% for AGIs $10k-25k, 0.2% for AGIs $25k-50k, 0.2% for AGIs $50k-75k, 0.3% for AGIs $75k-100k, 0.1% for AGIs over 100k)
Self-employed pension: $8,000 (reported on 0.3% of returns)
Here:
$8,000
Florida:
$15,857
Total itemized deductions: $16,441 (19% of AGI, reported on 19.3% of returns)
Here:
$16,441
State:
$20,370
Here:
19.3% of AGI
State:
20.7% of AGI
(% of AGI for various income ranges: 16.5% for AGIs below $10k, 8.4% for AGIs $10k-25k, 10.8% for AGIs $25k-50k, 11.5% for AGIs $50k-75k, 11.9% for AGIs $75k-100k, 6.0% for AGIs over 100k)
Charity contributions deductions: $3,382 (4% of AGI, reported on 15.7% of returns)
Here:
$3,382
State:
$4,064
Here:
3.6% of AGI
State:
3.8% of AGI
(% of AGI for various income ranges: 1.2% for AGIs below $10k, 1.1% for AGIs $10k-25k, 1.5% for AGIs $25k-50k, 2.1% for AGIs $50k-75k, 1.6% for AGIs $75k-100k, 1.5% for AGIs over 100k)
Total tax: $6,433 (reported on 63.2% of returns)
34234:
$6,433
State:
$9,431
(% of AGI for various income ranges: 3.7% for AGIs below $10k, 3.4% for AGIs $10k-25k, 6.7% for AGIs $25k-50k, 10.1% for AGIs $50k-75k, 12.1% for AGIs $75k-100k, 19.4% for AGIs over 100k)
Earned income credit: $1,867 (reported on 31.7% of returns)
Here:
$1,867
State:
$1,808
Percentage of individuals using paid preparers for their 2004 taxes: 63.4%
Here:
63%
State:
60%
(% for various income ranges: 62.5% for AGIs below $10k, 65.9% for AGIs $10k-25k, 58.1% for AGIs $25k-50k, 66.5% for AGIs $50k-75k, 61.0% for AGIs $75k-100k, 83.3% for AGIs over 100k)
Likely homosexual households (counted as self-reported same-sex unmarried-partner households)
Lesbian couples: 0.2% of all households
Gay men: 0.4% of all households
Household received Food Stamps/SNAP in the past 12 months: 1,597 Household did not receive Food Stamps/SNAP in the past 12 months: 7,699
Women who had a birth in the past 12 months: 120 (27 now married, 85 unmarried) Women who did not have a birth in the past 12 months: 4,827 (1,412 now married, 3,412 unmarried)
Housing units in zip code 34234 with a mortgage: 2,422 (145 second mortgage, 128 both second mortgage and home equity loan) Houses without a mortgage: 163
Median monthly owner costs for units with a mortgage: $1,603 Median monthly owner costs for units without a mortgage: $590
Residents with income below the poverty level in 2022:
This zip code:
20.7%
Whole state:
12.7%
Residents with income below 50% of the poverty level in 2022:
This zip code:
11.1%
Whole state:
6.6%
Median number of rooms in houses and condos:
Here:
5.1
State:
5.9
Median number of rooms in apartments:
Here:
4.3
State:
4.2
Notable locations in this zip code not listed on our city pages
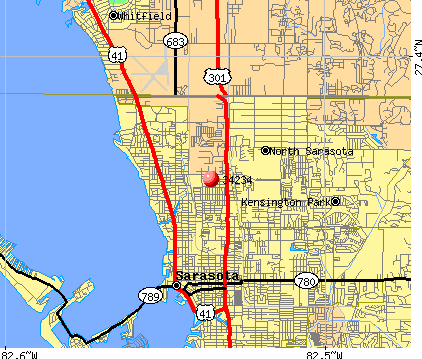
Notable locations in zip code 34234: Ringling Museum of Art (A), Sarasota County Fire Department Station 4 (B), Ambitrans Medical Transport (C), Sarasota Police Department Substation (D). Display/hide their locations on the map
Churches in zip code 34234 include: Saint Marthas Catholic Church (A), Mount Calvary Baptist Church (B), Kensington Park Baptist Church (C). Display/hide their locations on the map
1,459 married couples with children.
1,866 single-parent households (275 men, 1,591 women).
78.6% of residents of 34234 zip code speak English at home.
18.9% of residents speak Spanish at home (46% very well, 31% well, 15% not well, 8% not at all).
1.5% of residents speak other Indo-European language at home (63% very well, 34% well, 2% not well).
0.5% of residents speak Asian or Pacific Island language at home (70% very well, 23% well, 7% not well).
0.1% of residents speak other language at home (46% very well, 54% well).
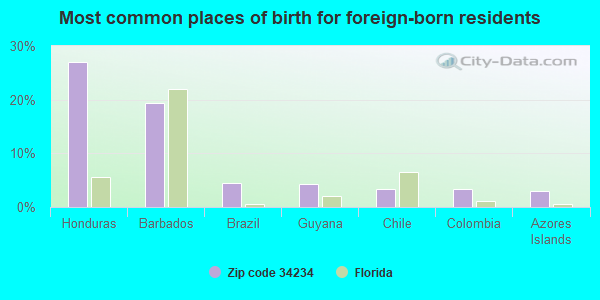
Foreign born population: 3,573 (16.1%) (59.8% of them are naturalized citizens)
Major facilities with environmental interests located in this zip code:
MKM SARASOTA LLC (2363 INDUSTRIAL BLVD in SARASOTA, FL)
STATE MASTER (FDM) - CHAZ-FLD041071523, HAZARDOUS WASTE REGULATION PROGRAM (Resource Conservation and Recovery Act (tracking hazardous waste)) Business SIC classification: PRINTING TRADES MACHINERY AND EQUIPMENT; SPECIAL INDUSTRY MACHINERY; INDUSTRIAL AND COMMERCIAL MACHINERY AND EQUIPMENT Business NAICS classification: PRINTING MACHINERY AND EQUIPMENT MANUFACTURING.; ALL OTHER INDUSTRIAL MACHINERY MANUFACTURING. Organizations: VICO MFG INC, CHARLES BURBOL (CONTACT/OWNER)
, MKM MACHINE TOOL CO INC (CONTACT/OWNER)
Alternative names: VICO MFG INC
AMERICAN ALDES VENTILATION CORPORATION (4537 NORTHGATE COURT in SARASOTA, FL)
STATE MASTER (FDM) - WAFR-FLRNEE182, NPDES STORMWATER PROGRAM, NPDES STORMWATER PERMIT National Pollutant Discharge Elimination System NON-MAJOR (Tracking pollutant discharge elimination systems) - permit Business SIC classification: ELECTRIC HOUSEWARES AND FANS
RECYCLE AMERICA SARASOTA (3100 N WASHINGTON BLVD in SARASOTA, FL)
(Integrated Compliance Information System) - ICIS-04-2000-0250, FORMAL ENFORCEMENT ACTION National Pollutant Discharge Elimination System NON-MAJOR (Tracking pollutant discharge elimination systems) - permit Business SIC classification: SCRAP AND WASTE MATERIALS Organizations: JOHN SCHWEIGART (CONTACT/OWNER)
PREDATOR CUSTOM YACHTS (2060 51ST ST in SARASOTA, FL)
AIR MINOR (AIRS/AFS) National Pollutant Discharge Elimination System NON-MAJOR (Tracking pollutant discharge elimination systems) - permit Small Quantity Generators, between 100 kg and 1000 kg of hazardous waste/month (Resource Conservation and Recovery Act (tracking hazardous waste)) - notification Business SIC classification: BOAT BUILDING AND REPAIRING Business NAICS classification: BOAT BUILDING. Organizations: EVERETT SUTTON (CONTACT/OWNER)
, SCOTT GERBER (CONTACT/OWNER)
RICHARD MILBURN ACADEMY OF FLORIDA, INC. (2207 INDUSTRIAL BLVD. in SARASOTA, FL)
(National Center for Education Statistics) - STATE ID-0089 Organizations: SARASOTA COUNTY SCHOOL DISTRICT (SCHOOL DISTRICT)
ROY MCBEAN CHARTER SCHOOL (INACTIV (1790 21ST STREET in SARASOTA, FL)
(National Center for Education Statistics) - STATE ID-0086 Organizations: SARASOTA COUNTY SCHOOL DISTRICT (SCHOOL DISTRICT)
MANASOTA OPTICS, INC. (1743 NORTHGATE BLVD in SARASOTA, FL)
National Pollutant Discharge Elimination System NON-MAJOR (Tracking pollutant discharge elimination systems) - permit (Resource Conservation and Recovery Act (tracking hazardous waste)) Business SIC classification: OPTICAL INSTRUMENTS AND LENSES Organizations: DAVID LOWERY (CONTACT/OWNER)
PAC TEC CORPORATION (4820 MIDDLE AVE. in SARASOTA, FL)
AIR SYNTHETIC MINOR (AIRS/AFS) CRITERIA AND HAZARDOUS AIR POLLUTANT INVENTORY (Inventory of air pollution sources) TRANSPORTER (Resource Conservation and Recovery Act (tracking hazardous waste)) - notification TRI REPORTER (Tracking of toxic chemicals releasing facilities) Business SIC classification: PLASTICS PRODUCTS Business NAICS classification: ALL OTHER MISCELLANEOUS ELECTRICAL EQUIPMENT AND COMPONENT MANUFACTURING. Organizations: CHRIS FLAHERTY, PLT MGR (CONTACT/OWNER)
Alternative names: LA FRANCE CORPORATION, PAC TEC MFG
AIRPORT AUTO REPAIR (2308 INDUSTRIAL BLVD in SARASOTA, FL)
(Resource Conservation and Recovery Act (tracking hazardous waste)) Organizations: JERRY OVERHOLT, OWNER (CONTACT/OWNER)
301 INDUSTRIAL PARK (53RD ST in SARASOTA, FL)
National Pollutant Discharge Elimination System NON-MAJOR (Tracking pollutant discharge elimination systems) - permit Organizations: LUIS HASBROUCK (CONTACT/OWNER)
APAC FLORIDA INC (1451 MYRTLE ST in SARASOTA, FL)
(Resource Conservation and Recovery Act (tracking hazardous waste)) Business NAICS classification: CONSTRUCTION SAND AND GRAVEL MINING.; ASPHALT PAVING MIXTURE AND BLOCK MANUFACTURING. Organizations: JAMES STEPHENS, SAFETY (CONTACT/OWNER)
GOOD DEAL AUTO BODY (2720 N WASHINGTON BLVD in SARASOTA, FL)
(Resource Conservation and Recovery Act (tracking hazardous waste)) Business NAICS classification: AUTOMOTIVE BODY, PAINT, AND INTERIOR REPAIR AND MAINTENANCE. Organizations: GOOD DEAL AUTOBODY (CONTACT/OWNER)
MADER ELECTRIC INC (2400 N. WASHINGTON BLVD. in SARASOTA, FL)
(Resource Conservation and Recovery Act (tracking hazardous waste)) Organizations: RUSS WRIGHT, GENERAL MANAGER (CONTACT/OWNER)
Housing units lacking complete plumbing facilities: 0.6% Housing units lacking complete kitchen facilities: 0.7%
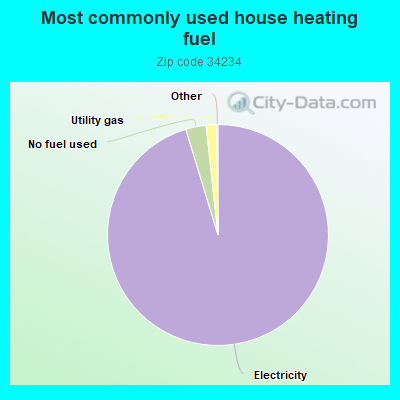
95.2%Electricity
3.0%No fuel used
1.5%Utility gas
Population in 1990: 20,243. Population change in the 1990s: +268 (+1.3%).
Place of birth for U.S.-born residents:
This state: 8,842
Northeast: 3,301
Midwest: 2,615
South: 2,469
West: 924
50% of the 34234 zip code residents lived in the same house 5 years ago. Out of people who lived in different houses, 52% lived in this county. Out of people who lived in different counties, 50% lived in Florida.
89% of the 34234 zip code residents lived in the same house 1 year ago. Out of people who lived in different houses, 37% moved from this county. Out of people who lived in different houses, 29% moved from different county within same state. Out of people who lived in different houses, 29% moved from different state. Out of people who lived in different houses, 7% moved from abroad.
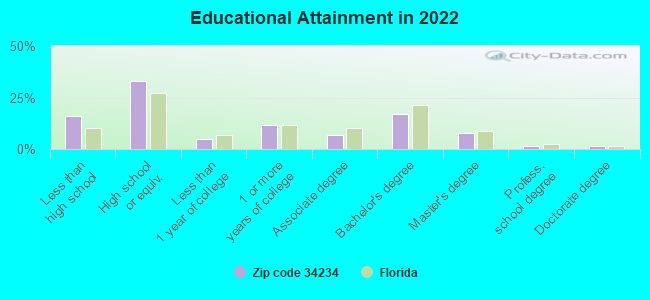
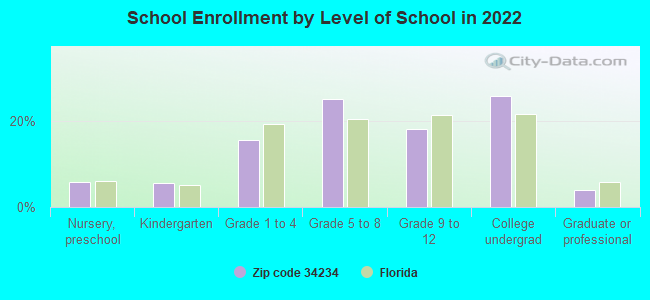
Private vs. public school enrollment:
Students in private schools in grades 1 to 8 (elementary and middle school): 33
Here:
1.8%
Florida:
15.8%
Students in private schools in grades 9 to 12 (high school): 37
Here:
4.4%
Florida:
12.9%
Students in private undergraduate colleges: 652
Here:
52.0%
Florida:
23.6%
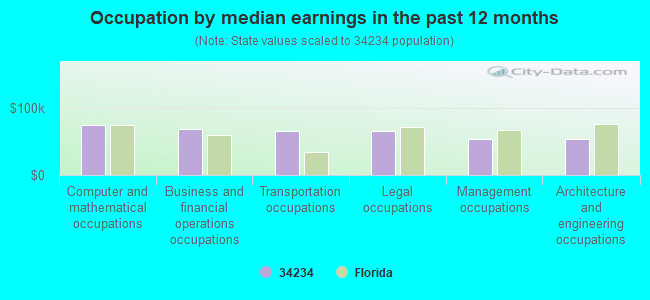
Occupation by median earnings in the past 12 months ($)
74,957Computer and mathematical occupations
68,940Business and financial operations occupations
65,723Transportation occupations
65,343Legal occupations
54,361Management occupations
53,216Architecture and engineering occupations
Companies with federal contracts located in this zip code (SARASOTA, FL):
FOSS-BROWN INC (936 42ND ST; small business) : $2,771,651 in 244 contractsfrom 2003 to 2006
Contracts for Truck and Tractor Attachments, Hardware, Commercial, Fastening Device, Blocks, Tackle, Rigging, and Slings, and moreby Defense Logistics Agency Signed by year:2000: $0; 2001: $0; 2002: $0; 2003: $31,520; 2004: $685,059; 2005: $1,619,332; 2006: $435,740.
Biggest contracts:
$91,900 with Defense Logistics Agency for Truck and Tractor Attachments. Signed on 2005-10-27. Completion date: 2006-02-19.
$77,898 with Defense Logistics Agency for Hardware, Commercial. Taking place in NJ. Signed on 2004-05-26. Completion date: 2005-08-26.
$76,800 with Defense Logistics Agency for Fastening Device. Signed on 2004-08-06. Completion date: 2005-02-02.
$74,944 with Defense Logistics Agency for Blocks, Tackle, Rigging, and Slings. Signed on 2004-06-30. Completion date: 2004-12-13.
SPT & ENGINEERING CO INC (1920 NORTHGATE BLVD UNIT; small business) : $322,241 in 2 contractsfrom 2003 to 2004
$287,786 with Air Force for Maintenance, Repair and Rebuilding of Equipment -- Ground Effect Vehicles, Motor Vehicles, Trailers, and Cycles. Signed on 2003-09-29. Completion date: 2004-06-01.
$34,455 with Air Force for Maintenance, Repair and Rebuilding of Equipment -- Ground Effect Vehicles, Motor Vehicles, Trailers, and Cycles. Taking place in NM. Signed on 2004-09-08. Completion date: 2004-05-03.
MAXIMUM THUNDER INC (6451 C 19TH STREET EAST; small business)
$279,500 with Navy for Small Craft. Signed on 2003-12-23. Completion date: 2004-09-01.
MANASOTA OPTICS, INC (1743 NORTHGATE BLVD; small business) : $84,594 in 4 contractsfrom 2000 to 2006
$43,344 with Defense Logistics Agency for Stimulated Coherent Radiation Devices, Components and Accessories. Signed on 2002-05-30. Completion date: 2002-08-28.
$25,420, same as above.Signed on 2000-05-31. Completion date: 2000-08-29.
$8,330, same as above.Signed on 2005-10-31. Completion date: 2006-01-29.
$7,500, same as above.Signed on 2006-03-21. Completion date: 2006-07-19.
PRIME HOSPITALITY LLC (1803 N TAMIAMI TRL) : $26,314 in 2 contractsin 2005
$25,134 with Army for Lodging - Hotel/Motel. Signed on 2005-05-16. Completion date: 2005-05-28.
$1,180, same as above.Signed on 2005-05-19. Completion date: 2005-05-28.
CUSTOM CARTS INC (2007 51ST ST; small business)
$6,353 with Navy for Miscellaneous Vehicular Components. Signed on 2004-05-05. Completion date: 2004-09-30.
BARRY'S ENTERPRISES INC (1801 N WASHINGTON BLVD; small business)
$5,995 with Navy for Miscellaneous Items. Signed on 2004-02-25. Completion date: 2004-03-26.
I N C, INC (567 45TH STREET; small business)
$4,348 with Army for Outerwear, Men's. Taking place in AZ. Signed on 2002-09-30. Completion date: 2002-10-21.
NATIONAL SIGN & DECAL INC (4805 RILMA AVE #109; small business) : $0 in 2 contractsin 2003
$4,800 with Air Force for Signs, Advertising Displays, and Identification Plates. Signed on 2003-01-27. Completion date: 2003-02-18.
-$4,800, same as above.Signed on 2003-02-28. Completion date: 2003-02-28.
Top industries in this zip code by the number of employees in 2005:
Administrative and Support and Waste Management and Remediation Services: Temporary Help Services (100-249 employees: 2 establishments, 50-99 employees: 1 establishment)
Educational Services: Colleges, Universities, and Professional Schools (250-499: 1, 10-19: 1)
Accommodation and Food Services: Hotels (except Casino Hotels) and Motels (20-49: 6, 10-19: 1, 1-4: 6)
Health Care and Social Assistance: Child Day Care Services (100-249: 1, 5-9: 2, 1-4: 1)
Professional, Scientific, and Technical Services: Administrative Management and General Management Consulting Services (100-249: 1, 1-4: 3)
Administrative and Support and Waste Management and Remediation Services: Collection Agencies (100-249: 1)
Health Care and Social Assistance: Nursing Care Facilities (100-249: 1)
Wholesale Trade: Beer and Ale Merchant Wholesalers (100-249: 1)
People in group quarters in 2010:
743 people in college/university student housing
172 people in nursing facilities/skilled-nursing facilities
145 people in residential treatment centers for adults
61 people in other noninstitutional facilities
19 people in residential treatment centers for juveniles (non-correctional)
People in group quarters in 2000:
674 people in college dormitories (includes college quarters off campus)
479 people in nursing homes
53 people in hospitals or wards for drug/alcohol abuse
39 people in homes for the mentally ill
37 people in homes or halfway houses for drug/alcohol abuse
35 people in other group homes
9 people in other nonhousehold living situations
Fatal accident statistics in 2014:
Fatal accident count: 2
Vehicles involved in fatal accidents: 2
Fatal accidents caused by drunken drivers: 0
Fatalities: 2
Persons involved in fatal accidents: 3
Pedestrians involved in fatal accidents: 2
Fatal accident statistics in 2013:
Fatal accident count: 3
Vehicles involved in fatal accidents: 4
Fatal accidents caused by drunken drivers: 2
Fatalities: 3
Persons involved in fatal accidents: 7
Pedestrians involved in fatal accidents: 2
Home Mortgage Disclosure Act Aggregated Statistics For Year 2009 (Based on 5 full and 4 partial tracts)
A) FHA, FSA/RHS & VA Home Purchase Loans
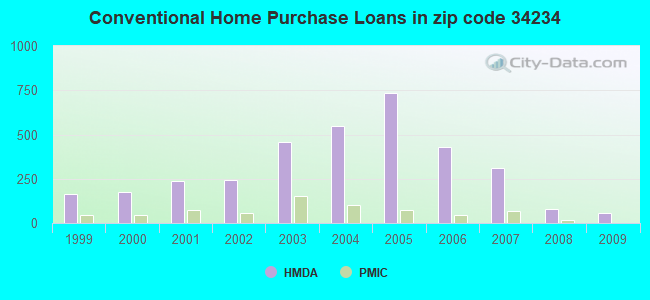
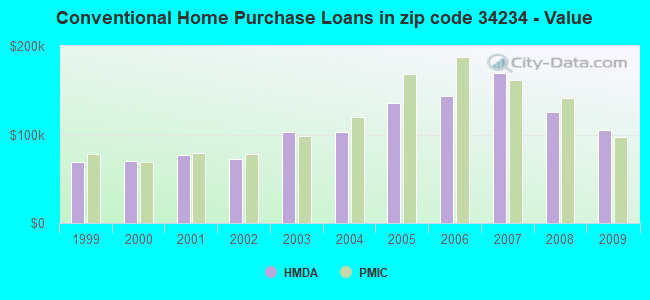
B) Conventional Home Purchase Loans
C) Refinancings
D) Home Improvement Loans
E) Loans on Dwellings For 5+ Families
F) Non-occupant Loans on < 5 Family Dwellings (A B C & D)
G) Loans On Manufactured Home Dwelling (A B C & D)
Number
Average Value
Number
Average Value
Number
Average Value
Number
Average Value
Number
Average Value
Number
Average Value
Number
Average Value
LOANS ORIGINATED
44
$89,273
55
$104,937
58
$143,220
1
$14,380
0
$0
30
$93,702
6
$57,012
APPLICATIONS APPROVED, NOT ACCEPTED
4
$107,312
9
$82,501
18
$114,732
1
$3,880
0
$0
8
$135,522
4
$66,812
APPLICATIONS DENIED
13
$91,806
25
$172,427
102
$129,977
11
$38,856
1
$2,400,000
28
$104,408
16
$67,721
APPLICATIONS WITHDRAWN
5
$75,228
13
$158,213
47
$150,115
0
$0
0
$0
18
$123,506
1
$84,870
FILES CLOSED FOR INCOMPLETENESS
1
$51,000
1
$113,000
14
$128,628
1
$14,380
0
$0
2
$84,760
0
$0
Aggregated Statistics For Year 2008 (Based on 5 full and 4 partial tracts)
A) FHA, FSA/RHS & VA Home Purchase Loans
B) Conventional Home Purchase Loans
C) Refinancings
D) Home Improvement Loans
E) Loans on Dwellings For 5+ Families
F) Non-occupant Loans on < 5 Family Dwellings (A B C & D)
G) Loans On Manufactured Home Dwelling (A B C & D)
Number
Average Value
Number
Average Value
Number
Average Value
Number
Average Value
Number
Average Value
Number
Average Value
Number
Average Value
LOANS ORIGINATED
44
$129,373
79
$125,495
119
$171,233
29
$52,422
0
$0
51
$122,630
0
$0
APPLICATIONS APPROVED, NOT ACCEPTED
6
$91,283
18
$91,468
38
$169,322
4
$83,265
0
$0
2
$221,215
11
$85,929
APPLICATIONS DENIED
21
$135,260
38
$165,841
248
$157,195
86
$81,794
1
$104,790
51
$143,561
24
$80,730
APPLICATIONS WITHDRAWN
4
$134,122
17
$203,945
75
$160,303
6
$98,485
0
$0
21
$121,376
0
$0
FILES CLOSED FOR INCOMPLETENESS
0
$0
7
$163,726
35
$170,370
2
$171,520
2
$1,690,650
12
$174,882
0
$0
Aggregated Statistics For Year 2007 (Based on 5 full and 4 partial tracts)
A) FHA, FSA/RHS & VA Home Purchase Loans
B) Conventional Home Purchase Loans
C) Refinancings
D) Home Improvement Loans
E) Loans on Dwellings For 5+ Families
F) Non-occupant Loans on < 5 Family Dwellings (A B C & D)
G) Loans On Manufactured Home Dwelling (A B C & D)
Number
Average Value
Number
Average Value
Number
Average Value
Number
Average Value
Number
Average Value
Number
Average Value
Number
Average Value
LOANS ORIGINATED
19
$161,211
310
$169,510
468
$176,740
77
$70,885
4
$665,920
180
$176,919
23
$52,384
APPLICATIONS APPROVED, NOT ACCEPTED
0
$0
57
$185,573
141
$160,368
21
$57,896
0
$0
43
$170,972
9
$50,838
APPLICATIONS DENIED
12
$142,272
79
$232,855
607
$173,586
174
$104,333
0
$0
77
$235,372
31
$72,091
APPLICATIONS WITHDRAWN
0
$0
37
$175,032
241
$166,803
27
$111,991
0
$0
34
$180,104
8
$35,892
FILES CLOSED FOR INCOMPLETENESS
0
$0
25
$171,587
104
$172,339
7
$149,506
0
$0
16
$166,878
2
$43,875
Aggregated Statistics For Year 2006 (Based on 5 full and 4 partial tracts)
A) FHA, FSA/RHS & VA Home Purchase Loans
B) Conventional Home Purchase Loans
C) Refinancings
D) Home Improvement Loans
E) Loans on Dwellings For 5+ Families
F) Non-occupant Loans on < 5 Family Dwellings (A B C & D)
G) Loans On Manufactured Home Dwelling (A B C & D)
Number
Average Value
Number
Average Value
Number
Average Value
Number
Average Value
Number
Average Value
Number
Average Value
Number
Average Value
LOANS ORIGINATED
8
$145,930
429
$143,329
834
$157,085
95
$100,017
4
$1,522,860
222
$162,498
25
$59,956
APPLICATIONS APPROVED, NOT ACCEPTED
3
$149,593
74
$155,134
158
$136,146
23
$142,553
0
$0
42
$176,963
19
$84,629
APPLICATIONS DENIED
1
$86,000
248
$178,920
482
$282,787
144
$83,938
2
$453,625
70
$145,218
36
$47,708
APPLICATIONS WITHDRAWN
0
$0
60
$235,859
359
$144,722
22
$100,082
0
$0
35
$176,813
4
$61,132
FILES CLOSED FOR INCOMPLETENESS
0
$0
29
$142,732
156
$162,979
3
$100,423
0
$0
14
$175,565
0
$0
Aggregated Statistics For Year 2005 (Based on 5 full and 4 partial tracts)
A) FHA, FSA/RHS & VA Home Purchase Loans
B) Conventional Home Purchase Loans
C) Refinancings
D) Home Improvement Loans
E) Loans on Dwellings For 5+ Families
F) Non-occupant Loans on < 5 Family Dwellings (A B C & D)
G) Loans On Manufactured Home Dwelling (A B C & D)
Number
Average Value
Number
Average Value
Number
Average Value
Number
Average Value
Number
Average Value
Number
Average Value
Number
Average Value
LOANS ORIGINATED
7
$149,674
735
$135,229
759
$131,497
87
$102,909
2
$196,060
317
$143,235
23
$209,048
APPLICATIONS APPROVED, NOT ACCEPTED
3
$151,160
116
$157,577
139
$117,128
11
$61,688
0
$0
37
$137,250
20
$84,756
APPLICATIONS DENIED
1
$152,470
268
$129,203
531
$112,454
123
$78,880
0
$0
93
$119,938
36
$56,087
APPLICATIONS WITHDRAWN
1
$192,750
76
$152,408
374
$119,971
69
$138,147
1
$14,384,000
40
$118,128
5
$34,348
FILES CLOSED FOR INCOMPLETENESS
0
$0
33
$137,718
221
$132,663
4
$80,218
0
$0
14
$117,298
6
$70,002
Aggregated Statistics For Year 2004 (Based on 5 full and 4 partial tracts)
A) FHA, FSA/RHS & VA Home Purchase Loans
B) Conventional Home Purchase Loans
C) Refinancings
D) Home Improvement Loans
E) Loans on Dwellings For 5+ Families
F) Non-occupant Loans on < 5 Family Dwellings (A B C & D)
G) Loans On Manufactured Home Dwelling (A B C & D)
Number
Average Value
Number
Average Value
Number
Average Value
Number
Average Value
Number
Average Value
Number
Average Value
Number
Average Value
LOANS ORIGINATED
43
$135,010
547
$103,097
603
$105,344
44
$86,973
3
$929,667
217
$102,807
44
$48,142
APPLICATIONS APPROVED, NOT ACCEPTED
2
$156,560
66
$115,715
146
$96,539
20
$50,496
0
$0
38
$108,154
12
$42,794
APPLICATIONS DENIED
10
$133,065
150
$108,648
483
$95,356
94
$55,222
0
$0
50
$120,038
45
$45,918
APPLICATIONS WITHDRAWN
6
$112,528
82
$111,752
288
$97,056
17
$66,783
0
$0
44
$117,925
0
$0
FILES CLOSED FOR INCOMPLETENESS
4
$136,118
11
$172,607
173
$114,724
6
$38,062
0
$0
3
$115,743
0
$0
Aggregated Statistics For Year 2003 (Based on 5 full and 4 partial tracts)
A) FHA, FSA/RHS & VA Home Purchase Loans
B) Conventional Home Purchase Loans
C) Refinancings
D) Home Improvement Loans
E) Loans on Dwellings For 5+ Families
F) Non-occupant Loans on < 5 Family Dwellings (A B C & D)
Number
Average Value
Number
Average Value
Number
Average Value
Number
Average Value
Number
Average Value
Number
Average Value
LOANS ORIGINATED
53
$116,030
458
$102,304
975
$91,929
23
$17,123
8
$640,621
336
$82,884
APPLICATIONS APPROVED, NOT ACCEPTED
2
$103,570
76
$104,143
160
$89,257
10
$26,411
0
$0
44
$88,416
APPLICATIONS DENIED
10
$105,451
128
$89,450
588
$87,368
60
$29,655
0
$0
82
$82,873
APPLICATIONS WITHDRAWN
2
$102,710
67
$129,374
219
$96,801
8
$41,806
2
$272,060
40
$104,218
FILES CLOSED FOR INCOMPLETENESS
3
$90,653
26
$104,570
47
$93,138
4
$39,820
0
$0
6
$74,597
Aggregated Statistics For Year 2002 (Based on 3 full and 2 partial tracts)
A) FHA, FSA/RHS & VA Home Purchase Loans
B) Conventional Home Purchase Loans
C) Refinancings
D) Home Improvement Loans
E) Loans on Dwellings For 5+ Families
F) Non-occupant Loans on < 5 Family Dwellings (A B C & D)
Number
Average Value
Number
Average Value
Number
Average Value
Number
Average Value
Number
Average Value
Number
Average Value
LOANS ORIGINATED
16
$76,228
244
$72,270
264
$83,197
10
$18,362
5
$3,582,292
152
$72,952
APPLICATIONS APPROVED, NOT ACCEPTED
2
$50,455
29
$87,337
51
$73,271
9
$41,920
0
$0
15
$88,819
APPLICATIONS DENIED
2
$81,935
36
$64,886
148
$67,902
42
$10,756
0
$0
40
$48,786
APPLICATIONS WITHDRAWN
5
$79,766
20
$64,883
70
$108,651
10
$23,846
0
$0
15
$64,845
FILES CLOSED FOR INCOMPLETENESS
0
$0
7
$124,557
31
$63,979
2
$14,920
0
$0
6
$72,382
Aggregated Statistics For Year 2001 (Based on 3 full and 2 partial tracts)
A) FHA, FSA/RHS & VA Home Purchase Loans
B) Conventional Home Purchase Loans
C) Refinancings
D) Home Improvement Loans
E) Loans on Dwellings For 5+ Families
F) Non-occupant Loans on < 5 Family Dwellings (A B C & D)
Number
Average Value
Number
Average Value
Number
Average Value
Number
Average Value
Number
Average Value
Number
Average Value
LOANS ORIGINATED
30
$77,150
237
$76,485
189
$68,540
14
$13,014
5
$305,982
135
$73,419
APPLICATIONS APPROVED, NOT ACCEPTED
4
$76,352
24
$74,582
42
$66,525
8
$14,824
0
$0
16
$61,164
APPLICATIONS DENIED
3
$61,780
37
$56,832
203
$56,670
48
$19,199
0
$0
27
$47,681
APPLICATIONS WITHDRAWN
5
$77,056
22
$68,439
100
$62,491
5
$28,858
0
$0
16
$58,246
FILES CLOSED FOR INCOMPLETENESS
3
$87,920
6
$69,122
27
$70,605
2
$59,670
0
$0
6
$59,007
Aggregated Statistics For Year 2000 (Based on 3 full and 2 partial tracts)
A) FHA, FSA/RHS & VA Home Purchase Loans
B) Conventional Home Purchase Loans
C) Refinancings
D) Home Improvement Loans
E) Loans on Dwellings For 5+ Families
F) Non-occupant Loans on < 5 Family Dwellings (A B C & D)
Number
Average Value
Number
Average Value
Number
Average Value
Number
Average Value
Number
Average Value
Number
Average Value
LOANS ORIGINATED
25
$66,006
174
$69,741
106
$60,199
20
$16,554
3
$112,013
52
$57,530
APPLICATIONS APPROVED, NOT ACCEPTED
3
$56,710
22
$90,765
38
$47,654
18
$21,292
0
$0
7
$47,983
APPLICATIONS DENIED
13
$67,324
52
$65,678
155
$49,912
53
$13,126
0
$0
17
$50,464
APPLICATIONS WITHDRAWN
0
$0
26
$71,963
89
$43,297
3
$39,663
1
$500,000
8
$55,365
FILES CLOSED FOR INCOMPLETENESS
0
$0
2
$78,010
25
$56,680
0
$0
0
$0
2
$66,480
Aggregated Statistics For Year 1999 (Based on 2 full and 2 partial tracts)
A) FHA, FSA/RHS & VA Home Purchase Loans
B) Conventional Home Purchase Loans
C) Refinancings
D) Home Improvement Loans
E) Loans on Dwellings For 5+ Families
F) Non-occupant Loans on < 5 Family Dwellings (A B C & D)
2002 - 2018 National Fire Incident Reporting System (NFIRS) incidents
According to the data from the years 2002 - 2018 the average number of fires per year is 76. The highest number of fires - 116 took place in 2003, and the least - 1 in 2004. The data has a dropping trend.
When looking into fire subcategories, the most reports belonged to: Outside Fires (50.6%), and Structure Fires (24.4%).
Fire incident types reported to NFIRS in Zip Code 34234


 Nearest zip codes: 34243, 34237, 34236, 34239, 34235, 34207.


 According to the data from the years 2002 - 2018 the average number of fires per year is 76. The highest number of fires - 116 took place in 2003, and the least - 1 in 2004. The data has a dropping trend.
 When looking into fire subcategories, the most reports belonged to: Outside Fires (50.6%), and Structure Fires (24.4%).