Estimated zip code population in 2022: 13,396
Zip code population in 2010: 12,273
Zip code population in 2000: 9,826
Houses and condos: 6,826
Renter-occupied apartments: 706
% of renters here:
12%State:
33%
March 2022 cost of living index in zip code 34432: 83.6
(less than average, U.S. average is 100)
Land area: 108.2
sq. mi.
Water area: 1.2
sq. mi.
Population density: 124 people per square mile (very low).
OSM Map
General Map
Google Map
MSN Map
OSM Map
General Map
Google Map
MSN Map
OSM Map
General Map
Google Map
MSN Map
OSM Map
General Map
Google Map
MSN Map
Please wait while loading the map...
Real estate property taxes paid for housing units in 2022:
This zip code:
0.7% ($1,670)Florida:
0.7% ($2,529)
Median real estate property taxes paid for housing units with mortgages in 2022: $1,700 (0.7%)
Median real estate property taxes paid for housing units with no mortgage in 2022: $1,629 (0.7%)
Profiles of local businesses
Business Search - 14 Million verified businesses
Males: 6,764 Females: 6,632
For population 25 years and over in 34432:
High school or higher: 89.5%Bachelor's degree or higher: 21.3%Graduate or professional degree: 8.0%Unemployed: 5.7%Mean travel time to work (commute): 30.1 minutes
For population 15 years and over in 34432:
Never married: 22.1%Now married: 55.0%Separated: 1.2%Widowed: 9.6%Divorced: 12.0%
Zip code 34432 compared to state average:
Median house value below state average. Black race population percentage significantly below state average. Hispanic race population percentage below state average. Median age significantly above state average. Foreign-born population percentage significantly below state average. Renting percentage significantly below state average. Length of stay since moving in significantly above state average. House age below state average. Number of college students below state average. 10,526 78.6% White 1,524 11.4% Hispanic or Latino 684 5.1% Two or more races 350 2.6% Black 132 1.0% Asian 103 0.8% American Indian 51 0.4% Some other race 21 0.2% Native Hawaiian and Other
Data:
Median household income ($)
Median household income (% change since 2000)
Household income diversity
Ratio of average income to average house value (%)
Ratio of average income to average rent
Median household income ($) - White
Median household income ($) - Black or African American
Median household income ($) - Asian
Median household income ($) - Hispanic or Latino
Median household income ($) - American Indian and Alaska Native
Median household income ($) - Multirace
Median household income ($) - Other Race
Median household income for houses/condos with a mortgage ($)
Median household income for apartments without a mortgage ($)
Races - White alone (%)
Races - White alone (% change since 2000)
Races - Black alone (%)
Races - Black alone (% change since 2000)
Races - American Indian alone (%)
Races - American Indian alone (% change since 2000)
Races - Asian alone (%)
Races - Asian alone (% change since 2000)
Races - Hispanic (%)
Races - Hispanic (% change since 2000)
Races - Native Hawaiian and Other Pacific Islander alone (%)
Races - Native Hawaiian and Other Pacific Islander alone (% change since 2000)
Races - Two or more races (%)
Races - Two or more races (% change since 2000)
Races - Other race alone (%)
Races - Other race alone (% change since 2000)
Racial diversity
Unemployment (%)
Unemployment (% change since 2000)
Unemployment (%) - White
Unemployment (%) - Black or African American
Unemployment (%) - Asian
Unemployment (%) - Hispanic or Latino
Unemployment (%) - American Indian and Alaska Native
Unemployment (%) - Multirace
Unemployment (%) - Other Race
Population density (people per square mile)
Population - Males (%)
Population - Females (%)
Population - Males (%) - White
Population - Males (%) - Black or African American
Population - Males (%) - Asian
Population - Males (%) - Hispanic or Latino
Population - Males (%) - American Indian and Alaska Native
Population - Males (%) - Multirace
Population - Males (%) - Other Race
Population - Females (%) - White
Population - Females (%) - Black or African American
Population - Females (%) - Asian
Population - Females (%) - Hispanic or Latino
Population - Females (%) - American Indian and Alaska Native
Population - Females (%) - Multirace
Population - Females (%) - Other Race
Coronavirus confirmed cases (Apr 26, 2024)
Deaths caused by coronavirus (Apr 26, 2024)
Coronavirus confirmed cases (per 100k population) (Apr 26, 2024)
Deaths caused by coronavirus (per 100k population) (Apr 26, 2024)
Daily increase in number of cases (Apr 26, 2024)
Weekly increase in number of cases (Apr 26, 2024)
Cases doubled (in days) (Apr 26, 2024)
Hospitalized patients (Apr 18, 2022)
Negative test results (Apr 18, 2022)
Total test results (Apr 18, 2022)
COVID Vaccine doses distributed (per 100k population) (Sep 19, 2023)
COVID Vaccine doses administered (per 100k population) (Sep 19, 2023)
COVID Vaccine doses distributed (Sep 19, 2023)
COVID Vaccine doses administered (Sep 19, 2023)
Likely homosexual households (%)
Likely homosexual households (% change since 2000)
Likely homosexual households - Lesbian couples (%)
Likely homosexual households - Lesbian couples (% change since 2000)
Likely homosexual households - Gay men (%)
Likely homosexual households - Gay men (% change since 2000)
Cost of living index
Median gross rent ($)
Median contract rent ($)
Median monthly housing costs ($)
Median house or condo value ($)
Median house or condo value ($ change since 2000)
Mean house or condo value by units in structure - 1, detached ($)
Mean house or condo value by units in structure - 1, attached ($)
Mean house or condo value by units in structure - 2 ($)
Mean house or condo value by units in structure by units in structure - 3 or 4 ($)
Mean house or condo value by units in structure - 5 or more ($)
Mean house or condo value by units in structure - Boat, RV, van, etc. ($)
Mean house or condo value by units in structure - Mobile home ($)
Median house or condo value ($) - White
Median house or condo value ($) - Black or African American
Median house or condo value ($) - Asian
Median house or condo value ($) - Hispanic or Latino
Median house or condo value ($) - American Indian and Alaska Native
Median house or condo value ($) - Multirace
Median house or condo value ($) - Other Race
Median resident age
Resident age diversity
Median resident age - Males
Median resident age - Females
Median resident age - White
Median resident age - Black or African American
Median resident age - Asian
Median resident age - Hispanic or Latino
Median resident age - American Indian and Alaska Native
Median resident age - Multirace
Median resident age - Other Race
Median resident age - Males - White
Median resident age - Males - Black or African American
Median resident age - Males - Asian
Median resident age - Males - Hispanic or Latino
Median resident age - Males - American Indian and Alaska Native
Median resident age - Males - Multirace
Median resident age - Males - Other Race
Median resident age - Females - White
Median resident age - Females - Black or African American
Median resident age - Females - Asian
Median resident age - Females - Hispanic or Latino
Median resident age - Females - American Indian and Alaska Native
Median resident age - Females - Multirace
Median resident age - Females - Other Race
Commute - mean travel time to work (minutes)
Travel time to work - Less than 5 minutes (%)
Travel time to work - Less than 5 minutes (% change since 2000)
Travel time to work - 5 to 9 minutes (%)
Travel time to work - 5 to 9 minutes (% change since 2000)
Travel time to work - 10 to 19 minutes (%)
Travel time to work - 10 to 19 minutes (% change since 2000)
Travel time to work - 20 to 29 minutes (%)
Travel time to work - 20 to 29 minutes (% change since 2000)
Travel time to work - 30 to 39 minutes (%)
Travel time to work - 30 to 39 minutes (% change since 2000)
Travel time to work - 40 to 59 minutes (%)
Travel time to work - 40 to 59 minutes (% change since 2000)
Travel time to work - 60 to 89 minutes (%)
Travel time to work - 60 to 89 minutes (% change since 2000)
Travel time to work - 90 or more minutes (%)
Travel time to work - 90 or more minutes (% change since 2000)
Marital status - Never married (%)
Marital status - Now married (%)
Marital status - Separated (%)
Marital status - Widowed (%)
Marital status - Divorced (%)
Median family income ($)
Median family income (% change since 2000)
Median non-family income ($)
Median non-family income (% change since 2000)
Median per capita income ($)
Median per capita income (% change since 2000)
Median family income ($) - White
Median family income ($) - Black or African American
Median family income ($) - Asian
Median family income ($) - Hispanic or Latino
Median family income ($) - American Indian and Alaska Native
Median family income ($) - Multirace
Median family income ($) - Other Race
Median year house/condo built
Median year apartment built
Year house built - Built 2005 or later (%)
Year house built - Built 2000 to 2004 (%)
Year house built - Built 1990 to 1999 (%)
Year house built - Built 1980 to 1989 (%)
Year house built - Built 1970 to 1979 (%)
Year house built - Built 1960 to 1969 (%)
Year house built - Built 1950 to 1959 (%)
Year house built - Built 1940 to 1949 (%)
Year house built - Built 1939 or earlier (%)
Average household size
Household density (households per square mile)
Average household size - White
Average household size - Black or African American
Average household size - Asian
Average household size - Hispanic or Latino
Average household size - American Indian and Alaska Native
Average household size - Multirace
Average household size - Other Race
Occupied housing units (%)
Vacant housing units (%)
Owner occupied housing units (%)
Renter occupied housing units (%)
Vacancy status - For rent (%)
Vacancy status - For sale only (%)
Vacancy status - Rented or sold, not occupied (%)
Vacancy status - For seasonal, recreational, or occasional use (%)
Vacancy status - For migrant workers (%)
Vacancy status - Other vacant (%)
Residents with income below the poverty level (%)
Residents with income below 50% of the poverty level (%)
Children below poverty level (%)
Poor families by family type - Married-couple family (%)
Poor families by family type - Male, no wife present (%)
Poor families by family type - Female, no husband present (%)
Poverty status for native-born residents (%)
Poverty status for foreign-born residents (%)
Poverty among high school graduates not in families (%)
Poverty among people who did not graduate high school not in families (%)
Residents with income below the poverty level (%) - White
Residents with income below the poverty level (%) - Black or African American
Residents with income below the poverty level (%) - Asian
Residents with income below the poverty level (%) - Hispanic or Latino
Residents with income below the poverty level (%) - American Indian and Alaska Native
Residents with income below the poverty level (%) - Multirace
Residents with income below the poverty level (%) - Other Race
Air pollution - Air Quality Index (AQI)
Air pollution - CO
Air pollution - NO2
Air pollution - SO2
Air pollution - Ozone
Air pollution - PM10
Air pollution - PM25
Air pollution - Pb
Crime - Murders per 100,000 population
Crime - Rapes per 100,000 population
Crime - Robberies per 100,000 population
Crime - Assaults per 100,000 population
Crime - Burglaries per 100,000 population
Crime - Thefts per 100,000 population
Crime - Auto thefts per 100,000 population
Crime - Arson per 100,000 population
Crime - City-data.com crime index
Crime - Violent crime index
Crime - Property crime index
Crime - Murders per 100,000 population (5 year average)
Crime - Rapes per 100,000 population (5 year average)
Crime - Robberies per 100,000 population (5 year average)
Crime - Assaults per 100,000 population (5 year average)
Crime - Burglaries per 100,000 population (5 year average)
Crime - Thefts per 100,000 population (5 year average)
Crime - Auto thefts per 100,000 population (5 year average)
Crime - Arson per 100,000 population (5 year average)
Crime - City-data.com crime index (5 year average)
Crime - Violent crime index (5 year average)
Crime - Property crime index (5 year average)
1996 Presidential Elections Results (%) - Democratic Party (Clinton)
1996 Presidential Elections Results (%) - Republican Party (Dole)
1996 Presidential Elections Results (%) - Other
2000 Presidential Elections Results (%) - Democratic Party (Gore)
2000 Presidential Elections Results (%) - Republican Party (Bush)
2000 Presidential Elections Results (%) - Other
2004 Presidential Elections Results (%) - Democratic Party (Kerry)
2004 Presidential Elections Results (%) - Republican Party (Bush)
2004 Presidential Elections Results (%) - Other
2008 Presidential Elections Results (%) - Democratic Party (Obama)
2008 Presidential Elections Results (%) - Republican Party (McCain)
2008 Presidential Elections Results (%) - Other
2012 Presidential Elections Results (%) - Democratic Party (Obama)
2012 Presidential Elections Results (%) - Republican Party (Romney)
2012 Presidential Elections Results (%) - Other
2016 Presidential Elections Results (%) - Democratic Party (Clinton)
2016 Presidential Elections Results (%) - Republican Party (Trump)
2016 Presidential Elections Results (%) - Other
2020 Presidential Elections Results (%) - Democratic Party (Biden)
2020 Presidential Elections Results (%) - Republican Party (Trump)
2020 Presidential Elections Results (%) - Other
Ancestries Reported - Arab (%)
Ancestries Reported - Czech (%)
Ancestries Reported - Danish (%)
Ancestries Reported - Dutch (%)
Ancestries Reported - English (%)
Ancestries Reported - French (%)
Ancestries Reported - French Canadian (%)
Ancestries Reported - German (%)
Ancestries Reported - Greek (%)
Ancestries Reported - Hungarian (%)
Ancestries Reported - Irish (%)
Ancestries Reported - Italian (%)
Ancestries Reported - Lithuanian (%)
Ancestries Reported - Norwegian (%)
Ancestries Reported - Polish (%)
Ancestries Reported - Portuguese (%)
Ancestries Reported - Russian (%)
Ancestries Reported - Scotch-Irish (%)
Ancestries Reported - Scottish (%)
Ancestries Reported - Slovak (%)
Ancestries Reported - Subsaharan African (%)
Ancestries Reported - Swedish (%)
Ancestries Reported - Swiss (%)
Ancestries Reported - Ukrainian (%)
Ancestries Reported - United States (%)
Ancestries Reported - Welsh (%)
Ancestries Reported - West Indian (%)
Ancestries Reported - Other (%)
Educational Attainment - No schooling completed (%)
Educational Attainment - Less than high school (%)
Educational Attainment - High school or equivalent (%)
Educational Attainment - Less than 1 year of college (%)
Educational Attainment - 1 or more years of college (%)
Educational Attainment - Associate degree (%)
Educational Attainment - Bachelor's degree (%)
Educational Attainment - Master's degree (%)
Educational Attainment - Professional school degree (%)
Educational Attainment - Doctorate degree (%)
School Enrollment - Nursery, preschool (%)
School Enrollment - Kindergarten (%)
School Enrollment - Grade 1 to 4 (%)
School Enrollment - Grade 5 to 8 (%)
School Enrollment - Grade 9 to 12 (%)
School Enrollment - College undergrad (%)
School Enrollment - Graduate or professional (%)
School Enrollment - Not enrolled in school (%)
School enrollment - Public schools (%)
School enrollment - Private schools (%)
School enrollment - Not enrolled (%)
Median number of rooms in houses and condos
Median number of rooms in apartments
Housing units lacking complete plumbing facilities (%)
Housing units lacking complete kitchen facilities (%)
Density of houses
Urban houses (%)
Rural houses (%)
Households with people 60 years and over (%)
Households with people 65 years and over (%)
Households with people 75 years and over (%)
Households with one or more nonrelatives (%)
Households with no nonrelatives (%)
Population in households (%)
Family households (%)
Nonfamily households (%)
Population in families (%)
Family households with own children (%)
Median number of bedrooms in owner occupied houses
Mean number of bedrooms in owner occupied houses
Median number of bedrooms in renter occupied houses
Mean number of bedrooms in renter occupied houses
Median number of vehichles in owner occupied houses
Mean number of vehichles in owner occupied houses
Median number of vehichles in renter occupied houses
Mean number of vehichles in renter occupied houses
Mortgage status - with mortgage (%)
Mortgage status - with second mortgage (%)
Mortgage status - with home equity loan (%)
Mortgage status - with both second mortgage and home equity loan (%)
Mortgage status - without a mortgage (%)
Average family size
Average family size - White
Average family size - Black or African American
Average family size - Asian
Average family size - Hispanic or Latino
Average family size - American Indian and Alaska Native
Average family size - Multirace
Average family size - Other Race
Geographical mobility - Same house 1 year ago (%)
Geographical mobility - Moved within same county (%)
Geographical mobility - Moved from different county within same state (%)
Geographical mobility - Moved from different state (%)
Geographical mobility - Moved from abroad (%)
Place of birth - Born in state of residence (%)
Place of birth - Born in other state (%)
Place of birth - Native, outside of US (%)
Place of birth - Foreign born (%)
Housing units in structures - 1, detached (%)
Housing units in structures - 1, attached (%)
Housing units in structures - 2 (%)
Housing units in structures - 3 or 4 (%)
Housing units in structures - 5 to 9 (%)
Housing units in structures - 10 to 19 (%)
Housing units in structures - 20 to 49 (%)
Housing units in structures - 50 or more (%)
Housing units in structures - Mobile home (%)
Housing units in structures - Boat, RV, van, etc. (%)
House/condo owner moved in on average (years ago)
Renter moved in on average (years ago)
Year householder moved into unit - Moved in 1999 to March 2000 (%)
Year householder moved into unit - Moved in 1995 to 1998 (%)
Year householder moved into unit - Moved in 1990 to 1994 (%)
Year householder moved into unit - Moved in 1980 to 1989 (%)
Year householder moved into unit - Moved in 1970 to 1979 (%)
Year householder moved into unit - Moved in 1969 or earlier (%)
Means of transportation to work - Drove car alone (%)
Means of transportation to work - Carpooled (%)
Means of transportation to work - Public transportation (%)
Means of transportation to work - Bus or trolley bus (%)
Means of transportation to work - Streetcar or trolley car (%)
Means of transportation to work - Subway or elevated (%)
Means of transportation to work - Railroad (%)
Means of transportation to work - Ferryboat (%)
Means of transportation to work - Taxicab (%)
Means of transportation to work - Motorcycle (%)
Means of transportation to work - Bicycle (%)
Means of transportation to work - Walked (%)
Means of transportation to work - Other means (%)
Working at home (%)
Industry diversity
Most Common Industries - Agriculture, forestry, fishing and hunting, and mining (%)
Most Common Industries - Agriculture, forestry, fishing and hunting (%)
Most Common Industries - Mining, quarrying, and oil and gas extraction (%)
Most Common Industries - Construction (%)
Most Common Industries - Manufacturing (%)
Most Common Industries - Wholesale trade (%)
Most Common Industries - Retail trade (%)
Most Common Industries - Transportation and warehousing, and utilities (%)
Most Common Industries - Transportation and warehousing (%)
Most Common Industries - Utilities (%)
Most Common Industries - Information (%)
Most Common Industries - Finance and insurance, and real estate and rental and leasing (%)
Most Common Industries - Finance and insurance (%)
Most Common Industries - Real estate and rental and leasing (%)
Most Common Industries - Professional, scientific, and management, and administrative and waste management services (%)
Most Common Industries - Professional, scientific, and technical services (%)
Most Common Industries - Management of companies and enterprises (%)
Most Common Industries - Administrative and support and waste management services (%)
Most Common Industries - Educational services, and health care and social assistance (%)
Most Common Industries - Educational services (%)
Most Common Industries - Health care and social assistance (%)
Most Common Industries - Arts, entertainment, and recreation, and accommodation and food services (%)
Most Common Industries - Arts, entertainment, and recreation (%)
Most Common Industries - Accommodation and food services (%)
Most Common Industries - Other services, except public administration (%)
Most Common Industries - Public administration (%)
Occupation diversity
Most Common Occupations - Management, business, science, and arts occupations (%)
Most Common Occupations - Management, business, and financial occupations (%)
Most Common Occupations - Management occupations (%)
Most Common Occupations - Business and financial operations occupations (%)
Most Common Occupations - Computer, engineering, and science occupations (%)
Most Common Occupations - Computer and mathematical occupations (%)
Most Common Occupations - Architecture and engineering occupations (%)
Most Common Occupations - Life, physical, and social science occupations (%)
Most Common Occupations - Education, legal, community service, arts, and media occupations (%)
Most Common Occupations - Community and social service occupations (%)
Most Common Occupations - Legal occupations (%)
Most Common Occupations - Education, training, and library occupations (%)
Most Common Occupations - Arts, design, entertainment, sports, and media occupations (%)
Most Common Occupations - Healthcare practitioners and technical occupations (%)
Most Common Occupations - Health diagnosing and treating practitioners and other technical occupations (%)
Most Common Occupations - Health technologists and technicians (%)
Most Common Occupations - Service occupations (%)
Most Common Occupations - Healthcare support occupations (%)
Most Common Occupations - Protective service occupations (%)
Most Common Occupations - Fire fighting and prevention, and other protective service workers including supervisors (%)
Most Common Occupations - Law enforcement workers including supervisors (%)
Most Common Occupations - Food preparation and serving related occupations (%)
Most Common Occupations - Building and grounds cleaning and maintenance occupations (%)
Most Common Occupations - Personal care and service occupations (%)
Most Common Occupations - Sales and office occupations (%)
Most Common Occupations - Sales and related occupations (%)
Most Common Occupations - Office and administrative support occupations (%)
Most Common Occupations - Natural resources, construction, and maintenance occupations (%)
Most Common Occupations - Farming, fishing, and forestry occupations (%)
Most Common Occupations - Construction and extraction occupations (%)
Most Common Occupations - Installation, maintenance, and repair occupations (%)
Most Common Occupations - Production, transportation, and material moving occupations (%)
Most Common Occupations - Production occupations (%)
Most Common Occupations - Transportation occupations (%)
Most Common Occupations - Material moving occupations (%)
People in Group quarters - Institutionalized population (%)
People in Group quarters - Correctional institutions (%)
People in Group quarters - Federal prisons and detention centers (%)
People in Group quarters - Halfway houses (%)
People in Group quarters - Local jails and other confinement facilities (including police lockups) (%)
People in Group quarters - Military disciplinary barracks (%)
People in Group quarters - State prisons (%)
People in Group quarters - Other types of correctional institutions (%)
People in Group quarters - Nursing homes (%)
People in Group quarters - Hospitals/wards, hospices, and schools for the handicapped (%)
People in Group quarters - Hospitals/wards and hospices for chronically ill (%)
People in Group quarters - Hospices or homes for chronically ill (%)
People in Group quarters - Military hospitals or wards for chronically ill (%)
People in Group quarters - Other hospitals or wards for chronically ill (%)
People in Group quarters - Hospitals or wards for drug/alcohol abuse (%)
People in Group quarters - Mental (Psychiatric) hospitals or wards (%)
People in Group quarters - Schools, hospitals, or wards for the mentally retarded (%)
People in Group quarters - Schools, hospitals, or wards for the physically handicapped (%)
People in Group quarters - Institutions for the deaf (%)
People in Group quarters - Institutions for the blind (%)
People in Group quarters - Orthopedic wards and institutions for the physically handicapped (%)
People in Group quarters - Wards in general hospitals for patients who have no usual home elsewhere (%)
People in Group quarters - Wards in military hospitals for patients who have no usual home elsewhere (%)
People in Group quarters - Juvenile institutions (%)
People in Group quarters - Long-term care (%)
People in Group quarters - Homes for abused, dependent, and neglected children (%)
People in Group quarters - Residential treatment centers for emotionally disturbed children (%)
People in Group quarters - Training schools for juvenile delinquents (%)
People in Group quarters - Short-term care, detention or diagnostic centers for delinquent children (%)
People in Group quarters - Type of juvenile institution unknown (%)
People in Group quarters - Noninstitutionalized population (%)
People in Group quarters - College dormitories (includes college quarters off campus) (%)
People in Group quarters - Military quarters (%)
People in Group quarters - On base (%)
People in Group quarters - Barracks, unaccompanied personnel housing (UPH), (Enlisted/Officer), ;and similar group living quarters for military personnel (%)
People in Group quarters - Transient quarters for temporary residents (%)
People in Group quarters - Military ships (%)
People in Group quarters - Group homes (%)
People in Group quarters - Homes or halfway houses for drug/alcohol abuse (%)
People in Group quarters - Homes for the mentally ill (%)
People in Group quarters - Homes for the mentally retarded (%)
People in Group quarters - Homes for the physically handicapped (%)
People in Group quarters - Other group homes (%)
People in Group quarters - Religious group quarters (%)
People in Group quarters - Dormitories (%)
People in Group quarters - Agriculture workers' dormitories on farms (%)
People in Group quarters - Job Corps and vocational training facilities (%)
People in Group quarters - Other workers' dormitories (%)
People in Group quarters - Crews of maritime vessels (%)
People in Group quarters - Other nonhousehold living situations (%)
People in Group quarters - Other noninstitutional group quarters (%)
Residents speaking English at home (%)
Residents speaking English at home - Born in the United States (%)
Residents speaking English at home - Native, born elsewhere (%)
Residents speaking English at home - Foreign born (%)
Residents speaking Spanish at home (%)
Residents speaking Spanish at home - Born in the United States (%)
Residents speaking Spanish at home - Native, born elsewhere (%)
Residents speaking Spanish at home - Foreign born (%)
Residents speaking other language at home (%)
Residents speaking other language at home - Born in the United States (%)
Residents speaking other language at home - Native, born elsewhere (%)
Residents speaking other language at home - Foreign born (%)
Class of Workers - Employee of private company (%)
Class of Workers - Self-employed in own incorporated business (%)
Class of Workers - Private not-for-profit wage and salary workers (%)
Class of Workers - Local government workers (%)
Class of Workers - State government workers (%)
Class of Workers - Federal government workers (%)
Class of Workers - Self-employed workers in own not incorporated business and Unpaid family workers (%)
House heating fuel used in houses and condos - Utility gas (%)
House heating fuel used in houses and condos - Bottled, tank, or LP gas (%)
House heating fuel used in houses and condos - Electricity (%)
House heating fuel used in houses and condos - Fuel oil, kerosene, etc. (%)
House heating fuel used in houses and condos - Coal or coke (%)
House heating fuel used in houses and condos - Wood (%)
House heating fuel used in houses and condos - Solar energy (%)
House heating fuel used in houses and condos - Other fuel (%)
House heating fuel used in houses and condos - No fuel used (%)
House heating fuel used in apartments - Utility gas (%)
House heating fuel used in apartments - Bottled, tank, or LP gas (%)
House heating fuel used in apartments - Electricity (%)
House heating fuel used in apartments - Fuel oil, kerosene, etc. (%)
House heating fuel used in apartments - Coal or coke (%)
House heating fuel used in apartments - Wood (%)
House heating fuel used in apartments - Solar energy (%)
House heating fuel used in apartments - Other fuel (%)
House heating fuel used in apartments - No fuel used (%)
Armed forces status - In Armed Forces (%)
Armed forces status - Civilian (%)
Armed forces status - Civilian - Veteran (%)
Armed forces status - Civilian - Nonveteran (%)
Fatal accidents locations in years 2005-2021
Fatal accidents locations in 2005
Fatal accidents locations in 2006
Fatal accidents locations in 2007
Fatal accidents locations in 2008
Fatal accidents locations in 2009
Fatal accidents locations in 2010
Fatal accidents locations in 2011
Fatal accidents locations in 2012
Fatal accidents locations in 2013
Fatal accidents locations in 2014
Fatal accidents locations in 2015
Fatal accidents locations in 2016
Fatal accidents locations in 2017
Fatal accidents locations in 2018
Fatal accidents locations in 2019
Fatal accidents locations in 2020
Fatal accidents locations in 2021
Alcohol use - People drinking some alcohol every month (%)
Alcohol use - People not drinking at all (%)
Alcohol use - Average days/month drinking alcohol
Alcohol use - Average drinks/week
Alcohol use - Average days/year people drink much
Audiometry - Average condition of hearing (%)
Audiometry - People that can hear a whisper from across a quiet room (%)
Audiometry - People that can hear normal voice from across a quiet room (%)
Audiometry - Ears ringing, roaring, buzzing (%)
Audiometry - Had a job exposure to loud noise (%)
Audiometry - Had off-work exposure to loud noise (%)
Blood Pressure & Cholesterol - Has high blood pressure (%)
Blood Pressure & Cholesterol - Checking blood pressure at home (%)
Blood Pressure & Cholesterol - Frequently checking blood cholesterol (%)
Blood Pressure & Cholesterol - Has high cholesterol level (%)
Consumer Behavior - Money monthly spent on food at supermarket/grocery store
Consumer Behavior - Money monthly spent on food at other stores
Consumer Behavior - Money monthly spent on eating out
Consumer Behavior - Money monthly spent on carryout/delivered foods
Consumer Behavior - Income spent on food at supermarket/grocery store (%)
Consumer Behavior - Income spent on food at other stores (%)
Consumer Behavior - Income spent on eating out (%)
Consumer Behavior - Income spent on carryout/delivered foods (%)
Current Health Status - General health condition (%)
Current Health Status - Blood donors (%)
Current Health Status - Has blood ever tested for HIV virus (%)
Current Health Status - Left-handed people (%)
Dermatology - People using sunscreen (%)
Diabetes - Diabetics (%)
Diabetes - Had a blood test for high blood sugar (%)
Diabetes - People taking insulin (%)
Diet Behavior & Nutrition - Diet health (%)
Diet Behavior & Nutrition - Milk product consumption (# of products/month)
Diet Behavior & Nutrition - Meals not home prepared (#/week)
Diet Behavior & Nutrition - Meals from fast food or pizza place (#/week)
Diet Behavior & Nutrition - Ready-to-eat foods (#/month)
Diet Behavior & Nutrition - Frozen meals/pizza (#/month)
Drug Use - People that ever used marijuana or hashish (%)
Drug Use - Ever used hard drugs (%)
Drug Use - Ever used any form of cocaine (%)
Drug Use - Ever used heroin (%)
Drug Use - Ever used methamphetamine (%)
Health Insurance - People covered by health insurance (%)
Kidney Conditions-Urology - Avg. # of times urinating at night
Medical Conditions - People with asthma (%)
Medical Conditions - People with anemia (%)
Medical Conditions - People with psoriasis (%)
Medical Conditions - People with overweight (%)
Medical Conditions - Elderly people having difficulties in thinking or remembering (%)
Medical Conditions - People who ever received blood transfusion (%)
Medical Conditions - People having trouble seeing even with glass/contacts (%)
Medical Conditions - People with arthritis (%)
Medical Conditions - People with gout (%)
Medical Conditions - People with congestive heart failure (%)
Medical Conditions - People with coronary heart disease (%)
Medical Conditions - People with angina pectoris (%)
Medical Conditions - People who ever had heart attack (%)
Medical Conditions - People who ever had stroke (%)
Medical Conditions - People with emphysema (%)
Medical Conditions - People with thyroid problem (%)
Medical Conditions - People with chronic bronchitis (%)
Medical Conditions - People with any liver condition (%)
Medical Conditions - People who ever had cancer or malignancy (%)
Mental Health - People who have little interest in doing things (%)
Mental Health - People feeling down, depressed, or hopeless (%)
Mental Health - People who have trouble sleeping or sleeping too much (%)
Mental Health - People feeling tired or having little energy (%)
Mental Health - People with poor appetite or overeating (%)
Mental Health - People feeling bad about themself (%)
Mental Health - People who have trouble concentrating on things (%)
Mental Health - People moving or speaking slowly or too fast (%)
Mental Health - People having thoughts they would be better off dead (%)
Oral Health - Average years since last visit a dentist
Oral Health - People embarrassed because of mouth (%)
Oral Health - People with gum disease (%)
Oral Health - General health of teeth and gums (%)
Oral Health - Average days a week using dental floss/device
Oral Health - Average days a week using mouthwash for dental problem
Oral Health - Average number of teeth
Pesticide Use - Households using pesticides to control insects (%)
Pesticide Use - Households using pesticides to kill weeds (%)
Physical Activity - People doing vigorous-intensity work activities (%)
Physical Activity - People doing moderate-intensity work activities (%)
Physical Activity - People walking or bicycling (%)
Physical Activity - People doing vigorous-intensity recreational activities (%)
Physical Activity - People doing moderate-intensity recreational activities (%)
Physical Activity - Average hours a day doing sedentary activities
Physical Activity - Average hours a day watching TV or videos
Physical Activity - Average hours a day using computer
Physical Functioning - People having limitations keeping them from working (%)
Physical Functioning - People limited in amount of work they can do (%)
Physical Functioning - People that need special equipment to walk (%)
Physical Functioning - People experiencing confusion/memory problems (%)
Physical Functioning - People requiring special healthcare equipment (%)
Prescription Medications - Average number of prescription medicines taking
Preventive Aspirin Use - Adults 40+ taking low-dose aspirin (%)
Reproductive Health - Vaginal deliveries (%)
Reproductive Health - Cesarean deliveries (%)
Reproductive Health - Deliveries resulted in a live birth (%)
Reproductive Health - Pregnancies resulted in a delivery (%)
Reproductive Health - Women breastfeeding newborns (%)
Reproductive Health - Women that had a hysterectomy (%)
Reproductive Health - Women that had both ovaries removed (%)
Reproductive Health - Women that have ever taken birth control pills (%)
Reproductive Health - Women taking birth control pills (%)
Reproductive Health - Women that have ever used Depo-Provera or injectables (%)
Reproductive Health - Women that have ever used female hormones (%)
Sexual Behavior - People 18+ that ever had sex (vaginal, anal, or oral) (%)
Sexual Behavior - Males 18+ that ever had vaginal sex with a woman (%)
Sexual Behavior - Males 18+ that ever performed oral sex on a woman (%)
Sexual Behavior - Males 18+ that ever had anal sex with a woman (%)
Sexual Behavior - Males 18+ that ever had any sex with a man (%)
Sexual Behavior - Females 18+ that ever had vaginal sex with a man (%)
Sexual Behavior - Females 18+ that ever performed oral sex on a man (%)
Sexual Behavior - Females 18+ that ever had anal sex with a man (%)
Sexual Behavior - Females 18+ that ever had any kind of sex with a woman (%)
Sexual Behavior - Average age people first had sex
Sexual Behavior - Average number of female sex partners in lifetime (males 18+)
Sexual Behavior - Average number of female vaginal sex partners in lifetime (males 18+)
Sexual Behavior - Average age people first performed oral sex on a woman (18+)
Sexual Behavior - Average number of woman performed oral sex on in lifetime (18+)
Sexual Behavior - Average number of male sex partners in lifetime (males 18+)
Sexual Behavior - Average number of male anal sex partners in lifetime (males 18+)
Sexual Behavior - Average age people first performed oral sex on a man (18+)
Sexual Behavior - Average number of male oral sex partners in lifetime (18+)
Sexual Behavior - People using protection when performing oral sex (%)
Sexual Behavior - Average number of times people have vaginal or anal sex a year
Sexual Behavior - People having sex without condom (%)
Sexual Behavior - Average number of male sex partners in lifetime (females 18+)
Sexual Behavior - Average number of male vaginal sex partners in lifetime (females 18+)
Sexual Behavior - Average number of female sex partners in lifetime (females 18+)
Sexual Behavior - Circumcised males 18+ (%)
Sleep Disorders - Average hours sleeping at night
Sleep Disorders - People that has trouble sleeping (%)
Smoking-Cigarette Use - People smoking cigarettes (%)
Taste & Smell - People 40+ having problems with smell (%)
Taste & Smell - People 40+ having problems with taste (%)
Taste & Smell - People 40+ that ever had wisdom teeth removed (%)
Taste & Smell - People 40+ that ever had tonsils teeth removed (%)
Taste & Smell - People 40+ that ever had a loss of consciousness because of a head injury (%)
Taste & Smell - People 40+ that ever had a broken nose or other serious injury to face or skull (%)
Taste & Smell - People 40+ that ever had two or more sinus infections (%)
Weight - Average height (inches)
Weight - Average weight (pounds)
Weight - Average BMI
Weight - People that are obese (%)
Weight - People that ever were obese (%)
Weight - People trying to lose weight (%)
Urban population: 3,442
Rural population: 9,953
Estimated median house/condo value in 2022: $229,523
34432:
$229,523Florida:
$354,100
Median resident age: This zip code:
56.3 yearsFlorida median age:
42.7 years
Average household size: This zip code:
2.2 peopleFlorida:
2.5 people
Averages for the 2020 tax year for zip code 34432, filed in 2021:
Average Adjusted Gross Income (AGI) in 2020: $51,495 (Individual Income Tax Returns) Here:
$51,495State:
$82,200
Salary/wage: $40,365 (reported on 62.7% of returns )Here:
$40,365State:
$58,347
(% of AGI for various income ranges: 968.0% for AGIs below $25k , 3053.9% for AGIs $25k-50k , 4766.1% for AGIs $50k-75k , 6910.3% for AGIs $75k-100k , 12067.0% for AGIs $100k-200k , 41026.7% for AGIs over 200k ) Taxable interest for individuals: $1,797 (reported on 32.5% of returns )This zip code:
$1,797Florida:
$4,272
(% of AGI for various income ranges: 31.6% for AGIs below $25k , 52.2% for AGIs $25k-50k , 90.5% for AGIs $50k-75k , 127.5% for AGIs $75k-100k , 302.1% for AGIs $100k-200k , 1610.0% for AGIs over 200k ) Ordinary dividends: $5,771 (reported on 20.6% of returns )(% of AGI for various income ranges: 39.7% for AGIs below $25k , 66.5% for AGIs $25k-50k , 177.5% for AGIs $50k-75k , 304.7% for AGIs $75k-100k , 710.3% for AGIs $100k-200k , 4890.0% for AGIs over 200k ) Net capital gain/loss in AGI: +$13,974 (reported on 19.0% of returns )Here:
+$13,974State:
+$62,983
(% of AGI for various income ranges: 11.1% for AGIs below $25k , 42.2% for AGIs $25k-50k , 109.7% for AGIs $50k-75k , 454.1% for AGIs $75k-100k , 1511.8% for AGIs $100k-200k , 28503.3% for AGIs over 200k ) Profit/loss from business: +$8,611 (reported on 14.9% of returns )Here:
+$8,611State:
+$9,719
(% of AGI for various income ranges: 167.3% for AGIs below $25k , 121.1% for AGIs $25k-50k , 157.0% for AGIs $50k-75k , 229.1% for AGIs $75k-100k , 450.0% for AGIs $100k-200k , 1576.7% for AGIs over 200k ) Taxable individual retirement arrangement distribution: $19,603 (reported on 16.9% of returns )34432:
$19,603Florida:
$24,823
(% of AGI for various income ranges: 116.7% for AGIs below $25k , 222.6% for AGIs $25k-50k , 552.0% for AGIs $50k-75k , 834.1% for AGIs $75k-100k , 1719.4% for AGIs $100k-200k , 13553.3% for AGIs over 200k ) Total itemized deductions: $30,409 (reported on 3.7% of returns )Here:
$30,409State:
$45,393
(% of AGI for various income ranges: 120.0% for AGIs $25k-50k , 166.2% for AGIs $50k-75k , 343.4% for AGIs $75k-100k , 662.7% for AGIs $100k-200k , 4260.0% for AGIs over 200k ) Charity contributions: $11,062 (reported on 2.6% of returns )Here:
$11,062State:
$20,178
(% of AGI for various income ranges: 12.8% for AGIs $25k-50k , 26.9% for AGIs $50k-75k , 44.7% for AGIs $75k-100k , 175.8% for AGIs $100k-200k , 2440.0% for AGIs over 200k ) Taxes paid: $5,000 (reported on 3.6% of returns )(% of AGI for various income ranges: 16.0% for AGIs $25k-50k , 27.7% for AGIs $50k-75k , 57.8% for AGIs $75k-100k , 113.0% for AGIs $100k-200k , 613.3% for AGIs over 200k ) Earned income credit: $2,237 (reported on 17.9% of returns )(% of AGI for various income ranges: 103.7% for AGIs below $25k , 59.2% for AGIs $25k-50k ) Percentage of individuals using paid preparers for their 2020 taxes: 91.7%(% for various income ranges: 91.2% for AGIs below $25k , 92.4% for AGIs $25k-50k , 93.5% for AGIs $50k-75k , 92.5% for AGIs $75k-100k , 88.9% for AGIs $100k-200k , 91.7% for AGIs over 200k )
Averages for the 2012 tax year for zip code 34432, filed in 2013:
Average Adjusted Gross Income (AGI) in 2012: $44,124 (Individual Income Tax Returns) Here:
$44,124State:
$60,316
Salary/wage: $32,522 (reported on 61.2% of returns )Here:
$32,522State:
$45,277
(% of AGI for various income ranges: 56.8% for AGIs below $25k , 56.9% for AGIs $25k-50k , 47.0% for AGIs $50k-75k , 35.9% for AGIs $75k-100k , 35.5% for AGIs $100k-200k , 37.2% for AGIs over 200k ) Taxable interest for individuals: $2,068 (reported on 37.5% of returns )This zip code:
$2,068Florida:
$3,587
(% of AGI for various income ranges: 2.7% for AGIs below $25k , 1.8% for AGIs $25k-50k , 1.5% for AGIs $50k-75k , 1.8% for AGIs $75k-100k , 1.9% for AGIs $100k-200k , 0.8% for AGIs over 200k ) Ordinary dividends: $5,396 (reported on 26.1% of returns )(% of AGI for various income ranges: 3.3% for AGIs below $25k , 2.3% for AGIs $25k-50k , 2.4% for AGIs $50k-75k , 2.4% for AGIs $75k-100k , 5.0% for AGIs $100k-200k , 3.9% for AGIs over 200k ) Net capital gain/loss in AGI: +$4,666 (reported on 20.6% of returns )Here:
+$4,666State:
+$33,493
(% of AGI for various income ranges: 0.5% for AGIs $50k-75k , 1.5% for AGIs $75k-100k , 3.2% for AGIs $100k-200k , 11.9% for AGIs over 200k ) Profit/loss from business: +$7,695 (reported on 12.5% of returns )Here:
+$7,695State:
+$10,012
(% of AGI for various income ranges: 7.8% for AGIs below $25k , 1.6% for AGIs $25k-50k , 1.4% for AGIs $50k-75k , 0.6% for AGIs $75k-100k , 2.3% for AGIs $100k-200k ) Taxable individual retirement arrangement distribution: $15,767 (reported on 23.7% of returns )34432:
$15,767Florida:
$21,544
(% of AGI for various income ranges: 7.2% for AGIs below $25k , 7.8% for AGIs $25k-50k , 8.1% for AGIs $50k-75k , 10.3% for AGIs $75k-100k , 13.0% for AGIs $100k-200k ) Total itemized deductions: $20,622 (27% of AGI, reported on 21.2% of returns )Here:
$20,622State:
$25,533
Here:
27.0% of AGIState:
18.0% of AGI
(% of AGI for various income ranges: 9.9% for AGIs below $25k , 9.9% for AGIs $25k-50k , 9.8% for AGIs $50k-75k , 9.4% for AGIs $75k-100k , 11.4% for AGIs $100k-200k , 7.6% for AGIs over 200k ) Charity contributions: $3,633 (reported on 16.7% of returns )(% of AGI for various income ranges: 0.7% for AGIs below $25k , 1.1% for AGIs $25k-50k , 1.2% for AGIs $50k-75k , 1.5% for AGIs $75k-100k , 2.0% for AGIs $100k-200k , 1.4% for AGIs over 200k ) Taxes paid: $4,386 (reported on 21.0% of returns )(% of AGI for various income ranges: 1.6% for AGIs below $25k , 1.7% for AGIs $25k-50k , 2.2% for AGIs $50k-75k , 2.0% for AGIs $75k-100k , 2.2% for AGIs $100k-200k , 3.0% for AGIs over 200k ) Earned income credit: $2,314 (reported on 19.4% of returns )(% of AGI for various income ranges: 6.1% for AGIs below $25k , 1.1% for AGIs $25k-50k ) Percentage of individuals using paid preparers for their 2012 taxes: 44.7%(% for various income ranges: 41.4% for AGIs below $25k , 42.5% for AGIs $25k-50k , 47.9% for AGIs $50k-75k , 47.5% for AGIs $75k-100k , 57.9% for AGIs $100k-200k , 80.0% for AGIs over 200k )
Averages for the 2004 tax year for zip code 34432, filed in 2005:
Average Adjusted Gross Income (AGI) in 2004: $38,777 (Individual Income Tax Returns) Here:
$38,777State:
$50,523
Salary/wage: $27,822 (reported on 65.2% of returns )Here:
$27,822State:
$39,563
(% of AGI for various income ranges: 85.7% for AGIs below $10k , 56.7% for AGIs $10k-25k , 55.7% for AGIs $25k-50k , 47.9% for AGIs $50k-75k , 40.9% for AGIs $75k-100k , 31.4% for AGIs over 100k ) Taxable interest for individuals: $2,510 (reported on 49.4% of returns )This zip code:
$2,510Florida:
$3,211
(% of AGI for various income ranges: 8.5% for AGIs below $10k , 4.6% for AGIs $10k-25k , 3.0% for AGIs $25k-50k , 2.6% for AGIs $50k-75k , 3.5% for AGIs $75k-100k , 2.7% for AGIs over 100k ) Taxable dividends: $3,673 (reported on 32.3% of returns )(% of AGI for various income ranges: 8.6% for AGIs below $10k , 3.1% for AGIs $10k-25k , 2.3% for AGIs $25k-50k , 2.6% for AGIs $50k-75k , 2.5% for AGIs $75k-100k , 4.1% for AGIs over 100k ) Net capital gain/loss: +$6,128 (reported on 26.7% of returns )Here:
+$6,128State:
+$27,205
(% of AGI for various income ranges: -5.8% for AGIs below $10k , -0.8% for AGIs $10k-25k , 1.3% for AGIs $25k-50k , 2.3% for AGIs $50k-75k , 4.6% for AGIs $75k-100k , 12.4% for AGIs over 100k ) Profit/loss from business: +$9,611 (reported on 12.9% of returns )Here:
+$9,611State:
+$10,634
(% of AGI for various income ranges: 6.6% for AGIs below $10k , 4.3% for AGIs $10k-25k , 2.8% for AGIs $25k-50k , 2.5% for AGIs $50k-75k , 2.5% for AGIs $75k-100k , 3.7% for AGIs over 100k ) IRA payment deduction: $3,382 (reported on 2.3% of returns )34432:
$3,382Florida:
$3,082
(% of AGI for various income ranges: 0.1% for AGIs $10k-25k , 0.3% for AGIs $25k-50k , 0.3% for AGIs $50k-75k , 0.2% for AGIs over 100k ) Self-employed pension: $9,933 (reported on 0.3% of returns )Here:
$9,933Florida:
$15,857
Total itemized deductions: $16,288 (26% of AGI, reported on 25.0% of returns )Here:
$16,288State:
$20,370
Here:
26.0% of AGIState:
20.7% of AGI
(% of AGI for various income ranges: 22.2% for AGIs below $10k , 11.9% for AGIs $10k-25k , 11.2% for AGIs $25k-50k , 11.0% for AGIs $50k-75k , 9.9% for AGIs $75k-100k , 7.9% for AGIs over 100k ) Charity contributions deductions: $2,750 (4% of AGI, reported on 21.2% of returns )Here:
4.5% of AGIState:
3.8% of AGI
(% of AGI for various income ranges: 0.9% for AGIs below $10k , 1.0% for AGIs $10k-25k , 1.2% for AGIs $25k-50k , 1.7% for AGIs $50k-75k , 1.9% for AGIs $75k-100k , 1.8% for AGIs over 100k ) Total tax: $5,325 (reported on 73.4% of returns )(% of AGI for various income ranges: 2.8% for AGIs below $10k , 3.4% for AGIs $10k-25k , 6.2% for AGIs $25k-50k , 9.3% for AGIs $50k-75k , 11.8% for AGIs $75k-100k , 18.2% for AGIs over 100k ) Earned income credit: $1,690 (reported on 15.2% of returns )Percentage of individuals using paid preparers for their 2004 taxes: 54.1%(% for various income ranges: 50.9% for AGIs below $10k , 52.6% for AGIs $10k-25k , 55.4% for AGIs $25k-50k , 52.3% for AGIs $50k-75k , 56.7% for AGIs $75k-100k , 68.4% for AGIs over 100k )
Estimated median household income in 2022: This zip code:
$46,513Florida:
$69,303
Nearest zip codes: 34434 ,
34481 ,
34445 ,
34442 ,
34433 ,
34431 .
Dunnellon Zip Code Map
Percentage of family households: This zip code:
24.1%Florida:
41.2%
Percentage of households with unmarried partners: This zip code:
6.1%Florida:
46.7%
Likely homosexual households (counted as self-reported same-sex unmarried-partner households)
Lesbian couples: 0.1% of all households Gay men: 0.1% of all households
Household received Food Stamps/SNAP in the past 12 months: 747Household did not receive Food Stamps/SNAP in the past 12 months: 5,268
Women who had a birth in the past 12 months: 98 (103 now married , 0 unmarried) Women who did not have a birth in the past 12 months: 1,768 (710 now married , 1,057 unmarried)
Housing units in zip code 34432 with a mortgage: 2,347 (182
second mortgage , 160
both second mortgage and home equity loan )
Houses without a mortgage: 126
Median monthly owner costs for units with a mortgage: $1,134
Median monthly owner costs for units without a mortgage: $429
Residents with income below the poverty level in 2022:
This zip code:
21.0%Whole state:
12.7%
Residents with income below 50% of the poverty level in 2022:
This zip code:
13.3%Whole state:
6.6%
Median number of rooms in houses and condos: Median number of rooms in apartments: Notable locations in this zip code not listed on our city pages
Click to draw/clear zip code borders Notable locations in zip code 34432: (A) , Dunnellon High School Football Stadium (B) , Marion County Sheriffs Office-Dunnellon District (C) , Dunnellon Water Treatment Plant (D) , Dunnellon City Fire Department (E) , Dunnellon Police Department (F) , Timber Ridge Community Center (G) , Progress Energy Electric Substation (H) , Progress Energy Electric Substation-Ross Prairie (I) , Marion County Fire Rescue Station 31 (J) , Marion County Fire Rescue Station 25 Lake Tropicana (K) , Marion County Fire Rescue Station 5 Florida Highlands (L) . Display/hide their locations on the map
Churches in zip code 34432 include: (A) , Beulah Missionary Baptist Church (B) , Church of Christ (C) , Union Missionary Baptist Church (D) , Holy Faith Episcopal Church (E) , Peace Lutheran Church (F) , House of Jacob Ministries (G) , First Bethal Missionary Baptist Church (H) , Timber Ridge Community Church (I) . Display/hide their locations on the map
Lakes and swamps: (A) , Lake Otting (B) , Ross Pond (C) . Display/hide their locations on the map
River: (A) . Display/hide its location on the map
Parks in zip code 34432 include: (1) , Rainbow Springs State Park (2) . Display/hide their locations on the map
Year house built (houses)
6 2020 or later461 2010 to 20192,306 2000 to 20091,810 1990 to 19991,134 1980 to 1989396 1970 to 1979369 1960 to 196954 1950 to 195915 1940 to 194967 1939 or earlier
Zip code 34432 household income distribution in 2022 376 Less than $10,000263 $10,000 to $14,999300 $15,000 to $19,999347 $20,000 to $24,999486 $25,000 to $29,999458 $30,000 to $34,999356 $35,000 to $39,999290 $40,000 to $44,999389 $45,000 to $49,999474 $50,000 to $59,999451 $60,000 to $74,999679 $75,000 to $99,999429 $100,000 to $124,999260 $125,000 to $149,999217 $150,000 to $199,999148 $200,000 or moreEstimate of home value of owner-occupied houses/condos in 2022 in zip code 34432 98 Less than $10,000149 $10,000 to $14,99950 $15,000 to $19,99928 $20,000 to $24,99930 $25,000 to $29,99971 $30,000 to $34,99917 $35,000 to $39,99963 $40,000 to $49,99966 $50,000 to $59,999113 $60,000 to $69,99964 $70,000 to $79,99923 $80,000 to $89,99965 $90,000 to $99,999246 $100,000 to $124,999236 $125,000 to $149,999444 $150,000 to $174,999365 $175,000 to $199,999656 $200,000 to $249,999517 $250,000 to $299,999517 $300,000 to $399,999296 $400,000 to $499,999181 $500,000 to $749,9999 $750,000 to $999,99922 $1,000,000 to $1,499,99924 $1,500,000 to $1,999,999Rent paid by renters in 2022 in zip code 34432 5 $150 to $19921 $200 to $24924 $300 to $34917 $350 to $39936 $450 to $49933 $500 to $54912 $550 to $5994 $600 to $64935 $650 to $69957 $700 to $749151 $750 to $79931 $800 to $8999 $900 to $99952 $1,000 to $1,24939 $1,500 to $1,999110 No cash rent
Median gross rent in 2022: $994.
Median price asked for vacant for-sale houses and condos in 2022: $202,853.
Estimated median house (or condo) value in 2022 for: White Non-Hispanic householders: $295,881Black or African American householders: $115,021Two or more races householders: $179,818Hispanic or Latino householders: $135,839Estimated median house or condo value in 2022: $229,523
34432:
$229,523Florida:
$354,100
Lower value quartile - upper value quartile: $153,813 - $311,498
Mean price in 2022: Detached houses: $240,001Here:
$240,001State:
$500,941
In 5-or-more-unit structures: $248,373Here:
$248,373State:
$447,145
Mobile homes: $66,965Here:
$66,965State:
$113,202
Housing units in structures:
One, detached: 4,902One, attached: 31Two: 183 or 4: 1635 to 9: 3610 to 19: 2620 to 49: 7Mobile homes: 1,579Unemployment : 5.7%
Means of transportation to work in zip code 34432 72.7% 3,080 Drove a car alone8.1% 341 Carpooled0.9% 40 Bicycle1.6% 68 Walked1.1% 48 Other means14.9% 633 Worked at homeTravel time to work (commute) in zip code 34432 54 Less than 5 minutes284 5 to 9 minutes299 10 to 14 minutes522 15 to 19 minutes327 20 to 24 minutes212 25 to 29 minutes709 30 to 34 minutes319 35 to 39 minutes74 40 to 44 minutes552 45 to 59 minutes123 60 to 89 minutes101 90 or more minutes
Percentage of zip code residents living and working in this county: 80.5%
Household type by relationship:
Households: 13,396
Male householders: 2,817 (756 living alone ), Female householders: 3,202 (1,147 living alone )3,012 spouses (2,978 opposite-sex spouses ), 394 unmarried partners , (392 opposite-sex unmarried partners ), 2,801 children (2,735 natural , 32 adopted , 38 stepchildren ), 355 grandchildren , 82 brothers or sisters , 182 parents , 4 foster children , 184 other relatives , 417 non-relatives In group quarters: 21 (-1 institutionalized population )
Size of family households: 2,241 2-persons , 847 3-persons , 402 4-persons , 96 5-persons , 102 6-persons , 97 7-or-more-persons
Size of nonfamily households: 1,903 1-person , 269 2-persons , 26 3-persons , 39 5-persons
1,060 married couples with children. single-parent households (61 men , 745 women ).
91.8% of residents of 34432 zip code speak English at home. of residents speak Spanish at home (68% very well, 19% well, 12% not well ).of residents speak other Indo-European language at home (98% very well, 2% well ).of residents speak Asian or Pacific Island language at home (88% very well, 12% well ).
Foreign born population: 803 (6.0%)
(76.3%
of them are naturalized citizens )
This zip code:
6.0%Whole state:
21.7%
29% Honduras 18% Sweden 11% United Kingdom, excluding England and Scotland 7% Barbados 6% Malaysia 6% France 4% Bolivia 19% American 16% English 10% German 7% Irish 5% Italian 3% Scottish 3% Polish
Year of entry for the foreign-born population
550 2010 or later 95 2000 to 2009 240 1990 to 1999 436 Before 1990
Facilities with environmental interests located in this zip code:
PLAZA CLEANERS (11352 WILLIAMS STREET in DUNNELLON, FL)
AIR MINOR (AIRS/AFS) (Resource Conservation and Recovery Act (tracking hazardous waste)) Business SIC classification: DRYCLEANING PLANTS, EXCEPT RUG CLEANINGOrganizations: NON-NOTIFIER (CONTACT/OWNER)
Alternative names: STEPHEN SEPE
CITRUS DRY CLEANING INC (11884 NW WILLIAMS STREET in DUNNELLON, FL)
AIR MINOR (AIRS/AFS) (Resource Conservation and Recovery Act (tracking hazardous waste)) Business SIC classification: DRYCLEANING PLANTS, EXCEPT RUG CLEANINGOrganizations: NON NOTIFIER (CONTACT/OWNER)
Alternative names: DUNNELLON CLEANERS
SOUTHDOWN INCORPORATED (11423 WILLIAMS STREET in DUNNELLON, FL)
National Pollutant Discharge Elimination System NON-MAJOR (Tracking pollutant discharge elimination systems) - permit Business SIC classification: READY-MIXED CONCRETEOrganizations: WILLIAM GENTRY (CONTACT/OWNER)
Alternative names: SOUTHDOWN, INC. - DUNNELLON PL
ACTICARB TAILORED PRODUCTS, LLC (551 N US 41 in DUNNELLON, FL)
AIR SYNTHETIC MINOR (AIRS/AFS) CRITERIA AND HAZARDOUS AIR POLLUTANT INVENTORY (Inventory of air pollution sources) Small Quantity Generators, between 100 kg and 1000 kg of hazardous waste/month (Resource Conservation and Recovery Act (tracking hazardous waste)) - notification Business SIC classification: INDUSTRIAL INORGANIC CHEMICALSOrganizations: JAMES KEETER (CONTACT/OWNER)
MAINES SUBDIVISION (CR 328 - 3.2 MI W OF SR 40 in DUNNELLON, FL)
National Pollutant Discharge Elimination System NON-MAJOR (Tracking pollutant discharge elimination systems) - permit Organizations: RICHARD JOHNSON (CONTACT/OWNER)
RAINBOW SPRINGS GOVN'T COMPLEX (8590 S HWY 41 in DUNNELLON, FL)
National Pollutant Discharge Elimination System NON-MAJOR (Tracking pollutant discharge elimination systems) - permit Organizations: JACK ETHRIDGE (CONTACT/OWNER)
CIRCLE K #0210 (US HWY 41/PENNSYLVANIA ST in DUNNELLON, FL)
(Resource Conservation and Recovery Act (tracking hazardous waste)) Organizations: STEVE BELIN, COMPLIANCE MGR (CONTACT/OWNER)
HUNTLEY JIFFY FOOD STORES #138 (DR 488 & CR 495 in DUNNELLON, FL)
Small Quantity Generators, between 100 kg and 1000 kg of hazardous waste/month (Resource Conservation and Recovery Act (tracking hazardous waste)) - notification Organizations: ROBERT ARENBURGH, ENVIRON SPEC (CONTACT/OWNER)
CJS TRANSMISSIONS (12115 S WILLIAMS ST in DUNNELLON, FL)
Small Quantity Generators, between 100 kg and 1000 kg of hazardous waste/month (Resource Conservation and Recovery Act (tracking hazardous waste)) - notification Organizations: JOHN GIOVAGNONI, PRES (CONTACT/OWNER)
A.S.A. MFG., INC (14879 SW 111TH ST in DUNNELLON, FL)
AIR MAJOR (AIRS/AFS) Business SIC classification: PLASTICS PRODUCTS
SPARKLING H20 SYSTEM (10273 S.W. 1863 AVENUE in DUNNELLOW, FL)
COMPLIANCE ACTIVITY (Tracking inspections of insecticide, fungicide, and rodenticide, and toxic substances)
Housing units lacking complete kitchen facilities: 0.2%
95.7% Electricity 1.1% No fuel used 1.1% Bottled, tank, or LP gas 1.0% Wood 1.0% Solar energy
Place of birth for U.S.-born residents:
This state: 4,661Northeast: 3,685Midwest: 2,050South: 1,269West: 392
47% of the 34432 zip code residents lived in the same house 5 years ago.
Out of people who lived in different houses, 25% lived in this county.
Out of people who lived in different counties, 50% lived in Florida.
94% of the 34432 zip code residents lived in the same house 1 year ago.
Out of people who lived in different houses, 21% moved from this county.
Out of people who lived in different houses, 50% moved from different county within same state.
Out of people who lived in different houses, 37% moved from different state.
Private vs. public school enrollment:
Students in private schools in grades 1 to 8 (elementary and middle school): 199
Students in private schools in grades 9 to 12 (high school): 62
Students in private undergraduate colleges: 38
Occupation by median earnings in the past 12 months ($)
64,143 Community and social service occupations 60,274 Architecture and engineering occupations 58,394 Health diagnosing and treating practitioners and other technical occupations 52,876 Law enforcement workers including supervisors 44,091 Health technologists and technicians 41,427 Business and financial operations occupations
Top industries in this zip code by the number of employees in 2005:
Accommodation and Food Services: Limited-Service Restaurants (50-99 employees: 1 establishment, 20-49 employees: 3 establishments, 10-19 employees: 1 establishment, 5-9 employees: 1 establishment, 1-4 employees: 3 establishments)Construction: Roofing Contractors (50-99: 1, 10-19: 1, 5-9: 1)Accommodation and Food Services: Full-Service Restaurants (20-49: 1, 10-19: 1, 5-9: 2, 1-4: 1)Construction: Plumbing, Heating, and Air-Conditioning Contractors (20-49: 1, 5-9: 2, 1-4: 4)Finance and Insurance: Commercial Banking (20-49: 1, 10-19: 1, 5-9: 1)Health Care and Social Assistance: Offices of Dentists (10-19: 3)
People in group quarters in 2010:
177 people in nursing facilities/skilled-nursing facilities
People in group quarters in 2000:
135 people in nursing homes
73 people in other noninstitutional group quarters
Fatal accident statistics in 2014:
Fatal accident count: 2Vehicles involved in fatal accidents: 4Fatal accidents caused by drunken drivers: 2Fatalities: 3Persons involved in fatal accidents: 4Pedestrians involved in fatal accidents: 0
Fatal accident statistics in 2012:
Fatal accident count: 1Vehicles involved in fatal accidents: 1Fatal accidents caused by drunken drivers: 0Fatalities: 1Persons involved in fatal accidents: 1Pedestrians involved in fatal accidents: 1
Home Mortgage Disclosure Act Aggregated Statistics For Year 2009(Based on 10 partial tracts) A) FHA, FSA/RHS & VA B) Conventional C) Refinancings D) Home Improvement Loans F) Non-occupant Loans on G) Loans On Manufactured Number Average Value Number Average Value Number Average Value Number Average Value Number Average Value Number Average Value
LOANS ORIGINATED 182 $113,500 268 $123,003 535 $135,822 33 $54,593 126 $126,450 29 $76,420 APPLICATIONS APPROVED, NOT ACCEPTED 11 $127,577 21 $112,739 61 $133,011 2 $12,630 9 $117,822 5 $79,486 APPLICATIONS DENIED 45 $120,456 53 $124,995 375 $146,001 41 $61,611 59 $125,971 46 $68,962 APPLICATIONS WITHDRAWN 36 $113,998 45 $123,704 210 $155,073 5 $65,922 32 $152,574 10 $86,252 FILES CLOSED FOR INCOMPLETENESS 11 $94,818 13 $180,758 43 $157,029 5 $62,242 8 $140,514 5 $102,408
Aggregated Statistics For Year 2008(Based on 10 partial tracts) A) FHA, FSA/RHS & VA B) Conventional C) Refinancings D) Home Improvement Loans E) Loans on Dwellings For 5+ Families F) Non-occupant Loans on G) Loans On Manufactured Number Average Value Number Average Value Number Average Value Number Average Value Number Average Value Number Average Value Number Average Value
LOANS ORIGINATED 148 $138,751 421 $152,203 492 $146,042 54 $58,562 1 $89,180 199 $173,521 75 $85,348 APPLICATIONS APPROVED, NOT ACCEPTED 15 $146,049 93 $151,809 136 $147,761 14 $77,584 0 $0 55 $180,018 24 $85,590 APPLICATIONS DENIED 48 $138,286 128 $183,471 587 $164,607 103 $111,605 0 $0 119 $168,410 85 $91,396 APPLICATIONS WITHDRAWN 19 $139,158 79 $175,961 183 $162,086 5 $97,188 0 $0 39 $148,408 10 $84,436 FILES CLOSED FOR INCOMPLETENESS 8 $131,832 25 $206,835 77 $144,490 3 $126,927 0 $0 22 $140,143 7 $74,016
Aggregated Statistics For Year 2007(Based on 10 partial tracts) A) FHA, FSA/RHS & VA B) Conventional C) Refinancings D) Home Improvement Loans F) Non-occupant Loans on G) Loans On Manufactured Number Average Value Number Average Value Number Average Value Number Average Value Number Average Value Number Average Value
LOANS ORIGINATED 68 $144,860 1,090 $172,023 1,109 $155,754 162 $82,309 741 $184,174 129 $85,323 APPLICATIONS APPROVED, NOT ACCEPTED 3 $98,920 180 $160,582 304 $155,850 42 $68,950 131 $167,597 44 $85,550 APPLICATIONS DENIED 16 $149,665 358 $184,608 961 $170,429 178 $112,308 298 $178,137 126 $82,485 APPLICATIONS WITHDRAWN 7 $174,814 131 $164,461 430 $165,849 24 $130,075 97 $167,269 18 $93,282 FILES CLOSED FOR INCOMPLETENESS 1 $302,740 57 $211,112 140 $182,698 9 $136,659 38 $232,282 7 $81,501
Aggregated Statistics For Year 2006(Based on 10 partial tracts) A) FHA, FSA/RHS & VA B) Conventional C) Refinancings D) Home Improvement Loans F) Non-occupant Loans on G) Loans On Manufactured Number Average Value Number Average Value Number Average Value Number Average Value Number Average Value Number Average Value
LOANS ORIGINATED 48 $132,869 2,016 $145,901 1,325 $142,131 170 $74,367 1,071 $151,633 153 $79,012 APPLICATIONS APPROVED, NOT ACCEPTED 7 $113,677 284 $146,250 262 $144,728 36 $48,598 148 $156,889 37 $84,691 APPLICATIONS DENIED 11 $125,695 469 $139,734 839 $155,791 160 $71,374 276 $146,785 130 $79,074 APPLICATIONS WITHDRAWN 3 $132,023 246 $145,686 578 $139,472 27 $96,835 145 $150,602 28 $77,100 FILES CLOSED FOR INCOMPLETENESS 1 $125,420 69 $142,734 165 $150,948 4 $41,375 39 $168,551 4 $83,632
Aggregated Statistics For Year 2005(Based on 10 partial tracts) A) FHA, FSA/RHS & VA B) Conventional C) Refinancings D) Home Improvement Loans E) Loans on Dwellings For 5+ Families F) Non-occupant Loans on G) Loans On Manufactured Number Average Value Number Average Value Number Average Value Number Average Value Number Average Value Number Average Value Number Average Value
LOANS ORIGINATED 82 $120,132 1,882 $124,923 1,049 $121,223 141 $50,807 0 $0 803 $125,854 151 $70,994 APPLICATIONS APPROVED, NOT ACCEPTED 5 $138,940 247 $125,357 222 $107,160 33 $46,575 1 $38,570 96 $136,086 46 $74,327 APPLICATIONS DENIED 8 $127,555 411 $123,649 812 $120,536 173 $45,871 0 $0 172 $125,005 180 $67,990 APPLICATIONS WITHDRAWN 3 $201,810 202 $125,572 672 $120,641 51 $106,667 0 $0 92 $119,106 51 $77,222 FILES CLOSED FOR INCOMPLETENESS 1 $76,920 51 $141,072 157 $132,062 7 $63,327 0 $0 18 $116,317 8 $75,668
Aggregated Statistics For Year 2004(Based on 10 partial tracts) A) FHA, FSA/RHS & VA B) Conventional C) Refinancings D) Home Improvement Loans F) Non-occupant Loans on G) Loans On Manufactured Number Average Value Number Average Value Number Average Value Number Average Value Number Average Value Number Average Value
LOANS ORIGINATED 103 $105,336 1,300 $105,497 755 $93,456 90 $42,998 442 $101,522 148 $60,964 APPLICATIONS APPROVED, NOT ACCEPTED 6 $92,777 151 $96,565 189 $92,051 28 $41,646 53 $100,103 53 $61,066 APPLICATIONS DENIED 14 $87,667 223 $94,750 723 $93,127 123 $57,365 101 $89,366 140 $56,122 APPLICATIONS WITHDRAWN 7 $84,781 123 $110,086 477 $100,955 26 $59,007 41 $118,687 62 $66,940 FILES CLOSED FOR INCOMPLETENESS 2 $100,150 24 $113,437 87 $105,906 14 $34,076 10 $72,828 7 $65,153
Aggregated Statistics For Year 2003(Based on 10 partial tracts) A) FHA, FSA/RHS & VA B) Conventional C) Refinancings D) Home Improvement Loans F) Non-occupant Loans on Number Average Value Number Average Value Number Average Value Number Average Value Number Average Value
LOANS ORIGINATED 96 $89,794 982 $93,599 1,355 $86,602 65 $31,585 355 $93,003 APPLICATIONS APPROVED, NOT ACCEPTED 8 $96,668 95 $99,157 217 $84,631 15 $31,321 32 $98,772 APPLICATIONS DENIED 19 $86,805 156 $90,741 788 $88,242 68 $35,454 61 $87,962 APPLICATIONS WITHDRAWN 21 $82,191 86 $92,882 462 $95,198 8 $35,396 31 $78,818 FILES CLOSED FOR INCOMPLETENESS 6 $79,207 17 $98,520 57 $101,326 6 $39,710 8 $78,454
Aggregated Statistics For Year 2002(Based on 6 partial tracts) A) FHA, FSA/RHS & VA B) Conventional C) Refinancings D) Home Improvement Loans E) Loans on Dwellings For 5+ Families F) Non-occupant Loans on Number Average Value Number Average Value Number Average Value Number Average Value Number Average Value Number Average Value
LOANS ORIGINATED 25 $96,724 320 $85,821 426 $109,894 45 $37,171 0 $0 74 $95,605 APPLICATIONS APPROVED, NOT ACCEPTED 2 $67,700 30 $61,405 84 $95,755 8 $21,744 2 $40,845 8 $89,350 APPLICATIONS DENIED 5 $96,762 65 $89,519 197 $94,781 28 $21,312 0 $0 17 $44,178 APPLICATIONS WITHDRAWN 4 $87,448 27 $72,243 119 $91,526 1 $85,350 0 $0 7 $102,671 FILES CLOSED FOR INCOMPLETENESS 1 $39,970 8 $79,318 23 $142,844 0 $0 0 $0 2 $72,780
Aggregated Statistics For Year 2001(Based on 6 partial tracts) A) FHA, FSA/RHS & VA B) Conventional C) Refinancings D) Home Improvement Loans E) Loans on Dwellings For 5+ Families F) Non-occupant Loans on Number Average Value Number Average Value Number Average Value Number Average Value Number Average Value Number Average Value
LOANS ORIGINATED 29 $89,500 418 $80,904 334 $81,253 28 $22,615 1 $1,716,530 81 $83,958 APPLICATIONS APPROVED, NOT ACCEPTED 1 $75,150 38 $59,739 63 $72,236 6 $8,322 0 $0 12 $49,781 APPLICATIONS DENIED 2 $69,155 114 $61,356 242 $69,273 36 $24,965 0 $0 10 $117,711 APPLICATIONS WITHDRAWN 3 $86,327 23 $83,005 124 $68,949 7 $21,377 0 $0 4 $38,148 FILES CLOSED FOR INCOMPLETENESS 0 $0 3 $55,550 20 $112,174 1 $10,160 0 $0 1 $37,260
Aggregated Statistics For Year 2000(Based on 6 partial tracts) A) FHA, FSA/RHS & VA B) Conventional C) Refinancings D) Home Improvement Loans F) Non-occupant Loans on Number Average Value Number Average Value Number Average Value Number Average Value Number Average Value
LOANS ORIGINATED 30 $62,360 437 $78,397 179 $56,533 48 $21,071 70 $89,738 APPLICATIONS APPROVED, NOT ACCEPTED 0 $0 69 $59,046 53 $53,272 18 $23,498 7 $39,160 APPLICATIONS DENIED 6 $54,243 179 $52,974 199 $52,963 36 $15,509 15 $40,414 APPLICATIONS WITHDRAWN 5 $63,648 32 $77,298 109 $59,260 8 $36,918 4 $65,358 FILES CLOSED FOR INCOMPLETENESS 3 $71,887 12 $63,100 41 $56,001 0 $0 0 $0
Aggregated Statistics For Year 1999(Based on 4 partial tracts) A) FHA, FSA/RHS & VA B) Conventional C) Refinancings D) Home Improvement Loans F) Non-occupant Loans on Number Average Value Number Average Value Number Average Value Number Average Value Number Average Value
LOANS ORIGINATED 32 $75,942 371 $76,045 240 $60,262 45 $22,086 60 $66,854 APPLICATIONS APPROVED, NOT ACCEPTED 0 $0 50 $65,019 72 $55,054 26 $23,540 12 $68,558 APPLICATIONS DENIED 3 $58,577 129 $53,388 198 $53,578 55 $19,966 21 $56,807 APPLICATIONS WITHDRAWN 1 $35,250 25 $57,244 105 $56,076 10 $35,506 4 $57,738 FILES CLOSED FOR INCOMPLETENESS 0 $0 10 $81,496 38 $60,107 2 $50,685 4 $83,725
Private Mortgage Insurance Companies Aggregated Statistics For Year 2009(Based on 10 partial tracts) A) Conventional B) Refinancings C) Non-occupant Loans on Number Average Value Number Average Value Number Average Value
LOANS ORIGINATED 10 $104,607 3 $129,223 1 $98,600 APPLICATIONS APPROVED, NOT ACCEPTED 7 $190,510 5 $135,942 5 $146,530 APPLICATIONS DENIED 6 $145,570 3 $257,300 1 $138,790 APPLICATIONS WITHDRAWN 4 $112,922 0 $0 0 $0 FILES CLOSED FOR INCOMPLETENESS 2 $159,975 2 $223,015 1 $65,220
Aggregated Statistics For Year 2008(Based on 10 partial tracts) A) Conventional B) Refinancings C) Non-occupant Loans on D) Loans On Manufactured Number Average Value Number Average Value Number Average Value Number Average Value
LOANS ORIGINATED 89 $171,595 37 $210,047 42 $187,840 1 $76,550 APPLICATIONS APPROVED, NOT ACCEPTED 59 $199,021 63 $204,917 48 $203,686 1 $50,130 APPLICATIONS DENIED 18 $150,440 9 $226,620 13 $163,214 1 $70,450 APPLICATIONS WITHDRAWN 9 $165,360 5 $232,596 7 $174,081 0 $0 FILES CLOSED FOR INCOMPLETENESS 3 $200,057 7 $234,964 4 $204,050 0 $0
Aggregated Statistics For Year 2007(Based on 10 partial tracts) A) Conventional B) Refinancings C) Non-occupant Loans on D) Loans On Manufactured Number Average Value Number Average Value Number Average Value Number Average Value
LOANS ORIGINATED 263 $188,929 190 $212,694 232 $209,012 8 $101,042 APPLICATIONS APPROVED, NOT ACCEPTED 54 $195,653 46 $201,404 49 $195,327 1 $98,900 APPLICATIONS DENIED 6 $181,162 15 $223,320 13 $226,987 2 $137,665 APPLICATIONS WITHDRAWN 18 $199,063 20 $232,096 21 $239,314 0 $0 FILES CLOSED FOR INCOMPLETENESS 3 $126,807 3 $197,983 4 $169,368 1 $66,390
Aggregated Statistics For Year 2006(Based on 10 partial tracts) A) Conventional B) Refinancings C) Non-occupant Loans on D) Loans On Manufactured Number Average Value Number Average Value Number Average Value Number Average Value
LOANS ORIGINATED 261 $178,744 61 $188,386 142 $181,260 8 $94,278 APPLICATIONS APPROVED, NOT ACCEPTED 38 $180,037 28 $194,073 30 $192,094 0 $0 APPLICATIONS DENIED 3 $161,260 2 $129,275 1 $182,070 1 $132,770 APPLICATIONS WITHDRAWN 15 $168,612 3 $185,790 7 $156,384 1 $65,980 FILES CLOSED FOR INCOMPLETENESS 1 $315,490 1 $172,790 1 $76,920 0 $0
Aggregated Statistics For Year 2005(Based on 10 partial tracts) A) Conventional B) Refinancings C) Non-occupant Loans on D) Loans On Manufactured Number Average Value Number Average Value Number Average Value Number Average Value
LOANS ORIGINATED 310 $141,694 69 $150,819 167 $138,480 9 $88,393 APPLICATIONS APPROVED, NOT ACCEPTED 50 $158,990 30 $152,572 25 $165,429 2 $67,725 APPLICATIONS DENIED 6 $138,222 6 $182,688 5 $144,972 1 $81,970 APPLICATIONS WITHDRAWN 10 $143,738 3 $134,703 5 $116,430 0 $0 FILES CLOSED FOR INCOMPLETENESS 1 $149,380 0 $0 0 $0 0 $0
Aggregated Statistics For Year 2004(Based on 10 partial tracts) A) Conventional B) Refinancings C) Non-occupant Loans on D) Loans On Manufactured Number Average Value Number Average Value Number Average Value Number Average Value
LOANS ORIGINATED 269 $111,853 69 $130,393 127 $108,453 6 $67,597 APPLICATIONS APPROVED, NOT ACCEPTED 57 $132,859 29 $116,229 33 $133,763 4 $68,228 APPLICATIONS DENIED 10 $119,332 4 $143,418 6 $138,548 1 $158,510 APPLICATIONS WITHDRAWN 13 $121,041 5 $123,356 5 $150,626 1 $38,610 FILES CLOSED FOR INCOMPLETENESS 0 $0 1 $54,290 0 $0 0 $0
Aggregated Statistics For Year 2003(Based on 10 partial tracts) A) Conventional B) Refinancings C) Non-occupant Loans on Number Average Value Number Average Value Number Average Value
LOANS ORIGINATED 222 $94,520 114 $103,552 98 $98,124 APPLICATIONS APPROVED, NOT ACCEPTED 46 $104,286 20 $104,182 20 $121,266 APPLICATIONS DENIED 13 $102,627 9 $104,817 7 $95,834 APPLICATIONS WITHDRAWN 13 $89,285 8 $115,194 4 $130,575 FILES CLOSED FOR INCOMPLETENESS 2 $109,675 0 $0 0 $0
Aggregated Statistics For Year 2002(Based on 6 partial tracts) A) Conventional B) Refinancings C) Non-occupant Loans on Number Average Value Number Average Value Number Average Value
LOANS ORIGINATED 62 $93,956 29 $95,112 13 $92,168 APPLICATIONS APPROVED, NOT ACCEPTED 6 $118,885 4 $119,138 0 $0 APPLICATIONS DENIED 2 $169,805 2 $70,255 0 $0 APPLICATIONS WITHDRAWN 3 $70,070 4 $72,792 1 $18,620 FILES CLOSED FOR INCOMPLETENESS 0 $0 1 $56,220 0 $0
Aggregated Statistics For Year 2001(Based on 6 partial tracts) A) Conventional B) Refinancings C) Non-occupant Loans on Number Average Value Number Average Value Number Average Value
LOANS ORIGINATED 75 $91,474 21 $105,417 20 $99,634 APPLICATIONS APPROVED, NOT ACCEPTED 6 $59,710 1 $165,190 1 $57,190 APPLICATIONS DENIED 1 $71,160 0 $0 0 $0 APPLICATIONS WITHDRAWN 1 $130,340 1 $65,170 0 $0 FILES CLOSED FOR INCOMPLETENESS 0 $0 0 $0 0 $0
Aggregated Statistics For Year 2000(Based on 6 partial tracts) A) Conventional B) Refinancings C) Non-occupant Loans on Number Average Value Number Average Value Number Average Value
LOANS ORIGINATED 53 $76,398 8 $64,606 11 $59,621 APPLICATIONS APPROVED, NOT ACCEPTED 5 $109,408 2 $108,430 1 $100,930 APPLICATIONS DENIED 1 $75,190 0 $0 0 $0 APPLICATIONS WITHDRAWN 3 $120,187 0 $0 0 $0 FILES CLOSED FOR INCOMPLETENESS 0 $0 0 $0 0 $0
Aggregated Statistics For Year 1999(Based on 4 partial tracts) A) Conventional B) Refinancings C) Non-occupant Loans on Number Average Value Number Average Value Number Average Value
LOANS ORIGINATED 57 $82,897 11 $77,619 11 $87,180 APPLICATIONS APPROVED, NOT ACCEPTED 5 $103,860 2 $87,545 0 $0 APPLICATIONS DENIED 2 $43,295 0 $0 0 $0 APPLICATIONS WITHDRAWN 1 $81,650 1 $71,590 0 $0 FILES CLOSED FOR INCOMPLETENESS 1 $65,080 0 $0 0 $0
2005 - 2018 National Fire Incident Reporting System (NFIRS) incidents See full 2006 National Fire Incident Reporting System statistics for zip code 34432, Florida
Most common first names in zip code 34432 among deceased individuals Name Count Lived (average)
John 57 75.8 years Robert 47 75.1 years James 39 71.9 years William 36 76.2 years Charles 34 73.3 years Richard 25 72.3 years Mary 24 81.4 years Joseph 23 76.0 years Edward 23 75.6 years Helen 20 82.3 years
Most common last names in zip code 34432 among deceased individuals Last name Count Lived (average)
Smith 14 71.5 years Jones 13 71.2 years Moore 8 71.0 years Parker 8 76.6 years Johnson 7 77.9 years Miller 7 85.0 years Wilson 7 77.1 years Adams 6 72.8 years Williams 6 67.9 years Davis 5 77.0 years
Businesses in zip code 34432
Name Count Name Count
Ace Hardware 1 McDonald's 2 Advance Auto Parts 1 Pizza Hut 1 Baskin-Robbins 1 Sears 1 CVS 1 Subway 1 Curves 1 U-Haul 1 Dunkin Donuts 1 UPS 4 FedEx 2 Walgreens 1 H&R Block 1 Walmart 1 KFC 1

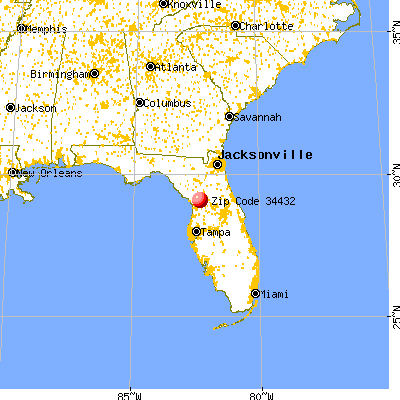


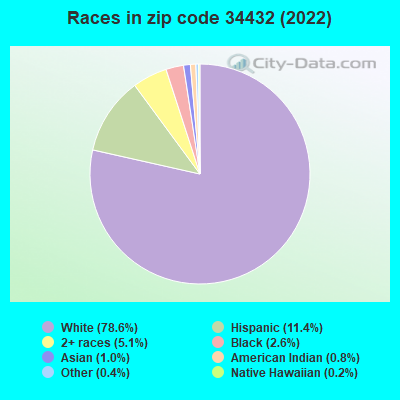


 Nearest zip codes: 34434, 34481, 34445, 34442, 34433, 34431.
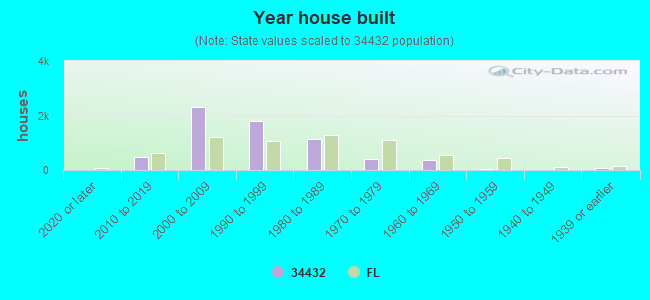

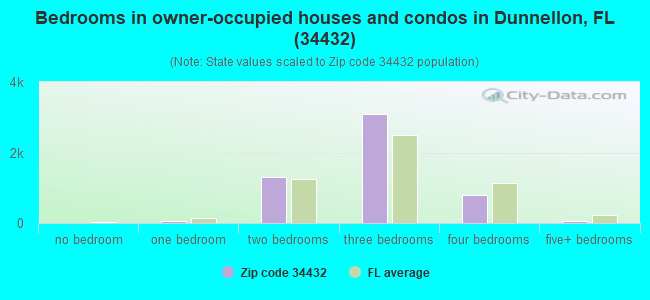
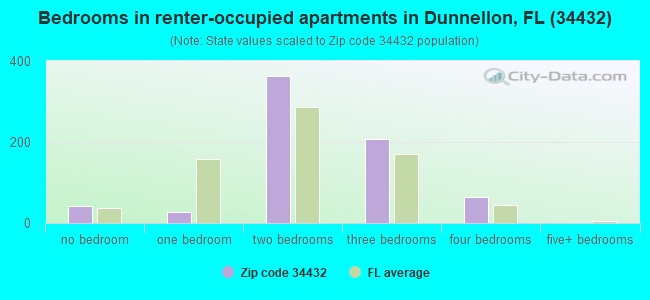
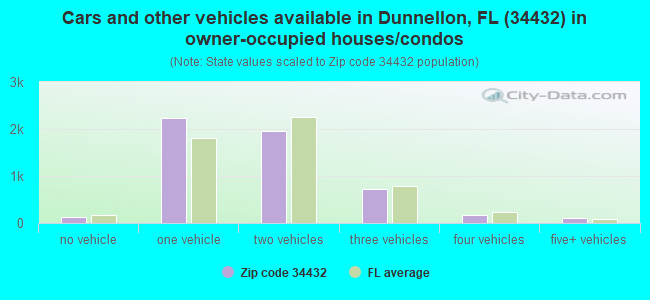
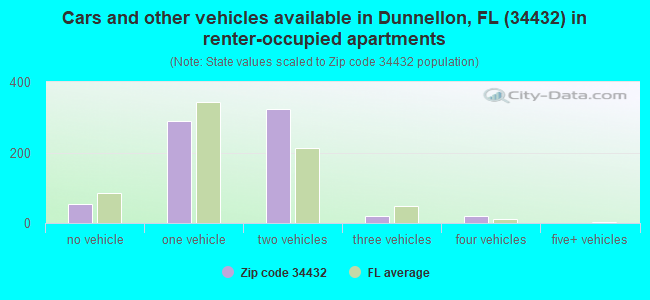


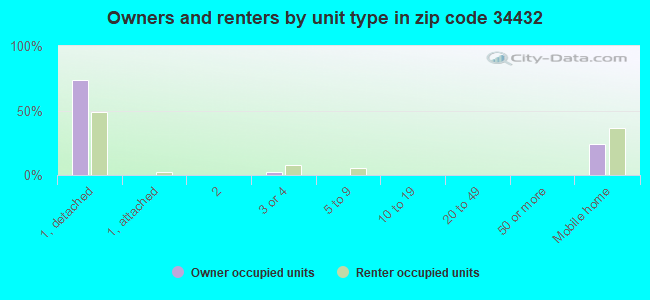


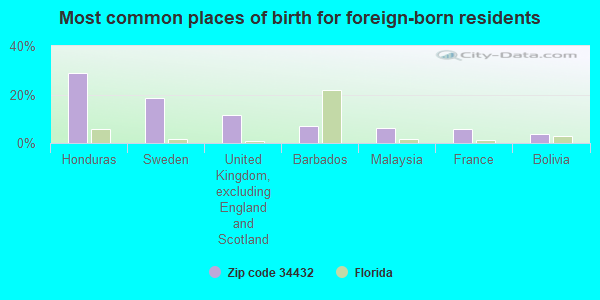
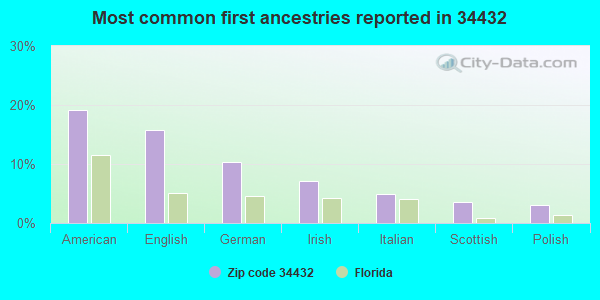
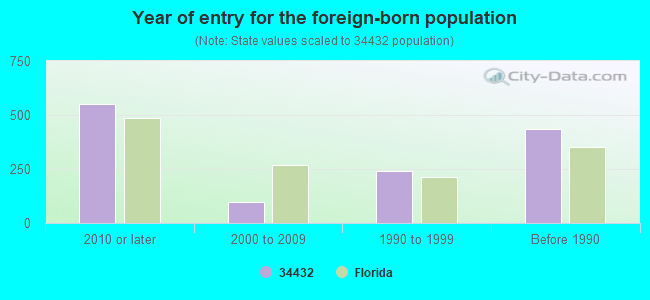
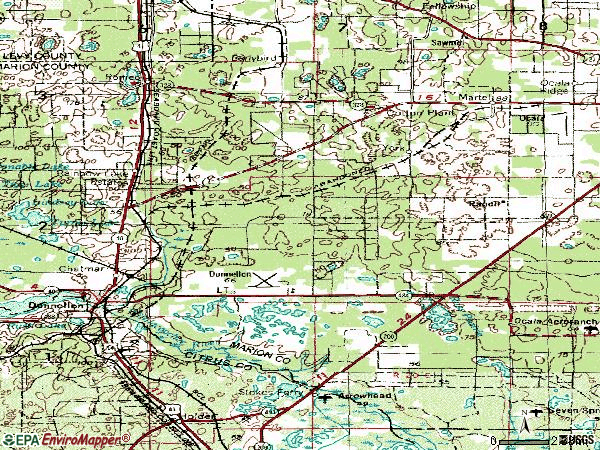


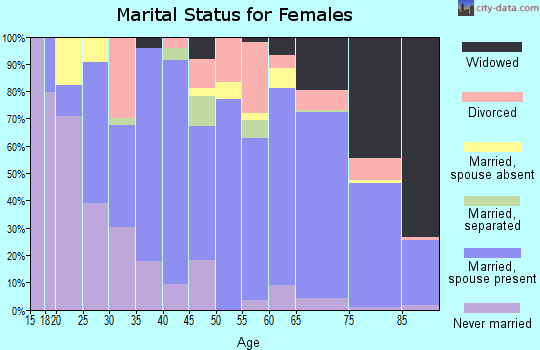
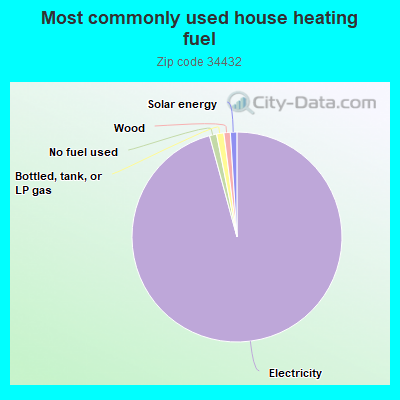
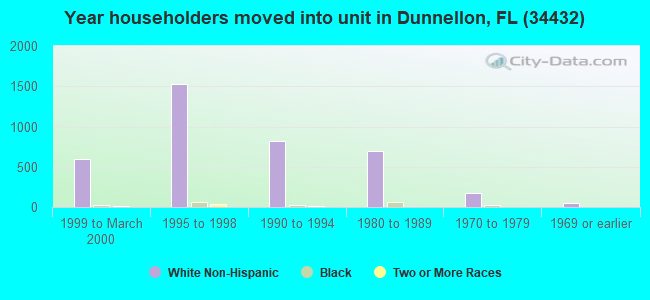
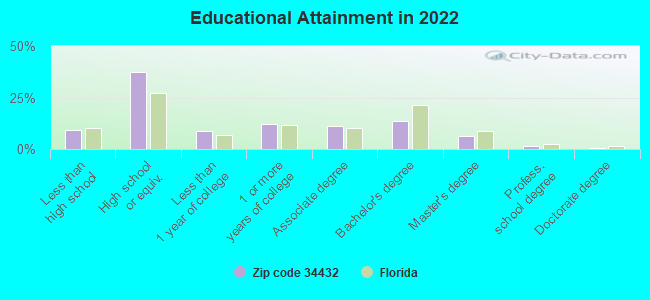
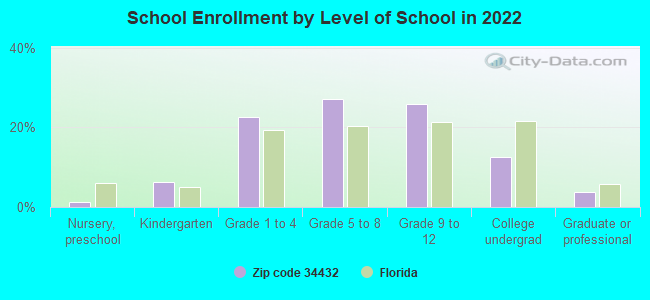
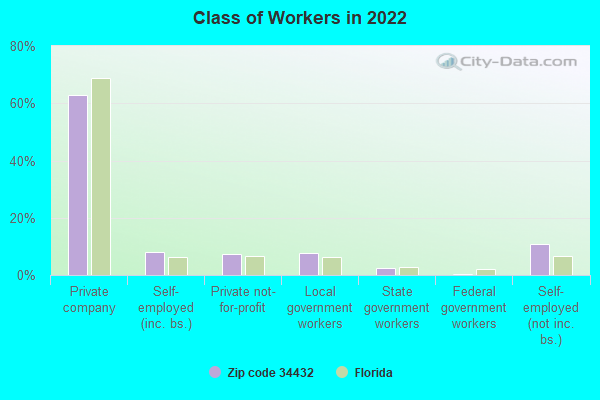
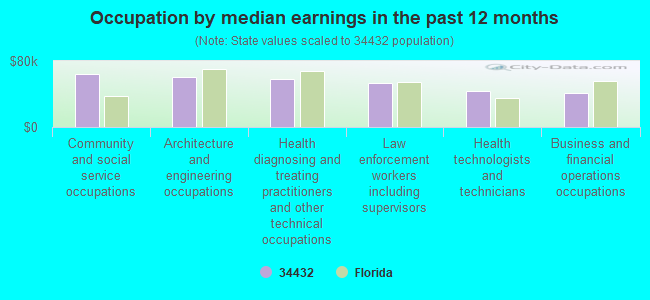
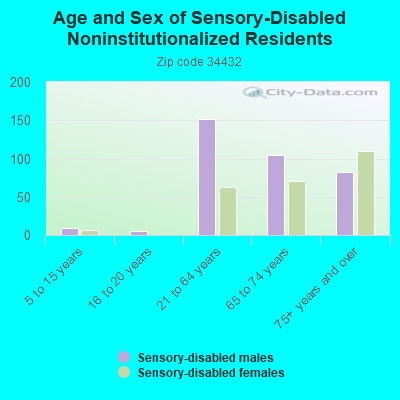
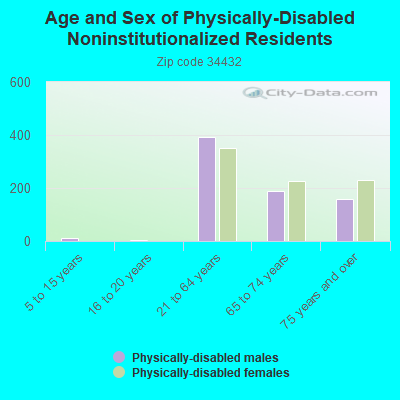
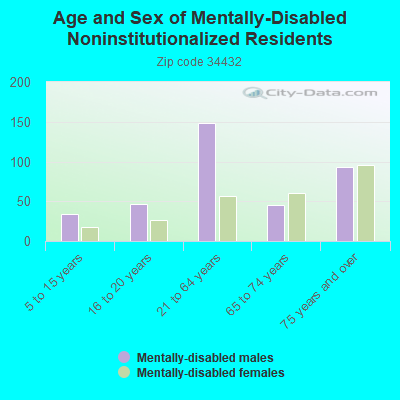
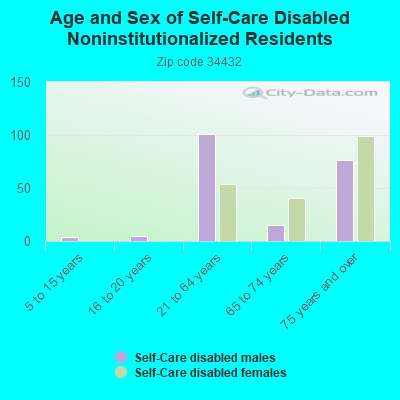
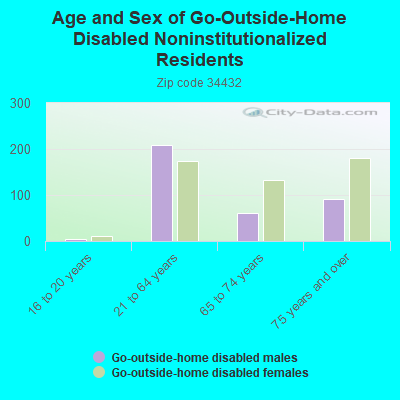
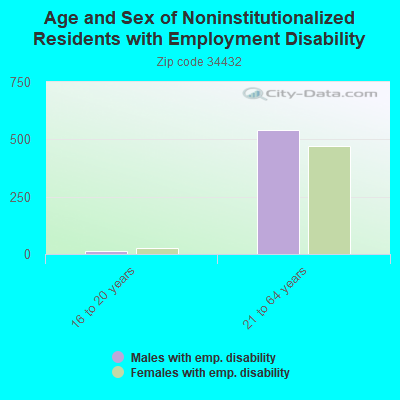
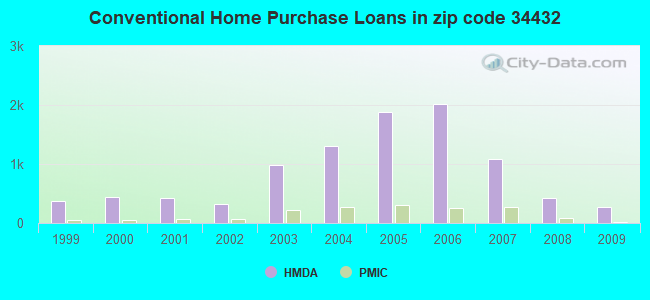
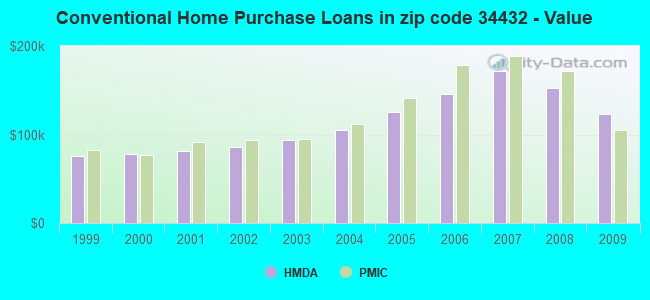
 According to the data from the years 2005 - 2018 the average number of fires per year is 73. The highest number of fires - 115 took place in 2006, and the least - 31 in 2005. The data has a growing trend.
 When looking into fire subcategories, the most reports belonged to: Outside Fires (60.0%), and Structure Fires (23.0%).