Estimated zip code population in 2022: 18,120
Zip code population in 2010: 15,436
Zip code population in 2000: 17,739
Houses and condos: 8,144
Renter-occupied apartments: 4,466
% of renters here:
63%State:
33%
March 2022 cost of living index in zip code 34950: 90.3
(less than average, U.S. average is 100)
Land area: 5.1
sq. mi.
Water area: 1.8
sq. mi.
Population density: 3,538 people per square mile (average).
OSM Map
General Map
Google Map
MSN Map
OSM Map
General Map
Google Map
MSN Map
OSM Map
General Map
Google Map
MSN Map
OSM Map
General Map
Google Map
MSN Map
Please wait while loading the map...
Real estate property taxes paid for housing units in 2022:
This zip code:
0.6% ($1,120)Florida:
0.7% ($2,529)
Median real estate property taxes paid for housing units with mortgages in 2022: $1,575 (0.8%)
Median real estate property taxes paid for housing units with no mortgage in 2022: $878 (0.6%)
Profiles of local businesses
Business Search - 14 Million verified businesses
Males: 8,855 Females: 9,264
For population 25 years and over in 34950:
High school or higher: 66.3%Bachelor's degree or higher: 14.9%Graduate or professional degree: 3.9%Unemployed: 15.1%Mean travel time to work (commute): 25.9 minutes
For population 15 years and over in 34950:
Never married: 46.0%Now married: 30.5%Separated: 2.8%Widowed: 8.0%Divorced: 12.7%
Zip code 34950 compared to state average:
Median household income below state average. Median house value below state average. Unemployed percentage significantly above state average. Black race population percentage significantly above state average. Hispanic race population percentage below state average. Renting percentage above state average. Length of stay since moving in significantly above state average. House age above state average. Number of college students below state average. Percentage of population with a bachelor's degree or higher significantly below state average. 11,922 65.8% Black 3,104 17.1% White 2,812 15.5% Hispanic or Latino 187 1.0% Two or more races 62 0.3% American Indian 29 0.2% Some other race 2 0.01% Asian
Data:
Median household income ($)
Median household income (% change since 2000)
Household income diversity
Ratio of average income to average house value (%)
Ratio of average income to average rent
Median household income ($) - White
Median household income ($) - Black or African American
Median household income ($) - Asian
Median household income ($) - Hispanic or Latino
Median household income ($) - American Indian and Alaska Native
Median household income ($) - Multirace
Median household income ($) - Other Race
Median household income for houses/condos with a mortgage ($)
Median household income for apartments without a mortgage ($)
Races - White alone (%)
Races - White alone (% change since 2000)
Races - Black alone (%)
Races - Black alone (% change since 2000)
Races - American Indian alone (%)
Races - American Indian alone (% change since 2000)
Races - Asian alone (%)
Races - Asian alone (% change since 2000)
Races - Hispanic (%)
Races - Hispanic (% change since 2000)
Races - Native Hawaiian and Other Pacific Islander alone (%)
Races - Native Hawaiian and Other Pacific Islander alone (% change since 2000)
Races - Two or more races (%)
Races - Two or more races (% change since 2000)
Races - Other race alone (%)
Races - Other race alone (% change since 2000)
Racial diversity
Unemployment (%)
Unemployment (% change since 2000)
Unemployment (%) - White
Unemployment (%) - Black or African American
Unemployment (%) - Asian
Unemployment (%) - Hispanic or Latino
Unemployment (%) - American Indian and Alaska Native
Unemployment (%) - Multirace
Unemployment (%) - Other Race
Population density (people per square mile)
Population - Males (%)
Population - Females (%)
Population - Males (%) - White
Population - Males (%) - Black or African American
Population - Males (%) - Asian
Population - Males (%) - Hispanic or Latino
Population - Males (%) - American Indian and Alaska Native
Population - Males (%) - Multirace
Population - Males (%) - Other Race
Population - Females (%) - White
Population - Females (%) - Black or African American
Population - Females (%) - Asian
Population - Females (%) - Hispanic or Latino
Population - Females (%) - American Indian and Alaska Native
Population - Females (%) - Multirace
Population - Females (%) - Other Race
Coronavirus confirmed cases (Apr 27, 2024)
Deaths caused by coronavirus (Apr 27, 2024)
Coronavirus confirmed cases (per 100k population) (Apr 27, 2024)
Deaths caused by coronavirus (per 100k population) (Apr 27, 2024)
Daily increase in number of cases (Apr 27, 2024)
Weekly increase in number of cases (Apr 27, 2024)
Cases doubled (in days) (Apr 27, 2024)
Hospitalized patients (Apr 18, 2022)
Negative test results (Apr 18, 2022)
Total test results (Apr 18, 2022)
COVID Vaccine doses distributed (per 100k population) (Sep 19, 2023)
COVID Vaccine doses administered (per 100k population) (Sep 19, 2023)
COVID Vaccine doses distributed (Sep 19, 2023)
COVID Vaccine doses administered (Sep 19, 2023)
Likely homosexual households (%)
Likely homosexual households (% change since 2000)
Likely homosexual households - Lesbian couples (%)
Likely homosexual households - Lesbian couples (% change since 2000)
Likely homosexual households - Gay men (%)
Likely homosexual households - Gay men (% change since 2000)
Cost of living index
Median gross rent ($)
Median contract rent ($)
Median monthly housing costs ($)
Median house or condo value ($)
Median house or condo value ($ change since 2000)
Mean house or condo value by units in structure - 1, detached ($)
Mean house or condo value by units in structure - 1, attached ($)
Mean house or condo value by units in structure - 2 ($)
Mean house or condo value by units in structure by units in structure - 3 or 4 ($)
Mean house or condo value by units in structure - 5 or more ($)
Mean house or condo value by units in structure - Boat, RV, van, etc. ($)
Mean house or condo value by units in structure - Mobile home ($)
Median house or condo value ($) - White
Median house or condo value ($) - Black or African American
Median house or condo value ($) - Asian
Median house or condo value ($) - Hispanic or Latino
Median house or condo value ($) - American Indian and Alaska Native
Median house or condo value ($) - Multirace
Median house or condo value ($) - Other Race
Median resident age
Resident age diversity
Median resident age - Males
Median resident age - Females
Median resident age - White
Median resident age - Black or African American
Median resident age - Asian
Median resident age - Hispanic or Latino
Median resident age - American Indian and Alaska Native
Median resident age - Multirace
Median resident age - Other Race
Median resident age - Males - White
Median resident age - Males - Black or African American
Median resident age - Males - Asian
Median resident age - Males - Hispanic or Latino
Median resident age - Males - American Indian and Alaska Native
Median resident age - Males - Multirace
Median resident age - Males - Other Race
Median resident age - Females - White
Median resident age - Females - Black or African American
Median resident age - Females - Asian
Median resident age - Females - Hispanic or Latino
Median resident age - Females - American Indian and Alaska Native
Median resident age - Females - Multirace
Median resident age - Females - Other Race
Commute - mean travel time to work (minutes)
Travel time to work - Less than 5 minutes (%)
Travel time to work - Less than 5 minutes (% change since 2000)
Travel time to work - 5 to 9 minutes (%)
Travel time to work - 5 to 9 minutes (% change since 2000)
Travel time to work - 10 to 19 minutes (%)
Travel time to work - 10 to 19 minutes (% change since 2000)
Travel time to work - 20 to 29 minutes (%)
Travel time to work - 20 to 29 minutes (% change since 2000)
Travel time to work - 30 to 39 minutes (%)
Travel time to work - 30 to 39 minutes (% change since 2000)
Travel time to work - 40 to 59 minutes (%)
Travel time to work - 40 to 59 minutes (% change since 2000)
Travel time to work - 60 to 89 minutes (%)
Travel time to work - 60 to 89 minutes (% change since 2000)
Travel time to work - 90 or more minutes (%)
Travel time to work - 90 or more minutes (% change since 2000)
Marital status - Never married (%)
Marital status - Now married (%)
Marital status - Separated (%)
Marital status - Widowed (%)
Marital status - Divorced (%)
Median family income ($)
Median family income (% change since 2000)
Median non-family income ($)
Median non-family income (% change since 2000)
Median per capita income ($)
Median per capita income (% change since 2000)
Median family income ($) - White
Median family income ($) - Black or African American
Median family income ($) - Asian
Median family income ($) - Hispanic or Latino
Median family income ($) - American Indian and Alaska Native
Median family income ($) - Multirace
Median family income ($) - Other Race
Median year house/condo built
Median year apartment built
Year house built - Built 2005 or later (%)
Year house built - Built 2000 to 2004 (%)
Year house built - Built 1990 to 1999 (%)
Year house built - Built 1980 to 1989 (%)
Year house built - Built 1970 to 1979 (%)
Year house built - Built 1960 to 1969 (%)
Year house built - Built 1950 to 1959 (%)
Year house built - Built 1940 to 1949 (%)
Year house built - Built 1939 or earlier (%)
Average household size
Household density (households per square mile)
Average household size - White
Average household size - Black or African American
Average household size - Asian
Average household size - Hispanic or Latino
Average household size - American Indian and Alaska Native
Average household size - Multirace
Average household size - Other Race
Occupied housing units (%)
Vacant housing units (%)
Owner occupied housing units (%)
Renter occupied housing units (%)
Vacancy status - For rent (%)
Vacancy status - For sale only (%)
Vacancy status - Rented or sold, not occupied (%)
Vacancy status - For seasonal, recreational, or occasional use (%)
Vacancy status - For migrant workers (%)
Vacancy status - Other vacant (%)
Residents with income below the poverty level (%)
Residents with income below 50% of the poverty level (%)
Children below poverty level (%)
Poor families by family type - Married-couple family (%)
Poor families by family type - Male, no wife present (%)
Poor families by family type - Female, no husband present (%)
Poverty status for native-born residents (%)
Poverty status for foreign-born residents (%)
Poverty among high school graduates not in families (%)
Poverty among people who did not graduate high school not in families (%)
Residents with income below the poverty level (%) - White
Residents with income below the poverty level (%) - Black or African American
Residents with income below the poverty level (%) - Asian
Residents with income below the poverty level (%) - Hispanic or Latino
Residents with income below the poverty level (%) - American Indian and Alaska Native
Residents with income below the poverty level (%) - Multirace
Residents with income below the poverty level (%) - Other Race
Air pollution - Air Quality Index (AQI)
Air pollution - CO
Air pollution - NO2
Air pollution - SO2
Air pollution - Ozone
Air pollution - PM10
Air pollution - PM25
Air pollution - Pb
Crime - Murders per 100,000 population
Crime - Rapes per 100,000 population
Crime - Robberies per 100,000 population
Crime - Assaults per 100,000 population
Crime - Burglaries per 100,000 population
Crime - Thefts per 100,000 population
Crime - Auto thefts per 100,000 population
Crime - Arson per 100,000 population
Crime - City-data.com crime index
Crime - Violent crime index
Crime - Property crime index
Crime - Murders per 100,000 population (5 year average)
Crime - Rapes per 100,000 population (5 year average)
Crime - Robberies per 100,000 population (5 year average)
Crime - Assaults per 100,000 population (5 year average)
Crime - Burglaries per 100,000 population (5 year average)
Crime - Thefts per 100,000 population (5 year average)
Crime - Auto thefts per 100,000 population (5 year average)
Crime - Arson per 100,000 population (5 year average)
Crime - City-data.com crime index (5 year average)
Crime - Violent crime index (5 year average)
Crime - Property crime index (5 year average)
1996 Presidential Elections Results (%) - Democratic Party (Clinton)
1996 Presidential Elections Results (%) - Republican Party (Dole)
1996 Presidential Elections Results (%) - Other
2000 Presidential Elections Results (%) - Democratic Party (Gore)
2000 Presidential Elections Results (%) - Republican Party (Bush)
2000 Presidential Elections Results (%) - Other
2004 Presidential Elections Results (%) - Democratic Party (Kerry)
2004 Presidential Elections Results (%) - Republican Party (Bush)
2004 Presidential Elections Results (%) - Other
2008 Presidential Elections Results (%) - Democratic Party (Obama)
2008 Presidential Elections Results (%) - Republican Party (McCain)
2008 Presidential Elections Results (%) - Other
2012 Presidential Elections Results (%) - Democratic Party (Obama)
2012 Presidential Elections Results (%) - Republican Party (Romney)
2012 Presidential Elections Results (%) - Other
2016 Presidential Elections Results (%) - Democratic Party (Clinton)
2016 Presidential Elections Results (%) - Republican Party (Trump)
2016 Presidential Elections Results (%) - Other
2020 Presidential Elections Results (%) - Democratic Party (Biden)
2020 Presidential Elections Results (%) - Republican Party (Trump)
2020 Presidential Elections Results (%) - Other
Ancestries Reported - Arab (%)
Ancestries Reported - Czech (%)
Ancestries Reported - Danish (%)
Ancestries Reported - Dutch (%)
Ancestries Reported - English (%)
Ancestries Reported - French (%)
Ancestries Reported - French Canadian (%)
Ancestries Reported - German (%)
Ancestries Reported - Greek (%)
Ancestries Reported - Hungarian (%)
Ancestries Reported - Irish (%)
Ancestries Reported - Italian (%)
Ancestries Reported - Lithuanian (%)
Ancestries Reported - Norwegian (%)
Ancestries Reported - Polish (%)
Ancestries Reported - Portuguese (%)
Ancestries Reported - Russian (%)
Ancestries Reported - Scotch-Irish (%)
Ancestries Reported - Scottish (%)
Ancestries Reported - Slovak (%)
Ancestries Reported - Subsaharan African (%)
Ancestries Reported - Swedish (%)
Ancestries Reported - Swiss (%)
Ancestries Reported - Ukrainian (%)
Ancestries Reported - United States (%)
Ancestries Reported - Welsh (%)
Ancestries Reported - West Indian (%)
Ancestries Reported - Other (%)
Educational Attainment - No schooling completed (%)
Educational Attainment - Less than high school (%)
Educational Attainment - High school or equivalent (%)
Educational Attainment - Less than 1 year of college (%)
Educational Attainment - 1 or more years of college (%)
Educational Attainment - Associate degree (%)
Educational Attainment - Bachelor's degree (%)
Educational Attainment - Master's degree (%)
Educational Attainment - Professional school degree (%)
Educational Attainment - Doctorate degree (%)
School Enrollment - Nursery, preschool (%)
School Enrollment - Kindergarten (%)
School Enrollment - Grade 1 to 4 (%)
School Enrollment - Grade 5 to 8 (%)
School Enrollment - Grade 9 to 12 (%)
School Enrollment - College undergrad (%)
School Enrollment - Graduate or professional (%)
School Enrollment - Not enrolled in school (%)
School enrollment - Public schools (%)
School enrollment - Private schools (%)
School enrollment - Not enrolled (%)
Median number of rooms in houses and condos
Median number of rooms in apartments
Housing units lacking complete plumbing facilities (%)
Housing units lacking complete kitchen facilities (%)
Density of houses
Urban houses (%)
Rural houses (%)
Households with people 60 years and over (%)
Households with people 65 years and over (%)
Households with people 75 years and over (%)
Households with one or more nonrelatives (%)
Households with no nonrelatives (%)
Population in households (%)
Family households (%)
Nonfamily households (%)
Population in families (%)
Family households with own children (%)
Median number of bedrooms in owner occupied houses
Mean number of bedrooms in owner occupied houses
Median number of bedrooms in renter occupied houses
Mean number of bedrooms in renter occupied houses
Median number of vehichles in owner occupied houses
Mean number of vehichles in owner occupied houses
Median number of vehichles in renter occupied houses
Mean number of vehichles in renter occupied houses
Mortgage status - with mortgage (%)
Mortgage status - with second mortgage (%)
Mortgage status - with home equity loan (%)
Mortgage status - with both second mortgage and home equity loan (%)
Mortgage status - without a mortgage (%)
Average family size
Average family size - White
Average family size - Black or African American
Average family size - Asian
Average family size - Hispanic or Latino
Average family size - American Indian and Alaska Native
Average family size - Multirace
Average family size - Other Race
Geographical mobility - Same house 1 year ago (%)
Geographical mobility - Moved within same county (%)
Geographical mobility - Moved from different county within same state (%)
Geographical mobility - Moved from different state (%)
Geographical mobility - Moved from abroad (%)
Place of birth - Born in state of residence (%)
Place of birth - Born in other state (%)
Place of birth - Native, outside of US (%)
Place of birth - Foreign born (%)
Housing units in structures - 1, detached (%)
Housing units in structures - 1, attached (%)
Housing units in structures - 2 (%)
Housing units in structures - 3 or 4 (%)
Housing units in structures - 5 to 9 (%)
Housing units in structures - 10 to 19 (%)
Housing units in structures - 20 to 49 (%)
Housing units in structures - 50 or more (%)
Housing units in structures - Mobile home (%)
Housing units in structures - Boat, RV, van, etc. (%)
House/condo owner moved in on average (years ago)
Renter moved in on average (years ago)
Year householder moved into unit - Moved in 1999 to March 2000 (%)
Year householder moved into unit - Moved in 1995 to 1998 (%)
Year householder moved into unit - Moved in 1990 to 1994 (%)
Year householder moved into unit - Moved in 1980 to 1989 (%)
Year householder moved into unit - Moved in 1970 to 1979 (%)
Year householder moved into unit - Moved in 1969 or earlier (%)
Means of transportation to work - Drove car alone (%)
Means of transportation to work - Carpooled (%)
Means of transportation to work - Public transportation (%)
Means of transportation to work - Bus or trolley bus (%)
Means of transportation to work - Streetcar or trolley car (%)
Means of transportation to work - Subway or elevated (%)
Means of transportation to work - Railroad (%)
Means of transportation to work - Ferryboat (%)
Means of transportation to work - Taxicab (%)
Means of transportation to work - Motorcycle (%)
Means of transportation to work - Bicycle (%)
Means of transportation to work - Walked (%)
Means of transportation to work - Other means (%)
Working at home (%)
Industry diversity
Most Common Industries - Agriculture, forestry, fishing and hunting, and mining (%)
Most Common Industries - Agriculture, forestry, fishing and hunting (%)
Most Common Industries - Mining, quarrying, and oil and gas extraction (%)
Most Common Industries - Construction (%)
Most Common Industries - Manufacturing (%)
Most Common Industries - Wholesale trade (%)
Most Common Industries - Retail trade (%)
Most Common Industries - Transportation and warehousing, and utilities (%)
Most Common Industries - Transportation and warehousing (%)
Most Common Industries - Utilities (%)
Most Common Industries - Information (%)
Most Common Industries - Finance and insurance, and real estate and rental and leasing (%)
Most Common Industries - Finance and insurance (%)
Most Common Industries - Real estate and rental and leasing (%)
Most Common Industries - Professional, scientific, and management, and administrative and waste management services (%)
Most Common Industries - Professional, scientific, and technical services (%)
Most Common Industries - Management of companies and enterprises (%)
Most Common Industries - Administrative and support and waste management services (%)
Most Common Industries - Educational services, and health care and social assistance (%)
Most Common Industries - Educational services (%)
Most Common Industries - Health care and social assistance (%)
Most Common Industries - Arts, entertainment, and recreation, and accommodation and food services (%)
Most Common Industries - Arts, entertainment, and recreation (%)
Most Common Industries - Accommodation and food services (%)
Most Common Industries - Other services, except public administration (%)
Most Common Industries - Public administration (%)
Occupation diversity
Most Common Occupations - Management, business, science, and arts occupations (%)
Most Common Occupations - Management, business, and financial occupations (%)
Most Common Occupations - Management occupations (%)
Most Common Occupations - Business and financial operations occupations (%)
Most Common Occupations - Computer, engineering, and science occupations (%)
Most Common Occupations - Computer and mathematical occupations (%)
Most Common Occupations - Architecture and engineering occupations (%)
Most Common Occupations - Life, physical, and social science occupations (%)
Most Common Occupations - Education, legal, community service, arts, and media occupations (%)
Most Common Occupations - Community and social service occupations (%)
Most Common Occupations - Legal occupations (%)
Most Common Occupations - Education, training, and library occupations (%)
Most Common Occupations - Arts, design, entertainment, sports, and media occupations (%)
Most Common Occupations - Healthcare practitioners and technical occupations (%)
Most Common Occupations - Health diagnosing and treating practitioners and other technical occupations (%)
Most Common Occupations - Health technologists and technicians (%)
Most Common Occupations - Service occupations (%)
Most Common Occupations - Healthcare support occupations (%)
Most Common Occupations - Protective service occupations (%)
Most Common Occupations - Fire fighting and prevention, and other protective service workers including supervisors (%)
Most Common Occupations - Law enforcement workers including supervisors (%)
Most Common Occupations - Food preparation and serving related occupations (%)
Most Common Occupations - Building and grounds cleaning and maintenance occupations (%)
Most Common Occupations - Personal care and service occupations (%)
Most Common Occupations - Sales and office occupations (%)
Most Common Occupations - Sales and related occupations (%)
Most Common Occupations - Office and administrative support occupations (%)
Most Common Occupations - Natural resources, construction, and maintenance occupations (%)
Most Common Occupations - Farming, fishing, and forestry occupations (%)
Most Common Occupations - Construction and extraction occupations (%)
Most Common Occupations - Installation, maintenance, and repair occupations (%)
Most Common Occupations - Production, transportation, and material moving occupations (%)
Most Common Occupations - Production occupations (%)
Most Common Occupations - Transportation occupations (%)
Most Common Occupations - Material moving occupations (%)
People in Group quarters - Institutionalized population (%)
People in Group quarters - Correctional institutions (%)
People in Group quarters - Federal prisons and detention centers (%)
People in Group quarters - Halfway houses (%)
People in Group quarters - Local jails and other confinement facilities (including police lockups) (%)
People in Group quarters - Military disciplinary barracks (%)
People in Group quarters - State prisons (%)
People in Group quarters - Other types of correctional institutions (%)
People in Group quarters - Nursing homes (%)
People in Group quarters - Hospitals/wards, hospices, and schools for the handicapped (%)
People in Group quarters - Hospitals/wards and hospices for chronically ill (%)
People in Group quarters - Hospices or homes for chronically ill (%)
People in Group quarters - Military hospitals or wards for chronically ill (%)
People in Group quarters - Other hospitals or wards for chronically ill (%)
People in Group quarters - Hospitals or wards for drug/alcohol abuse (%)
People in Group quarters - Mental (Psychiatric) hospitals or wards (%)
People in Group quarters - Schools, hospitals, or wards for the mentally retarded (%)
People in Group quarters - Schools, hospitals, or wards for the physically handicapped (%)
People in Group quarters - Institutions for the deaf (%)
People in Group quarters - Institutions for the blind (%)
People in Group quarters - Orthopedic wards and institutions for the physically handicapped (%)
People in Group quarters - Wards in general hospitals for patients who have no usual home elsewhere (%)
People in Group quarters - Wards in military hospitals for patients who have no usual home elsewhere (%)
People in Group quarters - Juvenile institutions (%)
People in Group quarters - Long-term care (%)
People in Group quarters - Homes for abused, dependent, and neglected children (%)
People in Group quarters - Residential treatment centers for emotionally disturbed children (%)
People in Group quarters - Training schools for juvenile delinquents (%)
People in Group quarters - Short-term care, detention or diagnostic centers for delinquent children (%)
People in Group quarters - Type of juvenile institution unknown (%)
People in Group quarters - Noninstitutionalized population (%)
People in Group quarters - College dormitories (includes college quarters off campus) (%)
People in Group quarters - Military quarters (%)
People in Group quarters - On base (%)
People in Group quarters - Barracks, unaccompanied personnel housing (UPH), (Enlisted/Officer), ;and similar group living quarters for military personnel (%)
People in Group quarters - Transient quarters for temporary residents (%)
People in Group quarters - Military ships (%)
People in Group quarters - Group homes (%)
People in Group quarters - Homes or halfway houses for drug/alcohol abuse (%)
People in Group quarters - Homes for the mentally ill (%)
People in Group quarters - Homes for the mentally retarded (%)
People in Group quarters - Homes for the physically handicapped (%)
People in Group quarters - Other group homes (%)
People in Group quarters - Religious group quarters (%)
People in Group quarters - Dormitories (%)
People in Group quarters - Agriculture workers' dormitories on farms (%)
People in Group quarters - Job Corps and vocational training facilities (%)
People in Group quarters - Other workers' dormitories (%)
People in Group quarters - Crews of maritime vessels (%)
People in Group quarters - Other nonhousehold living situations (%)
People in Group quarters - Other noninstitutional group quarters (%)
Residents speaking English at home (%)
Residents speaking English at home - Born in the United States (%)
Residents speaking English at home - Native, born elsewhere (%)
Residents speaking English at home - Foreign born (%)
Residents speaking Spanish at home (%)
Residents speaking Spanish at home - Born in the United States (%)
Residents speaking Spanish at home - Native, born elsewhere (%)
Residents speaking Spanish at home - Foreign born (%)
Residents speaking other language at home (%)
Residents speaking other language at home - Born in the United States (%)
Residents speaking other language at home - Native, born elsewhere (%)
Residents speaking other language at home - Foreign born (%)
Class of Workers - Employee of private company (%)
Class of Workers - Self-employed in own incorporated business (%)
Class of Workers - Private not-for-profit wage and salary workers (%)
Class of Workers - Local government workers (%)
Class of Workers - State government workers (%)
Class of Workers - Federal government workers (%)
Class of Workers - Self-employed workers in own not incorporated business and Unpaid family workers (%)
House heating fuel used in houses and condos - Utility gas (%)
House heating fuel used in houses and condos - Bottled, tank, or LP gas (%)
House heating fuel used in houses and condos - Electricity (%)
House heating fuel used in houses and condos - Fuel oil, kerosene, etc. (%)
House heating fuel used in houses and condos - Coal or coke (%)
House heating fuel used in houses and condos - Wood (%)
House heating fuel used in houses and condos - Solar energy (%)
House heating fuel used in houses and condos - Other fuel (%)
House heating fuel used in houses and condos - No fuel used (%)
House heating fuel used in apartments - Utility gas (%)
House heating fuel used in apartments - Bottled, tank, or LP gas (%)
House heating fuel used in apartments - Electricity (%)
House heating fuel used in apartments - Fuel oil, kerosene, etc. (%)
House heating fuel used in apartments - Coal or coke (%)
House heating fuel used in apartments - Wood (%)
House heating fuel used in apartments - Solar energy (%)
House heating fuel used in apartments - Other fuel (%)
House heating fuel used in apartments - No fuel used (%)
Armed forces status - In Armed Forces (%)
Armed forces status - Civilian (%)
Armed forces status - Civilian - Veteran (%)
Armed forces status - Civilian - Nonveteran (%)
Fatal accidents locations in years 2005-2021
Fatal accidents locations in 2005
Fatal accidents locations in 2006
Fatal accidents locations in 2007
Fatal accidents locations in 2008
Fatal accidents locations in 2009
Fatal accidents locations in 2010
Fatal accidents locations in 2011
Fatal accidents locations in 2012
Fatal accidents locations in 2013
Fatal accidents locations in 2014
Fatal accidents locations in 2015
Fatal accidents locations in 2016
Fatal accidents locations in 2017
Fatal accidents locations in 2018
Fatal accidents locations in 2019
Fatal accidents locations in 2020
Fatal accidents locations in 2021
Alcohol use - People drinking some alcohol every month (%)
Alcohol use - People not drinking at all (%)
Alcohol use - Average days/month drinking alcohol
Alcohol use - Average drinks/week
Alcohol use - Average days/year people drink much
Audiometry - Average condition of hearing (%)
Audiometry - People that can hear a whisper from across a quiet room (%)
Audiometry - People that can hear normal voice from across a quiet room (%)
Audiometry - Ears ringing, roaring, buzzing (%)
Audiometry - Had a job exposure to loud noise (%)
Audiometry - Had off-work exposure to loud noise (%)
Blood Pressure & Cholesterol - Has high blood pressure (%)
Blood Pressure & Cholesterol - Checking blood pressure at home (%)
Blood Pressure & Cholesterol - Frequently checking blood cholesterol (%)
Blood Pressure & Cholesterol - Has high cholesterol level (%)
Consumer Behavior - Money monthly spent on food at supermarket/grocery store
Consumer Behavior - Money monthly spent on food at other stores
Consumer Behavior - Money monthly spent on eating out
Consumer Behavior - Money monthly spent on carryout/delivered foods
Consumer Behavior - Income spent on food at supermarket/grocery store (%)
Consumer Behavior - Income spent on food at other stores (%)
Consumer Behavior - Income spent on eating out (%)
Consumer Behavior - Income spent on carryout/delivered foods (%)
Current Health Status - General health condition (%)
Current Health Status - Blood donors (%)
Current Health Status - Has blood ever tested for HIV virus (%)
Current Health Status - Left-handed people (%)
Dermatology - People using sunscreen (%)
Diabetes - Diabetics (%)
Diabetes - Had a blood test for high blood sugar (%)
Diabetes - People taking insulin (%)
Diet Behavior & Nutrition - Diet health (%)
Diet Behavior & Nutrition - Milk product consumption (# of products/month)
Diet Behavior & Nutrition - Meals not home prepared (#/week)
Diet Behavior & Nutrition - Meals from fast food or pizza place (#/week)
Diet Behavior & Nutrition - Ready-to-eat foods (#/month)
Diet Behavior & Nutrition - Frozen meals/pizza (#/month)
Drug Use - People that ever used marijuana or hashish (%)
Drug Use - Ever used hard drugs (%)
Drug Use - Ever used any form of cocaine (%)
Drug Use - Ever used heroin (%)
Drug Use - Ever used methamphetamine (%)
Health Insurance - People covered by health insurance (%)
Kidney Conditions-Urology - Avg. # of times urinating at night
Medical Conditions - People with asthma (%)
Medical Conditions - People with anemia (%)
Medical Conditions - People with psoriasis (%)
Medical Conditions - People with overweight (%)
Medical Conditions - Elderly people having difficulties in thinking or remembering (%)
Medical Conditions - People who ever received blood transfusion (%)
Medical Conditions - People having trouble seeing even with glass/contacts (%)
Medical Conditions - People with arthritis (%)
Medical Conditions - People with gout (%)
Medical Conditions - People with congestive heart failure (%)
Medical Conditions - People with coronary heart disease (%)
Medical Conditions - People with angina pectoris (%)
Medical Conditions - People who ever had heart attack (%)
Medical Conditions - People who ever had stroke (%)
Medical Conditions - People with emphysema (%)
Medical Conditions - People with thyroid problem (%)
Medical Conditions - People with chronic bronchitis (%)
Medical Conditions - People with any liver condition (%)
Medical Conditions - People who ever had cancer or malignancy (%)
Mental Health - People who have little interest in doing things (%)
Mental Health - People feeling down, depressed, or hopeless (%)
Mental Health - People who have trouble sleeping or sleeping too much (%)
Mental Health - People feeling tired or having little energy (%)
Mental Health - People with poor appetite or overeating (%)
Mental Health - People feeling bad about themself (%)
Mental Health - People who have trouble concentrating on things (%)
Mental Health - People moving or speaking slowly or too fast (%)
Mental Health - People having thoughts they would be better off dead (%)
Oral Health - Average years since last visit a dentist
Oral Health - People embarrassed because of mouth (%)
Oral Health - People with gum disease (%)
Oral Health - General health of teeth and gums (%)
Oral Health - Average days a week using dental floss/device
Oral Health - Average days a week using mouthwash for dental problem
Oral Health - Average number of teeth
Pesticide Use - Households using pesticides to control insects (%)
Pesticide Use - Households using pesticides to kill weeds (%)
Physical Activity - People doing vigorous-intensity work activities (%)
Physical Activity - People doing moderate-intensity work activities (%)
Physical Activity - People walking or bicycling (%)
Physical Activity - People doing vigorous-intensity recreational activities (%)
Physical Activity - People doing moderate-intensity recreational activities (%)
Physical Activity - Average hours a day doing sedentary activities
Physical Activity - Average hours a day watching TV or videos
Physical Activity - Average hours a day using computer
Physical Functioning - People having limitations keeping them from working (%)
Physical Functioning - People limited in amount of work they can do (%)
Physical Functioning - People that need special equipment to walk (%)
Physical Functioning - People experiencing confusion/memory problems (%)
Physical Functioning - People requiring special healthcare equipment (%)
Prescription Medications - Average number of prescription medicines taking
Preventive Aspirin Use - Adults 40+ taking low-dose aspirin (%)
Reproductive Health - Vaginal deliveries (%)
Reproductive Health - Cesarean deliveries (%)
Reproductive Health - Deliveries resulted in a live birth (%)
Reproductive Health - Pregnancies resulted in a delivery (%)
Reproductive Health - Women breastfeeding newborns (%)
Reproductive Health - Women that had a hysterectomy (%)
Reproductive Health - Women that had both ovaries removed (%)
Reproductive Health - Women that have ever taken birth control pills (%)
Reproductive Health - Women taking birth control pills (%)
Reproductive Health - Women that have ever used Depo-Provera or injectables (%)
Reproductive Health - Women that have ever used female hormones (%)
Sexual Behavior - People 18+ that ever had sex (vaginal, anal, or oral) (%)
Sexual Behavior - Males 18+ that ever had vaginal sex with a woman (%)
Sexual Behavior - Males 18+ that ever performed oral sex on a woman (%)
Sexual Behavior - Males 18+ that ever had anal sex with a woman (%)
Sexual Behavior - Males 18+ that ever had any sex with a man (%)
Sexual Behavior - Females 18+ that ever had vaginal sex with a man (%)
Sexual Behavior - Females 18+ that ever performed oral sex on a man (%)
Sexual Behavior - Females 18+ that ever had anal sex with a man (%)
Sexual Behavior - Females 18+ that ever had any kind of sex with a woman (%)
Sexual Behavior - Average age people first had sex
Sexual Behavior - Average number of female sex partners in lifetime (males 18+)
Sexual Behavior - Average number of female vaginal sex partners in lifetime (males 18+)
Sexual Behavior - Average age people first performed oral sex on a woman (18+)
Sexual Behavior - Average number of woman performed oral sex on in lifetime (18+)
Sexual Behavior - Average number of male sex partners in lifetime (males 18+)
Sexual Behavior - Average number of male anal sex partners in lifetime (males 18+)
Sexual Behavior - Average age people first performed oral sex on a man (18+)
Sexual Behavior - Average number of male oral sex partners in lifetime (18+)
Sexual Behavior - People using protection when performing oral sex (%)
Sexual Behavior - Average number of times people have vaginal or anal sex a year
Sexual Behavior - People having sex without condom (%)
Sexual Behavior - Average number of male sex partners in lifetime (females 18+)
Sexual Behavior - Average number of male vaginal sex partners in lifetime (females 18+)
Sexual Behavior - Average number of female sex partners in lifetime (females 18+)
Sexual Behavior - Circumcised males 18+ (%)
Sleep Disorders - Average hours sleeping at night
Sleep Disorders - People that has trouble sleeping (%)
Smoking-Cigarette Use - People smoking cigarettes (%)
Taste & Smell - People 40+ having problems with smell (%)
Taste & Smell - People 40+ having problems with taste (%)
Taste & Smell - People 40+ that ever had wisdom teeth removed (%)
Taste & Smell - People 40+ that ever had tonsils teeth removed (%)
Taste & Smell - People 40+ that ever had a loss of consciousness because of a head injury (%)
Taste & Smell - People 40+ that ever had a broken nose or other serious injury to face or skull (%)
Taste & Smell - People 40+ that ever had two or more sinus infections (%)
Weight - Average height (inches)
Weight - Average weight (pounds)
Weight - Average BMI
Weight - People that are obese (%)
Weight - People that ever were obese (%)
Weight - People trying to lose weight (%)
100%
urban population.
Estimated median house/condo value in 2022: $177,898
34950:
$177,898Florida:
$354,100
Median resident age: This zip code:
39.3 yearsFlorida median age:
42.7 years
Average household size: This zip code:
2.5 peopleFlorida:
2.5 people
Averages for the 2020 tax year for zip code 34950, filed in 2021:
Average Adjusted Gross Income (AGI) in 2020: $31,816 (Individual Income Tax Returns) Here:
$31,816State:
$82,200
Salary/wage: $27,464 (reported on 86.5% of returns )Here:
$27,464State:
$58,347
(% of AGI for various income ranges: 1270.9% for AGIs below $25k , 3739.2% for AGIs $25k-50k , 6436.5% for AGIs $50k-75k , 9550.0% for AGIs $75k-100k , 14833.8% for AGIs $100k-200k ) Taxable interest for individuals: $1,214 (reported on 8.2% of returns )This zip code:
$1,214Florida:
$4,272
(% of AGI for various income ranges: 2.7% for AGIs below $25k , 6.6% for AGIs $25k-50k , 8.5% for AGIs $50k-75k , 40.0% for AGIs $75k-100k , 188.8% for AGIs $100k-200k ) Ordinary dividends: $7,259 (reported on 4.8% of returns )(% of AGI for various income ranges: 5.8% for AGIs below $25k , 12.9% for AGIs $25k-50k , 52.5% for AGIs $50k-75k , 163.3% for AGIs $75k-100k , 653.8% for AGIs $100k-200k ) Net capital gain/loss in AGI: +$12,422 (reported on 4.5% of returns )Here:
+$12,422State:
+$62,983
(% of AGI for various income ranges: 1.3% for AGIs below $25k , 10.6% for AGIs $25k-50k , 41.0% for AGIs $50k-75k , 300.8% for AGIs $75k-100k , 1148.8% for AGIs $100k-200k ) Profit/loss from business: +$5,532 (reported on 19.2% of returns )Here:
+$5,532State:
+$9,719
(% of AGI for various income ranges: 123.1% for AGIs below $25k , 28.1% for AGIs $25k-50k , 180.8% for AGIs $50k-75k , 360.0% for AGIs $75k-100k , 726.2% for AGIs $100k-200k ) Taxable individual retirement arrangement distribution: $13,380 (reported on 2.8% of returns )34950:
$13,380Florida:
$24,823
(% of AGI for various income ranges: 11.7% for AGIs below $25k , 20.0% for AGIs $25k-50k , 57.5% for AGIs $50k-75k , 496.7% for AGIs $75k-100k , 1382.5% for AGIs $100k-200k ) Total itemized deductions: $30,539 (reported on 2.5% of returns )Here:
$30,539State:
$45,393
(% of AGI for various income ranges: 102.5% for AGIs $25k-50k , 357.0% for AGIs $50k-75k , 1087.5% for AGIs $100k-200k ) Charity contributions: $11,215 (reported on 1.8% of returns )Here:
$11,215State:
$20,178
(% of AGI for various income ranges: 22.3% for AGIs $25k-50k , 96.2% for AGIs $50k-75k , 837.5% for AGIs $100k-200k ) Taxes paid: $5,340 (reported on 2.1% of returns )(% of AGI for various income ranges: 15.5% for AGIs $25k-50k , 43.5% for AGIs $50k-75k , 163.8% for AGIs $100k-200k ) Earned income credit: $2,793 (reported on 42.7% of returns )(% of AGI for various income ranges: 197.0% for AGIs below $25k , 111.7% for AGIs $25k-50k ) Percentage of individuals using paid preparers for their 2020 taxes: 92.4%(% for various income ranges: 91.4% for AGIs below $25k , 93.6% for AGIs $25k-50k , 92.5% for AGIs $50k-75k , 94.7% for AGIs $75k-100k , 93.8% for AGIs $100k-200k , 100.0% for AGIs over 200k )
Averages for the 2012 tax year for zip code 34950, filed in 2013:
Average Adjusted Gross Income (AGI) in 2012: $24,453 (Individual Income Tax Returns) Here:
$24,453State:
$60,316
Salary/wage: $21,426 (reported on 87.7% of returns )Here:
$21,426State:
$45,277
(% of AGI for various income ranges: 82.5% for AGIs below $25k , 87.8% for AGIs $25k-50k , 78.6% for AGIs $50k-75k , 69.9% for AGIs $75k-100k , 54.5% for AGIs $100k-200k , 41.3% for AGIs over 200k ) Taxable interest for individuals: $1,975 (reported on 8.9% of returns )This zip code:
$1,975Florida:
$3,587
(% of AGI for various income ranges: 0.4% for AGIs below $25k , 0.5% for AGIs $25k-50k , 0.9% for AGIs $50k-75k , 0.3% for AGIs $75k-100k , 2.5% for AGIs $100k-200k , 1.1% for AGIs over 200k ) Ordinary dividends: $6,179 (reported on 5.3% of returns )(% of AGI for various income ranges: 1.2% for AGIs below $25k , 1.0% for AGIs $25k-50k , 1.3% for AGIs $50k-75k , 1.3% for AGIs $75k-100k , 4.8% for AGIs $100k-200k ) Net capital gain/loss in AGI: +$5,104 (reported on 3.9% of returns )Here:
+$5,104State:
+$33,493
(% of AGI for various income ranges: 4.0% for AGIs $100k-200k , 6.0% for AGIs over 200k ) Profit/loss from business: +$6,625 (reported on 14.7% of returns )Here:
+$6,625State:
+$10,012
(% of AGI for various income ranges: 7.8% for AGIs below $25k , 2.6% for AGIs $50k-75k , 10.7% for AGIs $100k-200k ) Taxable individual retirement arrangement distribution: $11,889 (reported on 3.1% of returns )34950:
$11,889Florida:
$21,544
(% of AGI for various income ranges: 0.8% for AGIs below $25k , 0.7% for AGIs $25k-50k , 4.2% for AGIs $50k-75k , 7.0% for AGIs $100k-200k ) Total itemized deductions: $18,605 (27% of AGI, reported on 8.9% of returns )Here:
$18,605State:
$25,533
Here:
27.0% of AGIState:
18.0% of AGI
(% of AGI for various income ranges: 3.4% for AGIs below $25k , 7.6% for AGIs $25k-50k , 10.4% for AGIs $50k-75k , 9.6% for AGIs $75k-100k , 11.3% for AGIs $100k-200k , 8.6% for AGIs over 200k ) Charity contributions: $5,090 (reported on 6.5% of returns )(% of AGI for various income ranges: 0.3% for AGIs below $25k , 1.3% for AGIs $25k-50k , 1.7% for AGIs $50k-75k , 2.6% for AGIs $75k-100k , 2.2% for AGIs $100k-200k , 3.8% for AGIs over 200k ) Taxes paid: $3,078 (reported on 7.9% of returns )(% of AGI for various income ranges: 0.4% for AGIs below $25k , 0.8% for AGIs $25k-50k , 1.3% for AGIs $50k-75k , 1.5% for AGIs $75k-100k , 2.9% for AGIs $100k-200k , 2.0% for AGIs over 200k ) Earned income credit: $2,787 (reported on 48.4% of returns )(% of AGI for various income ranges: 12.9% for AGIs below $25k , 1.9% for AGIs $25k-50k ) Percentage of individuals using paid preparers for their 2012 taxes: 64.9%(% for various income ranges: 67.3% for AGIs below $25k , 56.6% for AGIs $25k-50k , 59.3% for AGIs $50k-75k , 63.6% for AGIs $75k-100k , 66.7% for AGIs $100k-200k , 100.0% for AGIs over 200k )
Averages for the 2004 tax year for zip code 34950, filed in 2005:
Average Adjusted Gross Income (AGI) in 2004: $26,260 (Individual Income Tax Returns) Here:
$26,260State:
$50,523
Salary/wage: $20,997 (reported on 90.7% of returns )Here:
$20,997State:
$39,563
(% of AGI for various income ranges: 100.3% for AGIs below $10k , 90.0% for AGIs $10k-25k , 87.6% for AGIs $25k-50k , 81.3% for AGIs $50k-75k , 65.1% for AGIs $75k-100k , 31.8% for AGIs over 100k ) Taxable interest for individuals: $2,260 (reported on 13.6% of returns )This zip code:
$2,260Florida:
$3,211
(% of AGI for various income ranges: 1.0% for AGIs below $10k , 0.6% for AGIs $10k-25k , 0.6% for AGIs $25k-50k , 0.6% for AGIs $50k-75k , 3.2% for AGIs $75k-100k , 2.2% for AGIs over 100k ) Taxable dividends: $7,485 (reported on 6.9% of returns )(% of AGI for various income ranges: 1.3% for AGIs below $10k , 0.4% for AGIs $10k-25k , 0.7% for AGIs $25k-50k , 1.3% for AGIs $50k-75k , 4.5% for AGIs $75k-100k , 4.8% for AGIs over 100k ) Net capital gain/loss: +$31,704 (reported on 5.9% of returns )Here:
+$31,704State:
+$27,205
(% of AGI for various income ranges: 0.4% for AGIs below $10k , -0.1% for AGIs $10k-25k , 0.2% for AGIs $25k-50k , 2.8% for AGIs $50k-75k , 4.1% for AGIs $75k-100k , 24.9% for AGIs over 100k ) Profit/loss from business: +$6,074 (reported on 10.1% of returns )Here:
+$6,074State:
+$10,634
(% of AGI for various income ranges: 5.6% for AGIs below $10k , 1.8% for AGIs $10k-25k , 1.3% for AGIs $25k-50k , 1.2% for AGIs $50k-75k , 0.2% for AGIs $75k-100k , 4.1% for AGIs over 100k ) IRA payment deduction: $2,382 (reported on 1.1% of returns )34950:
$2,382Florida:
$3,082
(% of AGI for various income ranges: 0.1% for AGIs $10k-25k , 0.1% for AGIs $25k-50k , 0.2% for AGIs $50k-75k , 0.7% for AGIs $75k-100k ) Total itemized deductions: $20,391 (27% of AGI, reported on 12.8% of returns )Here:
$20,391State:
$20,370
Here:
27.0% of AGIState:
20.7% of AGI
(% of AGI for various income ranges: 4.4% for AGIs below $10k , 8.3% for AGIs $10k-25k , 11.3% for AGIs $25k-50k , 11.5% for AGIs $50k-75k , 14.6% for AGIs $75k-100k , 10.0% for AGIs over 100k ) Charity contributions deductions: $5,360 (6% of AGI, reported on 9.7% of returns )Here:
6.2% of AGIState:
3.8% of AGI
(% of AGI for various income ranges: 0.3% for AGIs below $10k , 0.7% for AGIs $10k-25k , 1.5% for AGIs $25k-50k , 1.9% for AGIs $50k-75k , 3.1% for AGIs $75k-100k , 3.9% for AGIs over 100k ) Total tax: $5,176 (reported on 47.6% of returns )(% of AGI for various income ranges: 2.0% for AGIs below $10k , 2.3% for AGIs $10k-25k , 5.5% for AGIs $25k-50k , 8.9% for AGIs $50k-75k , 11.3% for AGIs $75k-100k , 21.9% for AGIs over 100k ) Earned income credit: $2,080 (reported on 47.8% of returns )Percentage of individuals using paid preparers for their 2004 taxes: 71.0%(% for various income ranges: 69.3% for AGIs below $10k , 75.9% for AGIs $10k-25k , 64.1% for AGIs $25k-50k , 64.5% for AGIs $50k-75k , 61.7% for AGIs $75k-100k , 81.1% for AGIs over 100k )
Estimated median household income in 2022: This zip code:
$31,072Florida:
$69,303
Nearest zip codes: 34949 ,
34947 ,
34981 ,
34946 ,
34982 ,
34983 .
Fort Pierce North Zip Code Map
Percentage of family households: This zip code:
33.9%Florida:
41.2%
Percentage of households with unmarried partners: This zip code:
6.6%Florida:
46.7%
Likely homosexual households (counted as self-reported same-sex unmarried-partner households)
Lesbian couples: 0.0% of all households Gay men: 0.2% of all households
Household received Food Stamps/SNAP in the past 12 months: 3,102Household did not receive Food Stamps/SNAP in the past 12 months: 3,852
Women who had a birth in the past 12 months: 457 (357 now married , 107 unmarried) Women who did not have a birth in the past 12 months: 3,991 (821 now married , 3,166 unmarried)
Housing units in zip code 34950 with a mortgage: 1,206 (53
second mortgage , 19
both second mortgage and home equity loan )
Median monthly owner costs for units with a mortgage: $1,390
Median monthly owner costs for units without a mortgage: $472
Residents with income below the poverty level in 2022:
This zip code:
42.6%Whole state:
12.7%
Residents with income below 50% of the poverty level in 2022:
This zip code:
18.7%Whole state:
6.6%
Median number of rooms in houses and condos: Median number of rooms in apartments: Notable locations in this zip code not listed on our city pages
Click to draw/clear zip code borders Notable locations in zip code 34950: (A) , WIRA (B) , Indian Hills Golf and Country Club (C) , Fontenelle Plaza (D) , The Shops of Fort Pierce (E) , Fort Pierce Inlet Center Range Front Light (F) , Flamingo Lakes Country Club (G) , Saint Lucie County Fire District Station 1- Central Station (H) , Saint Lucie County Fire District Station 15 (I) , Saint Lucie County Sheriff's Office - Civil (J) , Fort Pierce Police Department (K) , Saint Lucie County Law Library Rupert J Smith Library (L) , Saint Lucie County Library System Fort Pierce Branch Library (M) , Saint Lucie County Library System Headquarters (N) . Display/hide their locations on the map
Churches in zip code 34950 include: (A) , Victory Temple of Jesus Christ (B) , Triumph the Church and Kindgom of God in Christ Church (C) , Saint Matthews Missionary Baptist Church (D) , Saint Johns Missionary Baptist Church (E) , New Mount Zion Missionary Baptist Church (F) , Mount Pleasant Primitive Baptist Church (G) , Mount Olive Missionary Baptist Church (H) , Full Gospel Church of Deliverance (I) . Display/hide their locations on the map
Cemeteries: (1) , Garden of Heavenly Rest (2) , Fort Pierce Cemetery (3) . Display/hide their locations on the map
Creek: (A) . Display/hide its location on the map
Year house built (houses)
0 2020 or later251 2010 to 2019299 2000 to 2009302 1990 to 19991,740 1980 to 19891,584 1970 to 19791,074 1960 to 19691,360 1950 to 1959412 1940 to 1949765 1939 or earlier
Zip code 34950 household income distribution in 2022 1,431 Less than $10,000717 $10,000 to $14,999590 $15,000 to $19,999420 $20,000 to $24,999352 $25,000 to $29,999256 $30,000 to $34,999319 $35,000 to $39,999282 $40,000 to $44,999232 $45,000 to $49,999675 $50,000 to $59,9991,063 $60,000 to $74,999331 $75,000 to $99,999109 $100,000 to $124,999121 $125,000 to $149,99926 $150,000 to $199,999127 $200,000 or moreEstimate of home value of owner-occupied houses/condos in 2022 in zip code 34950 12 $20,000 to $24,99920 $25,000 to $29,99979 $30,000 to $34,99935 $40,000 to $49,99917 $50,000 to $59,999134 $60,000 to $69,99961 $70,000 to $79,99978 $80,000 to $89,999178 $90,000 to $99,999181 $100,000 to $124,999147 $125,000 to $149,999157 $150,000 to $174,999180 $175,000 to $199,999294 $200,000 to $249,99972 $250,000 to $299,999188 $300,000 to $399,99938 $400,000 to $499,99938 $500,000 to $749,99938 $750,000 to $999,99941 $1,000,000 to $1,499,999Rent paid by renters in 2022 in zip code 34950 35 Less than $100132 $100 to $14936 $150 to $199132 $200 to $24994 $250 to $29937 $300 to $34936 $350 to $399240 $400 to $44955 $450 to $499149 $500 to $549121 $550 to $599382 $600 to $64977 $650 to $699196 $700 to $749223 $750 to $799448 $800 to $899698 $900 to $999412 $1,000 to $1,249218 $1,250 to $1,49965 $1,500 to $1,999167 $2,000 to $2,49959 No cash rent
Median gross rent in 2022: $1,099.
Median price asked for vacant for-sale houses and condos in 2022: $339,435.
Estimated median house (or condo) value in 2022 for: White Non-Hispanic householders: $202,634Black or African American householders: $164,344American Indian or Alaska Native householders: $220,255Asian householders: $186,369Some other race householders: $210,428Two or more races householders: $215,511Hispanic or Latino householders: $194,163Estimated median house or condo value in 2022: $177,898
34950:
$177,898Florida:
$354,100
Lower value quartile - upper value quartile: $115,451 - $254,958
Mean price in 2022: Detached houses: $206,611Here:
$206,611State:
$500,941
Townhouses or other attached units: $231,877Here:
$231,877State:
$370,869
In 2-unit structures: $176,579Here:
$176,579State:
$423,188
In 3-to-4-unit structures: $197,240Here:
$197,240State:
$309,944
In 5-or-more-unit structures: $226,232Here:
$226,232State:
$447,145
Mobile homes: $264,298Here:
$264,298State:
$113,202
Housing units in structures:
One, detached: 3,527One, attached: 544Two: 1,2963 or 4: 8675 to 9: 97210 to 19: 27220 to 49: 16650 or more: 479Mobile homes: 63Unemployment : 15.1%
Means of transportation to work in zip code 34950 61.7% 3,519 Drove a car alone15.6% 888 Carpooled1.7% 98 Bus or trolley bus0.4% 24 Taxi0.1% 4 Motorcycle1.9% 108 Bicycle6.2% 355 Walked0.9% 52 Other means10.0% 573 Worked at homeTravel time to work (commute) in zip code 34950 105 Less than 5 minutes327 5 to 9 minutes996 10 to 14 minutes1,157 15 to 19 minutes492 20 to 24 minutes99 25 to 29 minutes870 30 to 34 minutes149 35 to 39 minutes124 40 to 44 minutes368 45 to 59 minutes171 60 to 89 minutes156 90 or more minutes
Percentage of zip code residents living and working in this county: 79.0%
Household type by relationship:
Households: 18,120
Male householders: 2,775 (1,332 living alone ), Female householders: 4,345 (1,513 living alone )1,720 spouses (1,685 opposite-sex spouses ), 243 unmarried partners , (227 opposite-sex unmarried partners ), 4,961 children (4,708 natural , 85 adopted , 170 stepchildren ), 746 grandchildren , 197 brothers or sisters , 329 parents , 0 foster children , 1,211 other relatives , 1,085 non-relatives In group quarters: 373 (-1 institutionalized population )
Size of family households: 1,646 2-persons , 1,072 3-persons , 458 4-persons , 279 5-persons , 113 6-persons , 229 7-or-more-persons
Size of nonfamily households: 2,844 1-person , 371 2-persons , 95 3-persons
1,131 married couples with children. single-parent households (288 men , 1,611 women ).
73.7% of residents of 34950 zip code speak English at home. of residents speak Spanish at home (67% very well, 14% well, 15% not well, 4% not at all ).of residents speak other Indo-European language at home (31% very well, 16% well, 19% not well, 34% not at all ).of residents speak Asian or Pacific Island language at home (100% very well ).of residents speak other language at home (97% very well, 3% well ).
Foreign born population: 3,418 (18.9%)
(36.6%
of them are naturalized citizens )
This zip code:
18.9%Whole state:
21.7%
56% Grenada 9% Honduras 8% Haiti 4% El Salvador 3% Brazil 3% Guyana 3% Barbados 33% American 17% Haitian 2% Irish 2% Jamaican 1% African 1% English 1% German
Year of entry for the foreign-born population
2,104 2010 or later 540 2000 to 2009 668 1990 to 1999 696 Before 1990
There are
256 Other Medical Specialists in Zip Code 34950.
Major facilities with environmental interests located in this zip code:
LAWNWOOD ELEMENTARY SCHOOL (1900 S 23RD ST in FT. PIERCE, FL)
(Geographic Names Information System) (National Center for Education Statistics) - STATE ID-0061 Organizations: ST. LUCIE COUNTY SCHOOL DISTRICT (SCHOOL DISTRICT)
DAN MCCARTY MIDDLE SCHOOL (1201 MISSISSIPPI AVE in FT. PIERCE, FL)
(Geographic Names Information System) (National Center for Education Statistics) - STATE ID-0072 Organizations: ST. LUCIE COUNTY SCHOOL DISTRICT (SCHOOL DISTRICT)
CIRCLE K #4386 IN FT. PIERCE ( (1624 DELAWARE AVE in FORT PIERCE, FL)
National Pollutant Discharge Elimination System NON-MAJOR (Tracking pollutant discharge elimination systems) - permit (Resource Conservation and Recovery Act (tracking hazardous waste)) Business SIC classification: GASOLINE SERVICE STATIONSOrganizations: STEVE BELIN (CONTACT/OWNER)
, STEVE BELIN, COMPLIANCE MGR (CONTACT/OWNER)
DALE CASSENS EDUCATIONAL CENTER (1905 S 11TH ST in FORT PIERCE, FL)
(National Center for Education Statistics) - STATE ID-0321 Organizations: ST. LUCIE COUNTY SCHOOL DISTRICT (SCHOOL DISTRICT)
HOMEBOUND PROGRAM (1901 SOUTH 11TH STREET in FT. PIERCE, FL)
(National Center for Education Statistics) - STATE ID-5011 Organizations: ST. LUCIE COUNTY SCHOOL DISTRICT (SCHOOL DISTRICT)
LINCOLN PARK ACADEMY (1806 AVE I in FT. PIERCE, FL)
(National Center for Education Statistics) - STATE ID-0121 Organizations: ST. LUCIE COUNTY SCHOOL DISTRICT (SCHOOL DISTRICT)
LOOK OF CLASS CLEANERS (129 N 5TH ST in FORT PIERCE, FL)
AIR MINOR (AIRS/AFS) (Resource Conservation and Recovery Act (tracking hazardous waste)) Business SIC classification: DRYCLEANING PLANTS, EXCEPT RUG CLEANINGOrganizations: ANGELIQUE ROEBER, MGR (CONTACT/OWNER)
Alternative names: LOOK UP CLASS CLEANERS
H D KING POWER PLANT (311 NORTH INDIAN RIVER DRIVE in FORT PIERCE, FL)
AIR MAJOR (AIRS/AFS) AIR PROGRAM (Clean Air Markets Division Business System) CRITERIA AND HAZARDOUS AIR POLLUTANT INVENTORY (Inventory of air pollution sources) National Pollutant Discharge Elimination System MAJOR (Tracking pollutant discharge elimination systems) - permit TRI REPORTER (Tracking of toxic chemicals releasing facilities) Business SIC classification: ELECTRIC SERVICESOrganizations: ELIE BOUDREAUX (CONTACT/OWNER)
, FORT PIERCE UTILITIES AUTHORITY (OWNER/OPERATOR)
Alternative names: FT PIERCE - KING, FT PIERCE UTILITIES AUTHORITY, H.D. KING GENERATING PLANT, HENRY D KING
PALMDALE OIL COMPANY (911 NORTH 2ND STREET in FT. PIERCE, FL)
(Integrated Compliance Information System) - ICIS-04-2004-7005, FORMAL ENFORCEMENT ACTION
CRACKER BOY BOAT WORKS INC (1602 N 2ND ST in FORT PIERCE, FL)
National Pollutant Discharge Elimination System NON-MAJOR (Tracking pollutant discharge elimination systems) - permit (Resource Conservation and Recovery Act (tracking hazardous waste)) Business SIC classification: BOAT BUILDING AND REPAIRINGBusiness NAICS classification: BOAT BUILDING.Organizations: MARTIN MURPHY (CONTACT/OWNER)
PORT SALERNO CLEANERS (131 N 3RD ST in FORT PIERCE, FL)
(Resource Conservation and Recovery Act (tracking hazardous waste)) Small Quantity Generators, between 100 kg and 1000 kg of hazardous waste/month (Resource Conservation and Recovery Act (tracking hazardous waste)) - notification Organizations: ROBERT TIERNAN (CONTACT/OWNER)
, ROBERT TIERNAN, PRESIDENT (CONTACT/OWNER)
LAWNWOOD REGIONAL MEDICAL CENT (1700 S 23RD ST in FORT PIERCE, FL)
National Pollutant Discharge Elimination System NON-MAJOR (Tracking pollutant discharge elimination systems) - permit Small Quantity Generators, between 100 kg and 1000 kg of hazardous waste/month (Resource Conservation and Recovery Act (tracking hazardous waste)) Organizations: LAWNWOOD MEDICAL CENTER INC (CONTACT/OWNER)
, THOMAS PENTZ (CONTACT/OWNER)
Housing units lacking complete plumbing facilities: 2.0%
Housing units lacking complete kitchen facilities: 3.8%
96.3% Electricity 1.5% Utility gas 1.2% No fuel used 1.0% Bottled, tank, or LP gas
Population in 1990: 19,708.
Place of birth for U.S.-born residents:
This state: 9,297Northeast: 1,685Midwest: 624South: 2,381West: 209
53% of the 34950 zip code residents lived in the same house 5 years ago.
Out of people who lived in different houses, 76% lived in this county.
Out of people who lived in different counties, 50% lived in Florida.
90% of the 34950 zip code residents lived in the same house 1 year ago.
Out of people who lived in different houses, 36% moved from this county.
Out of people who lived in different houses, 42% moved from different county within same state.
Out of people who lived in different houses, 22% moved from different state.
Private vs. public school enrollment:
Students in private schools in grades 1 to 8 (elementary and middle school): 38
Students in private schools in grades 9 to 12 (high school): 61
Students in private undergraduate colleges: 67
Occupation by median earnings in the past 12 months ($)
60,885 Health diagnosing and treating practitioners and other technical occupations 53,822 Business and financial operations occupations 48,844 Education, training, and library occupations 42,470 Installation, maintenance, and repair occupations 41,593 Construction and extraction occupations 39,868 Health technologists and technicians
Companies with federal contracts located in this zip code:
ST LUCIE OUTBOARD MARINE INC (1811 S US HWY 1 in FORT PIERCE, FL; small business)
$3,983 with Navy for Engine Cooling System Components, Nonaircraft. Signed on 2005-02-08. Completion date: 2005-02-22.
Top industries in this zip code by the number of employees in 2005:
Health Care and Social Assistance: General Medical and Surgical Hospitals (over 1000 employees: 1 establishment, 1-4 employees: 1 establishment)Utilities: Nuclear Electric Power Generation (500-999: 1)Finance and Insurance: Commercial Banking (250-499: 1, 50-99: 2, 20-49: 1, 10-19: 2, 5-9: 1)Health Care and Social Assistance: Offices of Physicians (except Mental Health Specialists) (20-49: 3, 10-19: 7, 5-9: 17, 1-4: 31)Accommodation and Food Services: Limited-Service Restaurants (50-99: 3, 20-49: 4, 5-9: 4, 1-4: 4)Administrative and Support and Waste Management and Remediation Services: Temporary Help Services (100-249: 2, 5-9: 1)Accommodation and Food Services: Full-Service Restaurants (50-99: 2, 20-49: 2, 10-19: 1, 5-9: 7, 1-4: 7)Finance and Insurance: Savings Institutions (50-99: 2, 20-49: 2)Professional, Scientific, and Technical Services: Offices of Lawyers (10-19: 4, 5-9: 8, 1-4: 37)
People in group quarters in 2010:
149 people in nursing facilities/skilled-nursing facilities
45 people in residential treatment centers for adults
31 people in other noninstitutional facilities
12 people in emergency and transitional shelters (with sleeping facilities) for people experiencing homelessness
8 people in correctional residential facilities
8 people in group homes intended for adults
People in group quarters in 2000:
220 people in other noninstitutional group quarters
17 people in homes or halfway houses for drug/alcohol abuse
13 people in other group homes
12 people in homes for the mentally ill
8 people in mental (psychiatric) hospitals or wards
5 people in agriculture workers' dormitories on farms
4 people in military ships
Fatal accident statistics in 2014:
Fatal accident count: 1Vehicles involved in fatal accidents: 1Fatal accidents caused by drunken drivers: 0Fatalities: 1Persons involved in fatal accidents: 1Pedestrians involved in fatal accidents: 1
Fatal accident statistics in 2013:
Fatal accident count: 1Vehicles involved in fatal accidents: 1Fatal accidents caused by drunken drivers: 1Fatalities: 1Persons involved in fatal accidents: 1Pedestrians involved in fatal accidents: 0
Home Mortgage Disclosure Act Aggregated Statistics For Year 2009(Based on 1 full and 8 partial tracts) A) FHA, FSA/RHS & VA B) Conventional C) Refinancings D) Home Improvement Loans F) Non-occupant Loans on G) Loans On Manufactured Number Average Value Number Average Value Number Average Value Number Average Value Number Average Value Number Average Value
LOANS ORIGINATED 14 $65,874 13 $53,538 29 $89,954 4 $4,995 5 $58,282 0 $0 APPLICATIONS APPROVED, NOT ACCEPTED 0 $0 3 $82,750 7 $106,297 1 $27,170 3 $53,330 0 $0 APPLICATIONS DENIED 7 $60,930 13 $37,247 40 $70,754 24 $19,972 19 $47,264 1 $9,030 APPLICATIONS WITHDRAWN 3 $89,763 2 $54,005 10 $119,029 3 $34,263 2 $47,420 0 $0 FILES CLOSED FOR INCOMPLETENESS 0 $0 1 $196,490 5 $108,028 1 $39,780 1 $196,490 0 $0
Aggregated Statistics For Year 2008(Based on 1 full and 8 partial tracts) A) FHA, FSA/RHS & VA B) Conventional C) Refinancings D) Home Improvement Loans E) Loans on Dwellings For 5+ Families F) Non-occupant Loans on Number Average Value Number Average Value Number Average Value Number Average Value Number Average Value Number Average Value
LOANS ORIGINATED 19 $93,963 45 $106,715 88 $92,129 25 $32,165 2 $498,000 32 $94,804 APPLICATIONS APPROVED, NOT ACCEPTED 1 $106,960 14 $76,516 25 $80,177 10 $88,845 0 $0 12 $81,301 APPLICATIONS DENIED 8 $109,328 29 $116,310 176 $103,238 37 $50,242 0 $0 63 $80,966 APPLICATIONS WITHDRAWN 2 $57,800 6 $215,432 19 $115,188 4 $96,800 0 $0 4 $142,420 FILES CLOSED FOR INCOMPLETENESS 1 $131,500 3 $75,733 18 $97,526 0 $0 0 $0 2 $76,440
Aggregated Statistics For Year 2007(Based on 1 full and 8 partial tracts) A) FHA, FSA/RHS & VA B) Conventional C) Refinancings D) Home Improvement Loans E) Loans on Dwellings For 5+ Families F) Non-occupant Loans on G) Loans On Manufactured Number Average Value Number Average Value Number Average Value Number Average Value Number Average Value Number Average Value Number Average Value
LOANS ORIGINATED 8 $122,206 157 $109,780 292 $115,333 40 $54,072 6 $2,027,875 177 $103,052 3 $25,777 APPLICATIONS APPROVED, NOT ACCEPTED 0 $0 23 $110,669 99 $117,309 13 $193,880 2 $1,794,305 31 $168,072 0 $0 APPLICATIONS DENIED 2 $102,165 109 $113,711 462 $123,307 76 $60,601 7 $100,429 171 $121,939 0 $0 APPLICATIONS WITHDRAWN 3 $145,027 50 $121,262 183 $116,173 12 $117,157 8 $73,565 39 $132,458 0 $0 FILES CLOSED FOR INCOMPLETENESS 1 $103,430 12 $253,347 26 $136,654 3 $192,273 0 $0 10 $140,455 0 $0
Aggregated Statistics For Year 2006(Based on 1 full and 8 partial tracts) A) FHA, FSA/RHS & VA B) Conventional C) Refinancings D) Home Improvement Loans E) Loans on Dwellings For 5+ Families F) Non-occupant Loans on G) Loans On Manufactured Number Average Value Number Average Value Number Average Value Number Average Value Number Average Value Number Average Value Number Average Value
LOANS ORIGINATED 8 $161,288 340 $109,246 511 $111,001 103 $74,119 6 $733,363 316 $105,697 2 $102,330 APPLICATIONS APPROVED, NOT ACCEPTED 0 $0 81 $110,946 116 $112,842 22 $56,922 1 $288,000 78 $109,456 1 $88,400 APPLICATIONS DENIED 0 $0 246 $105,768 389 $115,731 74 $56,630 0 $0 199 $111,136 7 $37,853 APPLICATIONS WITHDRAWN 0 $0 70 $128,982 268 $109,188 25 $91,012 2 $1,227,590 53 $108,458 0 $0 FILES CLOSED FOR INCOMPLETENESS 0 $0 38 $117,524 69 $114,609 2 $56,220 1 $2,151,860 28 $110,794 0 $0
Aggregated Statistics For Year 2005(Based on 1 full and 8 partial tracts) A) FHA, FSA/RHS & VA B) Conventional C) Refinancings D) Home Improvement Loans E) Loans on Dwellings For 5+ Families F) Non-occupant Loans on G) Loans On Manufactured Number Average Value Number Average Value Number Average Value Number Average Value Number Average Value Number Average Value Number Average Value
LOANS ORIGINATED 7 $121,364 450 $97,774 443 $102,528 67 $58,163 6 $1,058,628 322 $95,233 2 $91,420 APPLICATIONS APPROVED, NOT ACCEPTED 1 $155,410 74 $96,356 90 $96,474 11 $54,133 0 $0 52 $102,082 0 $0 APPLICATIONS DENIED 5 $138,796 195 $103,514 333 $93,028 73 $59,981 3 $326,667 126 $93,227 4 $52,902 APPLICATIONS WITHDRAWN 0 $0 112 $123,205 252 $103,981 25 $93,532 1 $527,000 85 $130,227 0 $0 FILES CLOSED FOR INCOMPLETENESS 1 $78,680 30 $75,843 48 $110,817 0 $0 0 $0 22 $77,247 0 $0
Aggregated Statistics For Year 2004(Based on 1 full and 8 partial tracts) A) FHA, FSA/RHS & VA B) Conventional C) Refinancings D) Home Improvement Loans E) Loans on Dwellings For 5+ Families F) Non-occupant Loans on G) Loans On Manufactured Number Average Value Number Average Value Number Average Value Number Average Value Number Average Value Number Average Value Number Average Value
LOANS ORIGINATED 14 $101,843 330 $86,180 306 $79,298 62 $43,671 8 $407,276 265 $78,851 2 $33,400 APPLICATIONS APPROVED, NOT ACCEPTED 1 $103,250 94 $90,026 107 $70,912 11 $41,119 1 $162,660 88 $72,318 1 $19,450 APPLICATIONS DENIED 3 $85,257 148 $85,403 293 $74,459 80 $35,096 1 $161,770 105 $74,314 1 $166,830 APPLICATIONS WITHDRAWN 0 $0 65 $90,348 148 $86,537 15 $47,555 0 $0 39 $81,643 1 $163,540 FILES CLOSED FOR INCOMPLETENESS 0 $0 14 $88,780 76 $102,725 1 $61,790 0 $0 10 $76,856 0 $0
Aggregated Statistics For Year 2003(Based on 1 full and 8 partial tracts) A) FHA, FSA/RHS & VA B) Conventional C) Refinancings D) Home Improvement Loans E) Loans on Dwellings For 5+ Families F) Non-occupant Loans on Number Average Value Number Average Value Number Average Value Number Average Value Number Average Value Number Average Value
LOANS ORIGINATED 21 $81,701 246 $70,427 326 $68,898 38 $20,829 6 $475,243 155 $60,656 APPLICATIONS APPROVED, NOT ACCEPTED 0 $0 39 $77,626 84 $68,914 5 $6,554 0 $0 21 $71,239 APPLICATIONS DENIED 7 $60,830 78 $70,007 331 $68,897 57 $15,278 0 $0 63 $56,671 APPLICATIONS WITHDRAWN 3 $77,217 46 $58,220 125 $70,163 4 $23,078 4 $1,047,098 38 $50,794 FILES CLOSED FOR INCOMPLETENESS 3 $70,313 13 $54,703 39 $86,108 0 $0 0 $0 12 $52,012
Aggregated Statistics For Year 2002(Based on 1 full and 8 partial tracts) A) FHA, FSA/RHS & VA B) Conventional C) Refinancings D) Home Improvement Loans E) Loans on Dwellings For 5+ Families F) Non-occupant Loans on Number Average Value Number Average Value Number Average Value Number Average Value Number Average Value Number Average Value
LOANS ORIGINATED 36 $64,071 240 $63,522 214 $56,452 34 $14,886 0 $0 154 $51,144 APPLICATIONS APPROVED, NOT ACCEPTED 0 $0 32 $64,582 62 $49,696 6 $29,030 0 $0 19 $62,599 APPLICATIONS DENIED 7 $68,089 62 $60,386 262 $60,165 86 $12,480 2 $170,515 73 $48,009 APPLICATIONS WITHDRAWN 4 $73,338 32 $66,813 114 $57,115 12 $10,467 1 $81,560 14 $39,547 FILES CLOSED FOR INCOMPLETENESS 2 $64,030 12 $55,418 33 $63,278 0 $0 0 $0 14 $48,085
Aggregated Statistics For Year 2001(Based on 1 full and 8 partial tracts) A) FHA, FSA/RHS & VA B) Conventional C) Refinancings D) Home Improvement Loans E) Loans on Dwellings For 5+ Families F) Non-occupant Loans on Number Average Value Number Average Value Number Average Value Number Average Value Number Average Value Number Average Value
LOANS ORIGINATED 50 $72,026 270 $62,843 195 $49,266 44 $16,563 3 $80,127 100 $48,869 APPLICATIONS APPROVED, NOT ACCEPTED 1 $182,580 21 $104,948 41 $45,380 6 $31,963 1 $100,100 13 $33,630 APPLICATIONS DENIED 10 $59,565 80 $51,721 229 $45,370 103 $13,691 2 $1,845,790 36 $39,615 APPLICATIONS WITHDRAWN 0 $0 20 $67,647 101 $48,815 18 $26,772 1 $397,800 8 $41,860 FILES CLOSED FOR INCOMPLETENESS 1 $58,690 10 $71,297 18 $55,805 1 $13,260 0 $0 3 $38,023
Aggregated Statistics For Year 2000(Based on 1 full and 8 partial tracts) A) FHA, FSA/RHS & VA B) Conventional C) Refinancings D) Home Improvement Loans E) Loans on Dwellings For 5+ Families F) Non-occupant Loans on Number Average Value Number Average Value Number Average Value Number Average Value Number Average Value Number Average Value
LOANS ORIGINATED 32 $59,163 152 $47,156 151 $42,537 71 $9,827 1 $746,100 73 $36,730 APPLICATIONS APPROVED, NOT ACCEPTED 2 $51,715 26 $37,925 35 $39,896 26 $13,278 0 $0 16 $33,688 APPLICATIONS DENIED 4 $48,620 70 $45,376 214 $43,275 122 $11,130 0 $0 34 $45,966 APPLICATIONS WITHDRAWN 4 $47,930 18 $65,066 117 $46,204 19 $16,556 1 $2,409,120 13 $48,896 FILES CLOSED FOR INCOMPLETENESS 3 $44,673 11 $60,671 38 $46,151 3 $23,227 0 $0 0 $0
Aggregated Statistics For Year 1999(Based on 1 full and 5 partial tracts) A) FHA, FSA/RHS & VA B) Conventional C) Refinancings D) Home Improvement Loans E) Loans on Dwellings For 5+ Families F) Non-occupant Loans on Number Average Value Number Average Value Number Average Value Number Average Value Number Average Value Number Average Value
LOANS ORIGINATED 20 $52,717 74 $56,004 98 $44,009 37 $11,359 2 $73,400 52 $49,172 APPLICATIONS APPROVED, NOT ACCEPTED 0 $0 15 $49,104 29 $46,383 3 $25,263 0 $0 8 $35,180 APPLICATIONS DENIED 5 $59,062 41 $56,164 130 $40,010 59 $13,699 0 $0 21 $51,057 APPLICATIONS WITHDRAWN 0 $0 15 $65,613 109 $42,797 11 $21,032 0 $0 7 $37,233 FILES CLOSED FOR INCOMPLETENESS 1 $62,070 4 $40,092 28 $46,801 1 $8,990 0 $0 2 $40,000
Private Mortgage Insurance Companies Aggregated Statistics For Year 2009(Based on 6 partial tracts) A) Conventional B) Refinancings C) Non-occupant Loans on Number Average Value Number Average Value Number Average Value
LOANS ORIGINATED 0 $0 0 $0 0 $0 APPLICATIONS APPROVED, NOT ACCEPTED 6 $98,487 1 $142,370 1 $59,220 APPLICATIONS DENIED 0 $0 0 $0 0 $0 APPLICATIONS WITHDRAWN 0 $0 0 $0 0 $0 FILES CLOSED FOR INCOMPLETENESS 0 $0 0 $0 0 $0
Aggregated Statistics For Year 2008(Based on 1 full and 8 partial tracts) A) Conventional B) Refinancings C) Non-occupant Loans on Number Average Value Number Average Value Number Average Value
LOANS ORIGINATED 6 $112,437 5 $155,216 3 $140,153 APPLICATIONS APPROVED, NOT ACCEPTED 8 $120,594 8 $137,438 4 $70,112 APPLICATIONS DENIED 1 $59,220 2 $122,965 1 $59,220 APPLICATIONS WITHDRAWN 1 $76,020 0 $0 0 $0 FILES CLOSED FOR INCOMPLETENESS 1 $76,020 0 $0 1 $76,020
Aggregated Statistics For Year 2007(Based on 1 full and 8 partial tracts) A) Conventional B) Refinancings C) Non-occupant Loans on Number Average Value Number Average Value Number Average Value
LOANS ORIGINATED 51 $125,079 18 $141,049 15 $110,851 APPLICATIONS APPROVED, NOT ACCEPTED 10 $134,376 5 $147,962 1 $182,990 APPLICATIONS DENIED 1 $173,890 0 $0 0 $0 APPLICATIONS WITHDRAWN 1 $132,600 5 $120,082 0 $0 FILES CLOSED FOR INCOMPLETENESS 1 $146,720 2 $281,480 0 $0
Aggregated Statistics For Year 2006(Based on 1 full and 8 partial tracts) A) Conventional B) Refinancings C) Non-occupant Loans on Number Average Value Number Average Value Number Average Value
LOANS ORIGINATED 38 $128,913 12 $139,848 17 $116,280 APPLICATIONS APPROVED, NOT ACCEPTED 10 $134,946 3 $138,953 2 $141,750 APPLICATIONS DENIED 4 $140,605 0 $0 3 $107,913 APPLICATIONS WITHDRAWN 7 $150,341 1 $89,340 2 $105,665 FILES CLOSED FOR INCOMPLETENESS 0 $0 0 $0 0 $0
Aggregated Statistics For Year 2005(Based on 1 full and 8 partial tracts) A) Conventional B) Refinancings C) Non-occupant Loans on Number Average Value Number Average Value Number Average Value
LOANS ORIGINATED 80 $108,703 9 $149,329 38 $94,495 APPLICATIONS APPROVED, NOT ACCEPTED 26 $91,942 1 $102,160 11 $77,698 APPLICATIONS DENIED 5 $136,022 0 $0 2 $133,350 APPLICATIONS WITHDRAWN 8 $105,839 3 $102,700 1 $122,460 FILES CLOSED FOR INCOMPLETENESS 0 $0 0 $0 0 $0
Aggregated Statistics For Year 2004(Based on 1 full and 8 partial tracts) A) Conventional B) Refinancings C) Non-occupant Loans on Number Average Value Number Average Value Number Average Value
LOANS ORIGINATED 107 $81,401 7 $68,410 61 $73,263 APPLICATIONS APPROVED, NOT ACCEPTED 29 $78,222 4 $63,982 15 $62,885 APPLICATIONS DENIED 13 $91,534 0 $0 7 $68,329 APPLICATIONS WITHDRAWN 13 $96,493 0 $0 9 $94,409 FILES CLOSED FOR INCOMPLETENESS 5 $41,512 2 $54,810 0 $0
Aggregated Statistics For Year 2003(Based on 1 full and 8 partial tracts) A) Conventional B) Refinancings C) Non-occupant Loans on Number Average Value Number Average Value Number Average Value
LOANS ORIGINATED 96 $66,418 20 $66,368 39 $62,269 APPLICATIONS APPROVED, NOT ACCEPTED 26 $84,464 6 $61,808 8 $87,198 APPLICATIONS DENIED 3 $78,720 2 $75,140 1 $105,200 APPLICATIONS WITHDRAWN 7 $67,720 2 $49,765 2 $54,275 FILES CLOSED FOR INCOMPLETENESS 0 $0 0 $0 0 $0
Aggregated Statistics For Year 2002(Based on 1 full and 8 partial tracts) A) Conventional B) Refinancings C) Non-occupant Loans on Number Average Value Number Average Value Number Average Value
LOANS ORIGINATED 109 $64,630 14 $63,383 32 $58,456 APPLICATIONS APPROVED, NOT ACCEPTED 24 $66,587 7 $67,303 7 $69,093 APPLICATIONS DENIED 12 $47,782 1 $62,760 6 $47,998 APPLICATIONS WITHDRAWN 10 $88,707 1 $71,600 1 $81,000 FILES CLOSED FOR INCOMPLETENESS 1 $58,690 0 $0 0 $0
Aggregated Statistics For Year 2001(Based on 1 full and 8 partial tracts) A) Conventional B) Refinancings C) Non-occupant Loans on Number Average Value Number Average Value Number Average Value
LOANS ORIGINATED 128 $68,689 14 $66,731 16 $54,156 APPLICATIONS APPROVED, NOT ACCEPTED 13 $60,082 3 $57,470 0 $0 APPLICATIONS DENIED 13 $53,545 1 $119,340 9 $56,460 APPLICATIONS WITHDRAWN 2 $73,370 1 $119,340 0 $0 FILES CLOSED FOR INCOMPLETENESS 2 $72,160 0 $0 1 $38,040
Aggregated Statistics For Year 2000(Based on 1 full and 8 partial tracts) A) Conventional B) Refinancings C) Non-occupant Loans on Number Average Value Number Average Value Number Average Value
LOANS ORIGINATED 44 $53,823 9 $55,434 8 $43,168 APPLICATIONS APPROVED, NOT ACCEPTED 3 $43,430 0 $0 1 $45,080 APPLICATIONS DENIED 8 $89,921 0 $0 1 $45,080 APPLICATIONS WITHDRAWN 2 $53,480 0 $0 0 $0 FILES CLOSED FOR INCOMPLETENESS 0 $0 0 $0 0 $0
Aggregated Statistics For Year 1999(Based on 4 partial tracts) A) Conventional B) Refinancings C) Non-occupant Loans on Number Average Value Number Average Value Number Average Value
LOANS ORIGINATED 12 $47,601 3 $50,753 2 $60,685 APPLICATIONS APPROVED, NOT ACCEPTED 1 $99,180 2 $48,195 0 $0 APPLICATIONS DENIED 3 $54,827 0 $0 0 $0 APPLICATIONS WITHDRAWN 2 $35,925 0 $0 0 $0 FILES CLOSED FOR INCOMPLETENESS 1 $45,460 0 $0 0 $0
2002 - 2018 National Fire Incident Reporting System (NFIRS) incidents See full 2006 National Fire Incident Reporting System statistics for zip code 34950, Florida
Most common first names in zip code 34950 among deceased individuals Name Count Lived (average)
James 91 67.8 years Robert 75 68.5 years Mary 70 77.9 years John 68 74.2 years Willie 56 71.3 years William 47 73.6 years Dorothy 38 74.2 years George 32 74.2 years Joseph 29 72.5 years Richard 27 67.7 years
Most common last names in zip code 34950 among deceased individuals Last name Count Lived (average)
Johnson 59 68.4 years Smith 58 66.8 years Williams 54 72.3 years Jones 38 72.8 years Brown 30 68.6 years Wilson 29 72.9 years Davis 29 71.1 years White 25 60.0 years Jackson 21 70.2 years Robinson 19 68.5 years
Businesses in zip code 34950
Name Count Name Count
7-Eleven 1 Kmart 1 Ace Hardware 1 McDonald's 2 Advance Auto Parts 1 Payless 1 Burger King 2 Popeyes 1 CVS 1 Subway 1 Dunkin Donuts 3 Super 8 1 FedEx 6 U-Haul 1 Havertys Furniture 1 UPS 4 Jones New York 1 Walgreens 2 KFC 1

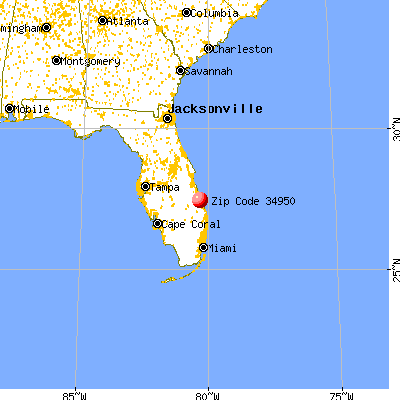


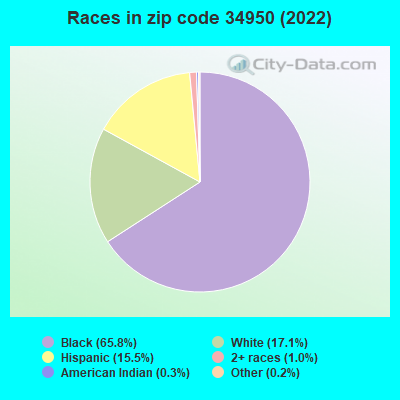


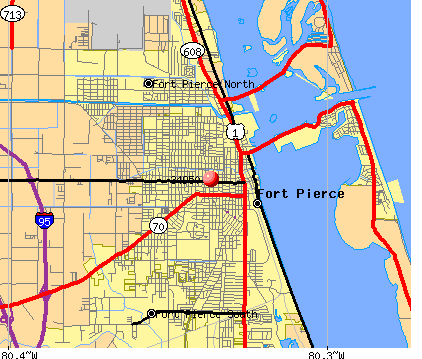 Nearest zip codes: 34949, 34947, 34981, 34946, 34982, 34983.
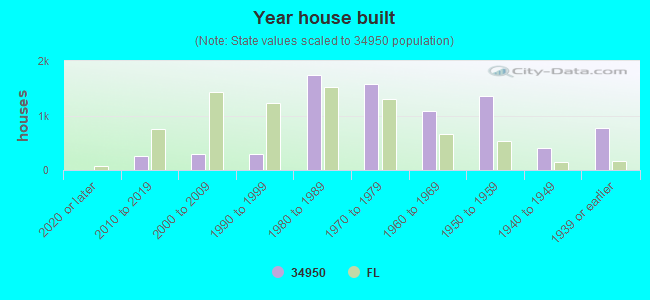

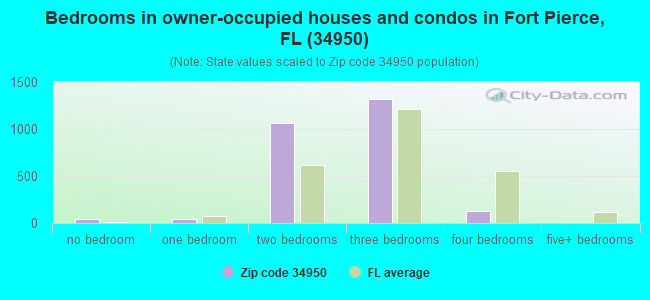
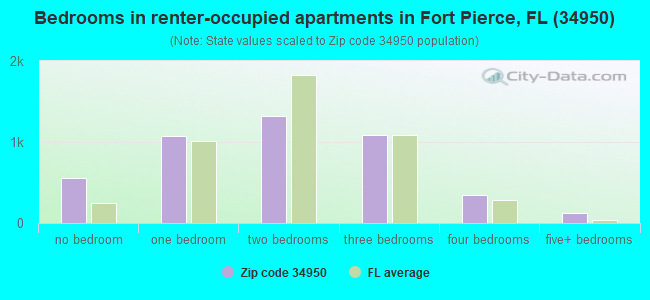
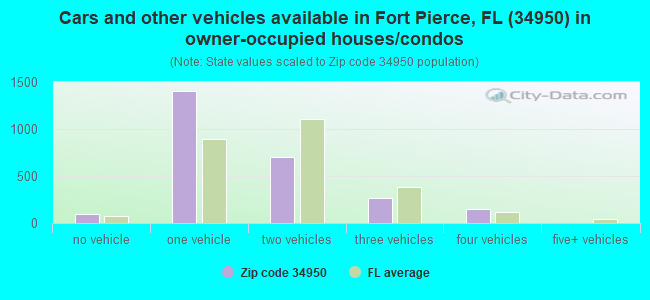
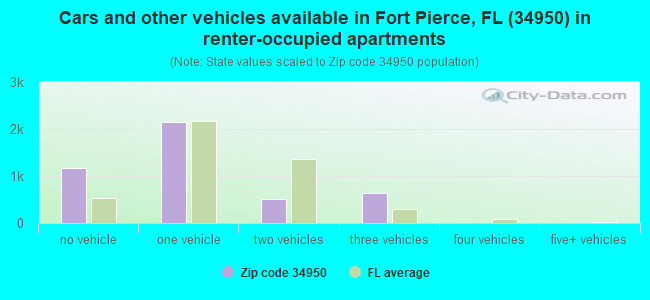


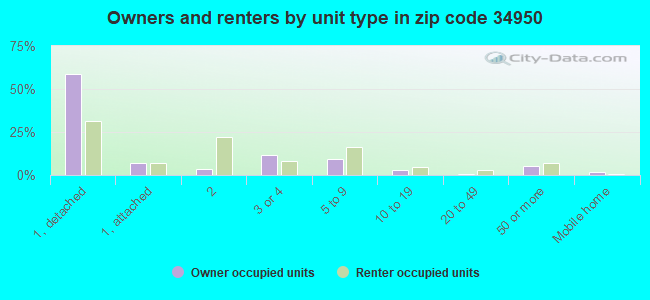
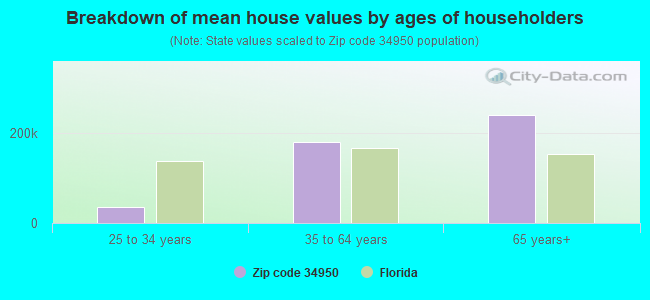


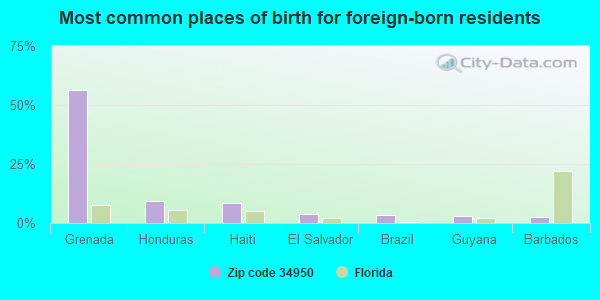
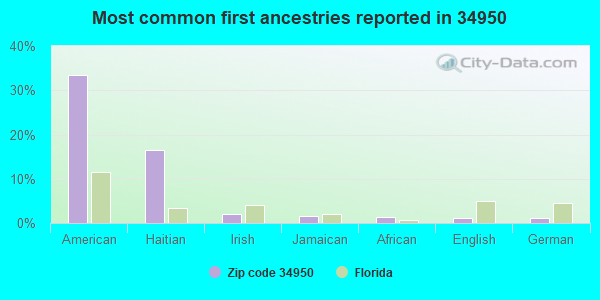
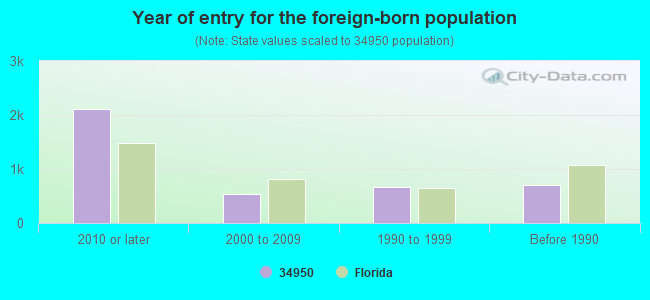
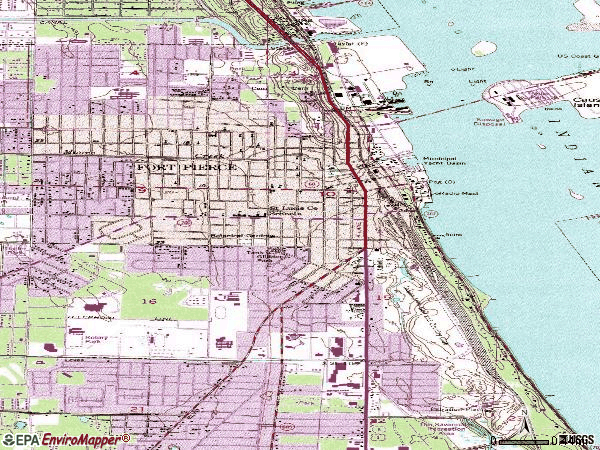

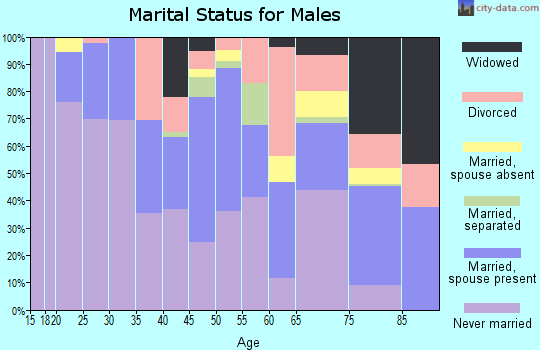

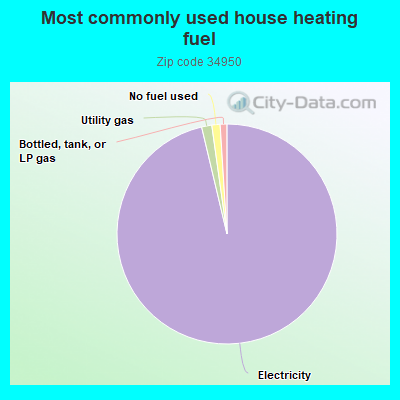
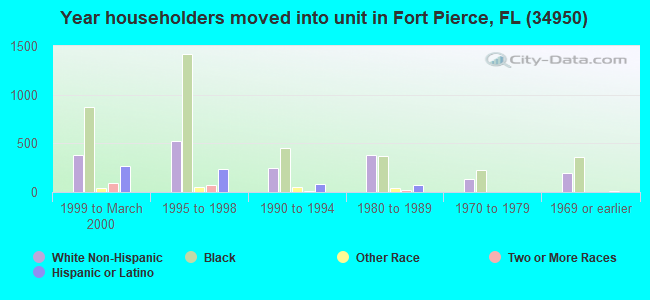
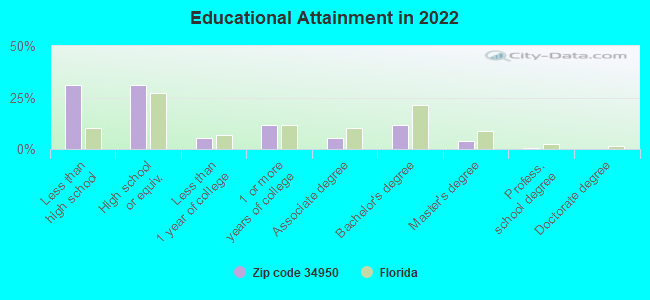
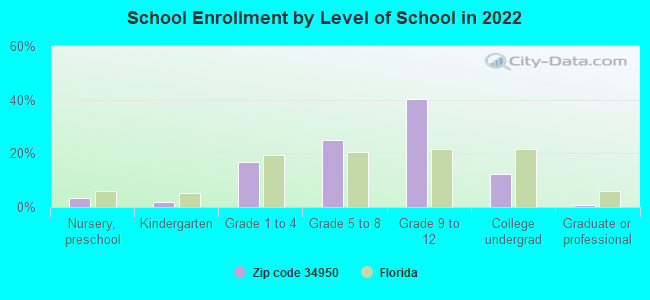
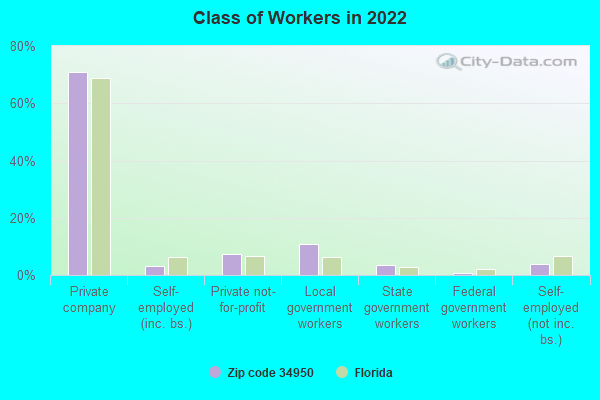
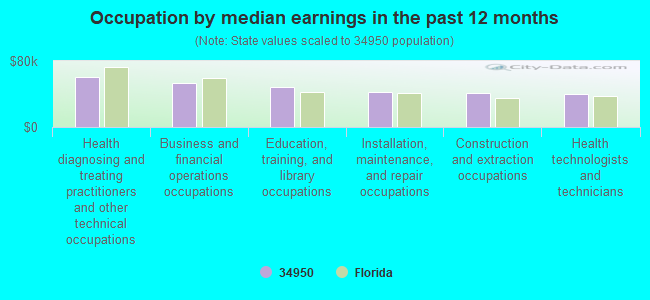
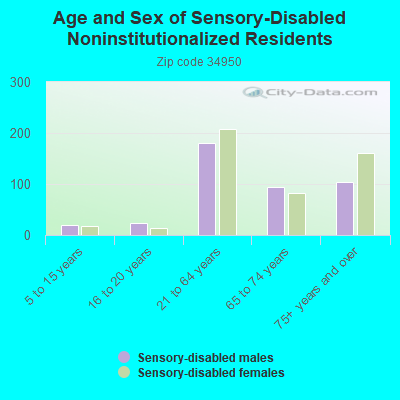
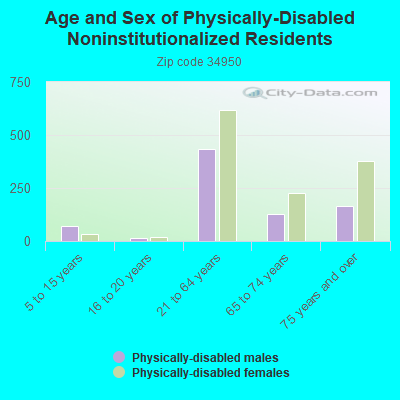
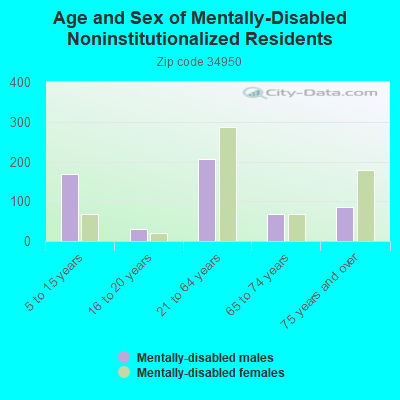
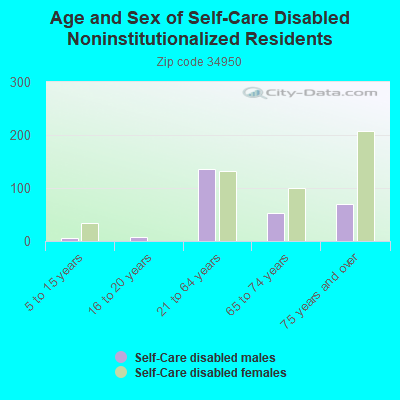
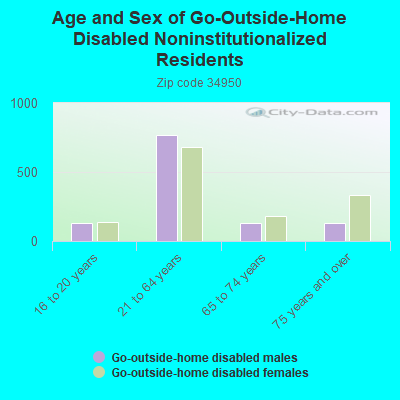
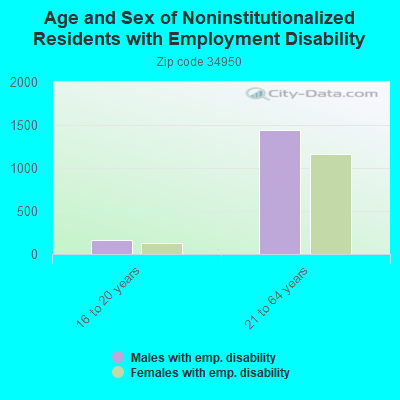
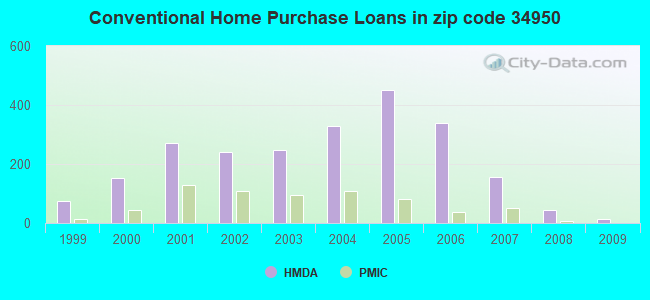
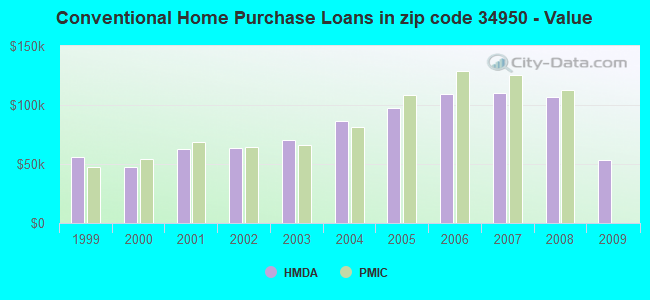
 Based on the data from the years 2002 - 2018 the average number of fire incidents per year is 118. The highest number of reported fires - 253 took place in 2003, and the least - 0 in 2009. The data has a decreasing trend.
 When looking into fire subcategories, the most reports belonged to: Outside Fires (48.0%), and Structure Fires (27.7%).